Automotive Performance Accessories Market Size and Share Forecast Outlook (2023 to 2033)

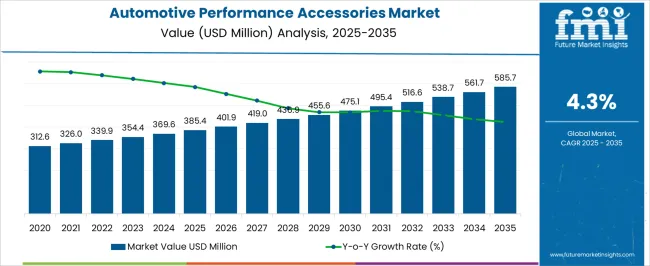
As per the detailed report on the Automotive Performance Accessories market by Future Market Insights, global sales of Automotive Performance Accessories reached USD 297.8 million in 2018. Y-o-Y market growth was recorded at 3.5% in 2022 with revenue expected to reach USD 352.9 million in 2023. The Global Automotive Performance Accessories market is projected to reach USD 546.4 million by end of 2033 representing 4.5% CAGR between 2023 to 2033.

The importance of Automotive Performance Accessories is their potential to improve a vehicle’s overall performance and look. They are being utilized to improve the car handling, performance and overall driving experience.

Other Drivers Propelling the Demand for Automotive Performance Accessories include:

  • Increase in the popularity of sports, vintage cars and customized vehicles among consumers, require multiple combination of performance accessories. Especially it has become a necessity for the vintage car users to keep their vehicle updated with looks and overall performance.
  • The increasing popularity of off-road vehicles such as Jeeps and trucks which are usually bought for adventure touring, requires to be equipped with calibrated suspensions and braking drives the demand.
  • In North America and Japan underground racing is still a hobby for many car enthusiasts. These category of consumers keep their cars updated with high performance accessories in order to compete with other car owners.

Challenges for Companies/Manufacturers in the Automotive Performance Accessories Market:

  • Manufacturers are facing design limitations as these performance accessories are installed by different types of vehicles and each one of them requires a different fit respecting to the space constraints.
  • Increasing modification of vehicles has led to a significant increase in sound and air pollution. The government of many countries have implied major regulations on air and noise pollution control by imposing fine on the vehicles equipped with accessories promoting pollution. These actions by the government led to decrease in demand from consumers.
  • Increasing adoption of electric vehicles adversely affects the performance accessories manufacturers as the associated accessories such as mufflers, exhaust pipes, air filters and fuel injectors finds no application in the EV sector.
  • The installation of turbochargers and superchargers resulted in increased fuel consumption and carbon emissions, and these performance accessories are more likely to impact engine performance negatively over time.

Opportunities in the Automotive Performance Accessories Market:

  • Increase in popularity of motor racing sports and off road events around the world which require high performance cars/trucks. Consumers modify their vehicles for these events by installing front fitted exhaust systems and high end performance parts like fuel air & intake system and many others.
  • As the EV sector is continuously rising and considered to be in the development phase, performance accessories manufacturers can focus on expanding their product portfolio for the EV sector as well. Currently, EV users utilizes only a limited portfolio of the performance accessories like Brake and Suspension System categories.

Latest Trends in the Automotive Performance Accessories Market:

  • The active suspension system are adopted recently and these advance suspension technology improved the vehicle handling and stability while loss of traction. The active suspension system also helps sports car drivers to take sharp turns, perform drifts and other activities on the track.
  • Active exhaust valve systems are gaining popularity which allows driver to adjust the sound profile of their vehicles. It offers customizable exhaust notes from quiet and refined to aggressive and sporty. Also, when fully loaded vehicles drives with closed exhaust valves it can damage the engine. By using active exhaust valve system, the valve is opened when the revs goes above 5,000 RPM in order to protect engine.
Attributes Details
Automotive Performance Accessories Market Size (2023) USD 352.9 million
Automotive Performance Accessories Market Projected Size (2033) USD 546.4 million
Value CAGR (2023 to 2033) 4.5%

Comparison of Historical vs Future Outlook for Automotive Performance Accessories Market (2018 to 2033)

From 2018 to 2022, the global Automotive Performance Accessories market experienced a CAGR of 3.5%, reaching a market size of USD 352.9 million in 2023.

The growing demand for customization among automotive enthusiasts was one of the key drivers of this expansion. Consumers sought to customize and improve the performance of their automobiles, fueling the demand for performance accessories such as turbochargers, exhaust systems and suspension improvements. Sporting events also played an important influence in strengthening the market.

Major Motorsports events like Formula 1, NASCAR and the World Rally Championship have sparked public interest in performance improvements for their own automobiles. Furthermore, the rise of off-road vehicles such as trucks and SUVs aided market expansion. Lifted suspensions and front-end exhausts were sought after by off-road enthusiasts to optimize their vehicles for adventurous travels.

Future Forecast for Automotive Performance Accessories Market

From 2023 to 2033, the worldwide Automotive Performance Accessories industry is predicted to grow at a CAGR of 4.5%. The market is anticipated to reach USD 546.4 million over the forecast period.

The Automotive Performance Accessories business is expected to sustain its growth trajectory from 2023 to 2033, with the market benefiting significantly from the ongoing expansion of vintage car restoration and customization.

To retain the authenticity and performance of their valued automobiles, classic car collectors and enthusiasts will seek high-quality, period-correct accessories. As per the updated regulations by the government globally there will be an expansion in the product portfolio in the automotive performance accessories catering to the components creating less amount of noise and air pollution.

Analysis of Top Countries Adopting Automotive Performance Accessories

Automotive Performance Accessories Market to grow in the United States As customer trends towards modification of Vintage cars.

Country The United States
Market Size (USD million) by End of Forecast Period (2033) USD 92.8 million
CAGR % 2023 to End of Forecast (2033) 4.7%

The Automotive Performance Accessories industry in the United States is expected to reach a market share of USD 92.8 million by 2033, expanding at a CAGR of 4.7%.

The automotive performance accessory market in the United States is growing, catering to a wide range of cars, jeeps and trucks. The obsession with vintage cars is the highest in the United States. Vintage car enthusiasts in the United States are passionate about the preservation and restoration of automobiles, and they seek performance additions that improve both looks and performance of these traditional vehicles.

Engine enhancements, suspension adjustments and braking systems are just a few of the products available from companies specializing in performance oriented accessories. These Vintage Cars are auctioned at very high price which convinces these cars collectors to keep their vehicles updated up to the required performance levels.

Notable Growth Expected in China's Automotive Performance Accessories Market as increase in Motorsport event.

Country China
Market Size (USD million) by End of Forecast Period (2033) USD 109.2 million
CAGR % 2023 to End of Forecast (2033) 4.7%

The Automotive Performance Accessories industry in China is anticipated to reach a market share of USD 109.2 million, moving at a CAGR of 4.7% during the forecast period.

With the establishment of various racetracks and the organization of international events, China has positioned itself as an emerging force in the racing world. The Shanghai International Circuit, home to the Formula 1 Chinese Grand Prix, has become an iconic venue attracting top-tier racing companies like Ferrari and many other domestic players. These companies are more focused to upgrade their vehicle with high performance accessories to make themselves forefront in the racing events.
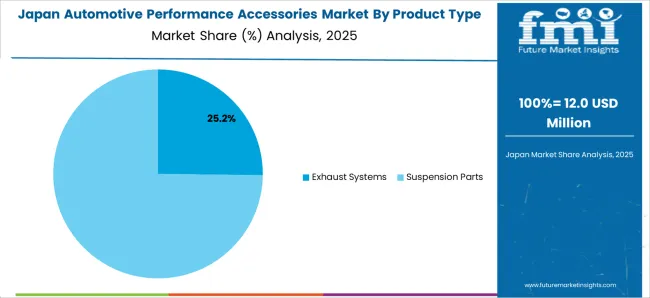
Underground racing to boost Automotive Performance Accessories Market in Japan

Country Japan
Market Size (USD million) by End of Forecast Period (2033) USD 43.7 million
CAGR % 2023 to End of Forecast (2033) 4.5%

The Automotive Performance Accessories industry in Japan is estimated to reach a market share of USD 43.7 million by 2033, thriving at a CAGR of 4.5%.

With a strong focus on technological advancements and precision engineering, Japanese performance accessories are renowned for their reliability and efficiency. The market offers an extensive range of high-performance parts and accessories, allowing car enthusiasts to enhance their vehicles power, handling and aesthetics. From renowned tuners like HKS and Tomei to specialized workshops and manufacturers Japan provides a vast array of options for enthusiasts seeking to upgrade their vehicles.

The popularity of events like Tokyo Auto Salon showcases the widespread admiration for automotive customization and performance tuning in Japan. The country's rich motorsport heritage including prestigious racing events like Super GT and Super Formula demonstrates the enduring passion for high-performance vehicles.

Automotive Performance Accessories Industry Analysis by Category

How Exhaust System are playing important role in the Automotive Performance Accessories Industry?

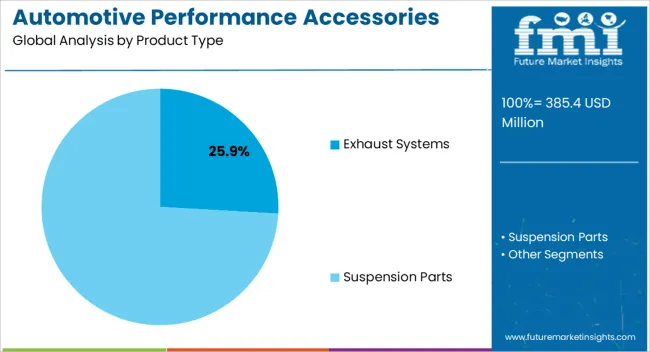
By product type, Exhaust System segment is expected to dominate the Automotive Performance Accessories industry with a CAGR of 4.7% from 2022 to 2033. This segment captures a significant market share in 2023 due to its customization in Exhaust system.

As the Performance Exhaust systems are designed with larger diameter pipes and less restrictive mufflers, allowing for greater exhaust flow, consumers will focus to upgrade their vehicles. Upgrading to a performance exhaust system is a popular and effective technique to increase horsepower and torque, improve throttle response and improve a high-performance vehicle's overall driving experience.

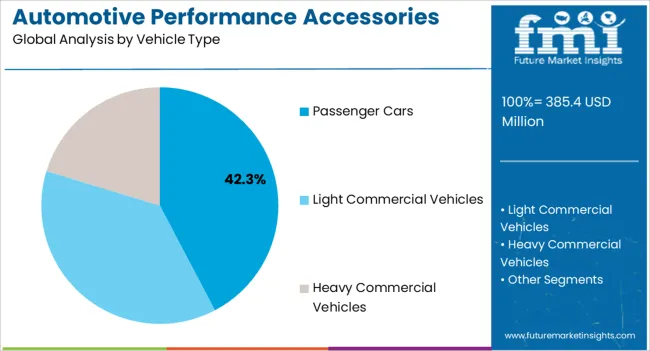
By Vehicle Type, Passenger Car segment is dominating the Automotive Performance Accessories Industry with market share of 62.3% through 2033

By Vehicle type, Passenger Car segment is dominating the Automotive Performance Accessories industry with a market share of 62.3% from 2022 to 2033. Most of the automotive performance accessories are a great fit for the passenger cars respecting to the engine and size specifications. Most of the motorsports require lightweight cars to show the best performance of their accessories. Also most of the vehicles present in the market are in the passenger car category.
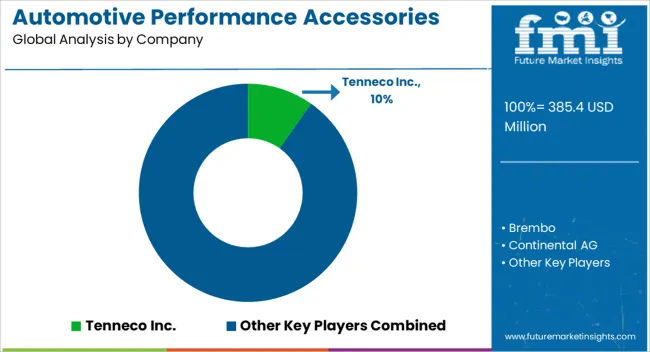
Competitive Landscape of the Automotive Performance Accessories Market

The Automotive Performance Accessories sector is fiercely competitive, with many companies striving for market dominance. To stay ahead of the competition in such a circumstance, essential players must employ smart techniques.

Key Strategies Adopted by the Players

Product Innovation

Companies invest heavily in Research and development to deliver novel products that improve efficiency, dependability, and cost-effectiveness. Product innovation allows businesses to differentiate themselves from their competition while also catering to the changing demands of their clients.

Strategic Partnerships and Collaborations

Key firms in the sector frequently develop strategic partnerships and collaborations with other companies in order to harness their strengths and increase their market reach. Such alliances can allow businesses to obtain access to new technology and markets.

Expansion into Emerging Markets

The Automotive Performance Accessories sector is expanding rapidly in emerging regions such as China and India. Key companies are increasing their presence in these markets by developing local manufacturing facilities and enhancing their distribution networks.

Mergers and Acquisitions

Mergers and acquisitions are frequently used by key players in the Automotive Performance Accessories business to consolidate their market position, expand their product portfolio and gain access to new markets.

Key Players in the Automotive Performance Accessories Industry

  • Tenneco Inc.
  • Brembo
  • Continental AG
  • BorgWarner Inc.
  • Mahle GmbH
  • Hyundai Mobis
  • Donaldson Company Inc.
  • Mitsubishi Heavy Industries, Ltd
  • ZF Friedrichshafen AG
  • Honeywell International Inc.
  • EXEDY Corporation
  • Denso Corporation
  • Holley Performance Products
  • AISIN SEIKI Co., Ltd.
  • Hitachi Astemo, Ltd.
  • Robert Bosch GmbH
  • The NGK Spark Plug Co., Ltd.
  • Cummins Inc.
  • Valeo
  • TREMEC

Key Developments in the Automotive Performance Accessories Market:

  • In 2021, Lippert Components acquires Kaspar Ranch Hand Equipment, a firm that pioneered the heavy-duty truck accessory industry by being one of the first to develop and engineer specialized equipment specifically fitted to the owners' vehicles.
  • In 2023, Rivian Automotive has chosen Tenneco to deliver suspension and anti-vibration performance materials solutions.
  • In 2023, Continental AG creates a brake caliper that minimizes brake dust. The new Green Caliper's lower wear rate allows Continental to make the setup more compact and employ smaller and thinner pads. Furthermore, the brake is 5 kg lighter on each corner, which improves range while also contributing to better handling due to the decreased unsprung weight.

Top Segments Studied in the Automotive Performance Accessories Market Research Report

By Product Type:

  • Exhaust Systems
    • Headers
    • Mufflers
    • Oxygen Sensors
    • Exhaust Pipes
  • Suspension Parts
    • Suspension Bushing
    • Sway Bars
    • Shock Absorbers
  • Brakes
    • Brake Pads
    • Brake Rotors
    • Brake Caliper
    • Brake Lines
    • Brake Master Cylinders
    • Vacuum Pumps
  • Fuel Air & Intake Systems
    • Air Filters
    • MAF Sensor
    • Intake Manifold
    • Throttle Bodies
    • Fuel Filters
    • Spark Plugs
    • Fuel Injectors
    • Fuel Pumps
  • Transmission Parts
    • Clutch Pressure Plates
    • Flywheels
    • Torque Converters
    • Clutch Linkage
  • Power Adders
    • Turbochargers
    • Intercoolers
    • Nitrous Oxide Systems
    • Superchargers

By Vehicle Type:

  • Passenger Cars
      • Compact
      • Mid-Size
      • SUV
      • Luxury
  • Light Commercial Vehicles
  • Heavy Commercial Vehicles

By Sales Channel:

  • First Fit
  • Aftermarket

By Region:

  • North America
  • Latin America
  • Eastern Europe
  • Western Europe
  • East Asia
  • South Asia & Pacific
  • The Middle East & Africa

Table of Content

  • 1. Executive Summary
  • 2. Market Overview
  • 3. Key Market Trends
  • 4. Key Success Factors
  • 5. Global Market Demand Analysis 2018 to 2022 and Forecast, 2023 to 2033
  • 6. Global Market - Pricing Analysis
  • 7. Global Market Demand (in Value or Size in USD Million) Analysis 2018 to 2022 and Forecast, 2023 to 2033
  • 8. Market Background
  • 9. Global Market Analysis 2018 to 2022 and Forecast 2023 to 2033, By Product Type
    • 9.1. Exhaust Systems
      • 9.1.1. Headers
      • 9.1.2. Mufflers
      • 9.1.3. Oxygen Sensors
      • 9.1.4. Exhaust Pipes
    • 9.2. Suspension Parts
      • 9.2.1. Suspension Bushing
      • 9.2.2. Sway Bars
      • 9.2.3. Shock Absorbers
    • 9.3. Brakes
      • 9.3.1. Brake Pads
      • 9.3.2. Brake Rotors
      • 9.3.3. Brake Caliper
      • 9.3.4. Brake Lines
      • 9.3.5. Brake Master Cylinders
      • 9.3.6. Vacuum Pumps
    • 9.4. Fuel Air & Intake Systems
      • 9.4.1. Air Filters
      • 9.4.2. MAF Sensor
      • 9.4.3. Intake Manifold
      • 9.4.4. Throttle Bodies
      • 9.4.5. Fuel Filters
      • 9.4.6. Spark Plugs
      • 9.4.7. Fuel Injectors
      • 9.4.8. Fuel Pumps
    • 9.5. Transmission Parts
      • 9.5.1. Clutch Pressure Plates
      • 9.5.2. Flywheels
      • 9.5.3. Torque Converters
      • 9.5.4. Clutch Linkage
    • 9.6. Power Adders
      • 9.6.1. Turbochargers
      • 9.6.2. Intercoolers
      • 9.6.3. Nitrous Oxide Systems
      • 9.6.4. Superchargers
  • 10. Global Market Analysis 2018 to 2022 and Forecast 2023 to 2033, By Vehicle Type
    • 10.1. Passenger Cars
      • 10.1.1. Compact
      • 10.1.2. Mid-Size
      • 10.1.3. SUV
      • 10.1.4. Luxury
    • 10.2. Light Commercial Vehicles
    • 10.3. Heavy Commercial Vehicles
  • 11. Global Market Analysis 2018 to 2022 and Forecast 2023 to 2033, By Sales Channel
    • 11.1. First Fit
    • 11.2. Aftermarket
  • 12. Global Market Analysis 2018 to 2022 and Forecast 2023 to 2033, by Region
    • 12.1. North America
    • 12.2. Latin America
    • 12.3. Western Europe
    • 12.4. Eastern Europe
    • 12.5. East Asia
    • 12.6. South Asia and Pacific
    • 12.7. Middle East and Africa (MEA)
  • 13. North America Market Analysis 2018 to 2022 and Forecast 2023 to 2033
  • 14. Latin America Market Analysis 2018 to 2022 and Forecast 2023 to 2033
  • 15. Western Europe Market Analysis 2018 to 2022 and Forecast 2023 to 2033
  • 16. Eastern Europe Market Analysis 2018 to 2022 and Forecast 2023 to 2033
  • 17. East Asia Market Analysis 2018 to 2022 and Forecast 2023 to 2033
  • 18. South Asia and Pacific Market Analysis 2018 to 2022 and Forecast 2023 to 2033
  • 19. Middle East and Africa Market Analysis 2018 to 2022 and Forecast 2023 to 2033
  • 20. Country-wise Market Analysis
  • 21. Market Structure Analysis
  • 22. Competition Analysis
    • 22.1. Tenneco Inc.
    • 22.2. Brembo
    • 22.3. Robert Bosch GmbH
    • 22.4. Continental AG
    • 22.5. BorgWarner Inc.
    • 22.6. Mahle GmbH
    • 22.7. Donaldson Company Inc.
    • 22.8. Holley Performance Products
    • 22.9. Mitsubishi Heavy Industries, Ltd.
    • 22.10. Honeywell International Inc.
    • 22.11. EXEDY Corporation
    • 22.12. Denso Corporation
    • 22.13. AISIN SEIKI Co., Ltd.
    • 22.14. Hitachi Astemo, Ltd.
    • 22.15. The NGK Spark Plug Co., Ltd.
    • 22.16. Cummins Inc.
    • 22.17. ZF Friedrichshafen AG
    • 22.18. Valeo
    • 22.19. TREMEC
    • 22.20. Hyundai Mobis
  • 23. Assumptions and Acronyms Used
  • 24. Research Methodology

List of Tables

Table 1: Global Market Value (US$ Million) Forecast by Region, 2018 & 2033

Table 2: Global Market Volume (Units) Forecast by Region, 2018 & 2033

Table 3: Global Market Value (US$ Million) Forecast by Product Type, 2018 & 2033

Table 4: Global Market Volume (Units) Forecast by Product Type, 2018 & 2033

Table 5: Global Market Value (US$ Million) Forecast by Vehicle Type, 2018 & 2033

Table 6: Global Market Volume (Units) Forecast by Vehicle Type, 2018 & 2033

Table 7: Global Market Value (US$ Million) Forecast by Sales Channel, 2018 & 2033

Table 8: Global Market Volume (Units) Forecast by Sales Channel, 2018 & 2033

Table 9: North America Market Value (US$ Million) Forecast by Country, 2018 & 2033

Table 10: North America Market Volume (Units) Forecast by Country, 2018 & 2033

Table 11: North America Market Value (US$ Million) Forecast by Product Type, 2018 & 2033

Table 12: North America Market Volume (Units) Forecast by Product Type, 2018 & 2033

Table 13: North America Market Value (US$ Million) Forecast by Vehicle Type, 2018 & 2033

Table 14: North America Market Volume (Units) Forecast by Vehicle Type, 2018 & 2033

Table 15: North America Market Value (US$ Million) Forecast by Sales Channel, 2018 & 2033

Table 16: North America Market Volume (Units) Forecast by Sales Channel, 2018 & 2033

Table 17: Latin America Market Value (US$ Million) Forecast by Country, 2018 & 2033

Table 18: Latin America Market Volume (Units) Forecast by Country, 2018 & 2033

Table 19: Latin America Market Value (US$ Million) Forecast by Product Type, 2018 & 2033

Table 20: Latin America Market Volume (Units) Forecast by Product Type, 2018 & 2033

Table 21: Latin America Market Value (US$ Million) Forecast by Vehicle Type, 2018 & 2033

Table 22: Latin America Market Volume (Units) Forecast by Vehicle Type, 2018 & 2033

Table 23: Latin America Market Value (US$ Million) Forecast by Sales Channel, 2018 & 2033

Table 24: Latin America Market Volume (Units) Forecast by Sales Channel, 2018 & 2033

Table 25: Western Europe Market Value (US$ Million) Forecast by Country, 2018 & 2033

Table 26: Western Europe Market Volume (Units) Forecast by Country, 2018 & 2033

Table 27: Western Europe Market Value (US$ Million) Forecast by Product Type, 2018 & 2033

Table 28: Western Europe Market Volume (Units) Forecast by Product Type, 2018 & 2033

Table 29: Western Europe Market Value (US$ Million) Forecast by Vehicle Type, 2018 & 2033

Table 30: Western Europe Market Volume (Units) Forecast by Vehicle Type, 2018 & 2033

Table 31: Western Europe Market Value (US$ Million) Forecast by Sales Channel, 2018 & 2033

Table 32: Western Europe Market Volume (Units) Forecast by Sales Channel, 2018 & 2033

Table 33: Eastern Europe Market Value (US$ Million) Forecast by Country, 2018 & 2033

Table 34: Eastern Europe Market Volume (Units) Forecast by Country, 2018 & 2033

Table 35: Eastern Europe Market Value (US$ Million) Forecast by Product Type, 2018 & 2033

Table 36: Eastern Europe Market Volume (Units) Forecast by Product Type, 2018 & 2033

Table 37: Eastern Europe Market Value (US$ Million) Forecast by Vehicle Type, 2018 & 2033

Table 38: Eastern Europe Market Volume (Units) Forecast by Vehicle Type, 2018 & 2033

Table 39: Eastern Europe Market Value (US$ Million) Forecast by Sales Channel, 2018 & 2033

Table 40: Eastern Europe Market Volume (Units) Forecast by Sales Channel, 2018 & 2033

Table 41: East Asia Market Value (US$ Million) Forecast by Country, 2018 & 2033

Table 42: East Asia Market Volume (Units) Forecast by Country, 2018 & 2033

Table 43: East Asia Market Value (US$ Million) Forecast by Product Type, 2018 & 2033

Table 44: East Asia Market Volume (Units) Forecast by Product Type, 2018 & 2033

Table 45: East Asia Market Value (US$ Million) Forecast by Vehicle Type, 2018 & 2033

Table 46: East Asia Market Volume (Units) Forecast by Vehicle Type, 2018 & 2033

Table 47: East Asia Market Value (US$ Million) Forecast by Sales Channel, 2018 & 2033

Table 48: East Asia Market Volume (Units) Forecast by Sales Channel, 2018 & 2033

Table 49: South Asia Market Value (US$ Million) Forecast by Country, 2018 & 2033

Table 50: South Asia Market Volume (Units) Forecast by Country, 2018 & 2033

Table 51: South Asia Market Value (US$ Million) Forecast by Product Type, 2018 & 2033

Table 52: South Asia Market Volume (Units) Forecast by Product Type, 2018 & 2033

Table 53: South Asia Market Value (US$ Million) Forecast by Vehicle Type, 2018 & 2033

Table 54: South Asia Market Volume (Units) Forecast by Vehicle Type, 2018 & 2033

Table 55: South Asia Market Value (US$ Million) Forecast by Sales Channel, 2018 & 2033

Table 56: South Asia Market Volume (Units) Forecast by Sales Channel, 2018 & 2033

Table 57: MEA Market Value (US$ Million) Forecast by Country, 2018 & 2033

Table 58: MEA Market Volume (Units) Forecast by Country, 2018 & 2033

Table 59: MEA Market Value (US$ Million) Forecast by Product Type, 2018 & 2033

Table 60: MEA Market Volume (Units) Forecast by Product Type, 2018 & 2033

Table 61: MEA Market Value (US$ Million) Forecast by Vehicle Type, 2018 & 2033

Table 62: MEA Market Volume (Units) Forecast by Vehicle Type, 2018 & 2033

Table 63: MEA Market Value (US$ Million) Forecast by Sales Channel, 2018 & 2033

Table 64: MEA Market Volume (Units) Forecast by Sales Channel, 2018 & 2033

List of Figures

Figure 1: Global Market Value (US$ Million) by Product Type, 2023 & 2033

Figure 2: Global Market Value (US$ Million) by Vehicle Type, 2023 & 2033

Figure 3: Global Market Value (US$ Million) by Sales Channel, 2023 & 2033

Figure 4: Global Market Value (US$ Million) by Region, 2023 & 2033

Figure 5: Global Market Value (US$ Million) Analysis by Region, 2018 & 2033

Figure 6: Global Market Volume (Units) Analysis by Region, 2018 & 2033

Figure 7: Global Market Value Share (%) and BPS Analysis by Region, 2023 & 2033

Figure 8: Global Market Y-o-Y Growth (%) Projections by Region, 2023 to 2033

Figure 9: Global Market Value (US$ Million) Analysis by Product Type, 2018 & 2033

Figure 10: Global Market Volume (Units) Analysis by Product Type, 2018 & 2033

Figure 11: Global Market Value Share (%) and BPS Analysis by Product Type, 2023 & 2033

Figure 12: Global Market Y-o-Y Growth (%) Projections by Product Type, 2023 to 2033

Figure 13: Global Market Value (US$ Million) Analysis by Vehicle Type, 2018 & 2033

Figure 14: Global Market Volume (Units) Analysis by Vehicle Type, 2018 & 2033

Figure 15: Global Market Value Share (%) and BPS Analysis by Vehicle Type, 2023 & 2033

Figure 16: Global Market Y-o-Y Growth (%) Projections by Vehicle Type, 2023 to 2033

Figure 17: Global Market Value (US$ Million) Analysis by Sales Channel, 2018 & 2033

Figure 18: Global Market Volume (Units) Analysis by Sales Channel, 2018 & 2033

Figure 19: Global Market Value Share (%) and BPS Analysis by Sales Channel, 2023 & 2033

Figure 20: Global Market Y-o-Y Growth (%) Projections by Sales Channel, 2023 to 2033

Figure 21: Global Market Attractiveness by Product Type, 2023 to 2033

Figure 22: Global Market Attractiveness by Vehicle Type, 2023 to 2033

Figure 23: Global Market Attractiveness by Sales Channel, 2023 to 2033

Figure 24: Global Market Attractiveness by Region, 2023 to 2033

Figure 25: North America Market Value (US$ Million) by Product Type, 2023 & 2033

Figure 26: North America Market Value (US$ Million) by Vehicle Type, 2023 & 2033

Figure 27: North America Market Value (US$ Million) by Sales Channel, 2023 & 2033

Figure 28: North America Market Value (US$ Million) by Country, 2023 & 2033

Figure 29: North America Market Value (US$ Million) Analysis by Country, 2018 & 2033

Figure 30: North America Market Volume (Units) Analysis by Country, 2018 & 2033

Figure 31: North America Market Value Share (%) and BPS Analysis by Country, 2023 & 2033

Figure 32: North America Market Y-o-Y Growth (%) Projections by Country, 2023 to 2033

Figure 33: North America Market Value (US$ Million) Analysis by Product Type, 2018 & 2033

Figure 34: North America Market Volume (Units) Analysis by Product Type, 2018 & 2033

Figure 35: North America Market Value Share (%) and BPS Analysis by Product Type, 2023 & 2033

Figure 36: North America Market Y-o-Y Growth (%) Projections by Product Type, 2023 to 2033

Figure 37: North America Market Value (US$ Million) Analysis by Vehicle Type, 2018 & 2033

Figure 38: North America Market Volume (Units) Analysis by Vehicle Type, 2018 & 2033

Figure 39: North America Market Value Share (%) and BPS Analysis by Vehicle Type, 2023 & 2033

Figure 40: North America Market Y-o-Y Growth (%) Projections by Vehicle Type, 2023 to 2033

Figure 41: North America Market Value (US$ Million) Analysis by Sales Channel, 2018 & 2033

Figure 42: North America Market Volume (Units) Analysis by Sales Channel, 2018 & 2033

Figure 43: North America Market Value Share (%) and BPS Analysis by Sales Channel, 2023 & 2033

Figure 44: North America Market Y-o-Y Growth (%) Projections by Sales Channel, 2023 to 2033

Figure 45: North America Market Attractiveness by Product Type, 2023 to 2033

Figure 46: North America Market Attractiveness by Vehicle Type, 2023 to 2033

Figure 47: North America Market Attractiveness by Sales Channel, 2023 to 2033

Figure 48: North America Market Attractiveness by Country, 2023 to 2033

Figure 49: Latin America Market Value (US$ Million) by Product Type, 2023 & 2033

Figure 50: Latin America Market Value (US$ Million) by Vehicle Type, 2023 & 2033

Figure 51: Latin America Market Value (US$ Million) by Sales Channel, 2023 & 2033

Figure 52: Latin America Market Value (US$ Million) by Country, 2023 & 2033

Figure 53: Latin America Market Value (US$ Million) Analysis by Country, 2018 & 2033

Figure 54: Latin America Market Volume (Units) Analysis by Country, 2018 & 2033

Figure 55: Latin America Market Value Share (%) and BPS Analysis by Country, 2023 & 2033

Figure 56: Latin America Market Y-o-Y Growth (%) Projections by Country, 2023 to 2033

Figure 57: Latin America Market Value (US$ Million) Analysis by Product Type, 2018 & 2033

Figure 58: Latin America Market Volume (Units) Analysis by Product Type, 2018 & 2033

Figure 59: Latin America Market Value Share (%) and BPS Analysis by Product Type, 2023 & 2033

Figure 60: Latin America Market Y-o-Y Growth (%) Projections by Product Type, 2023 to 2033

Figure 61: Latin America Market Value (US$ Million) Analysis by Vehicle Type, 2018 & 2033

Figure 62: Latin America Market Volume (Units) Analysis by Vehicle Type, 2018 & 2033

Figure 63: Latin America Market Value Share (%) and BPS Analysis by Vehicle Type, 2023 & 2033

Figure 64: Latin America Market Y-o-Y Growth (%) Projections by Vehicle Type, 2023 to 2033

Figure 65: Latin America Market Value (US$ Million) Analysis by Sales Channel, 2018 & 2033

Figure 66: Latin America Market Volume (Units) Analysis by Sales Channel, 2018 & 2033

Figure 67: Latin America Market Value Share (%) and BPS Analysis by Sales Channel, 2023 & 2033

Figure 68: Latin America Market Y-o-Y Growth (%) Projections by Sales Channel, 2023 to 2033

Figure 69: Latin America Market Attractiveness by Product Type, 2023 to 2033

Figure 70: Latin America Market Attractiveness by Vehicle Type, 2023 to 2033

Figure 71: Latin America Market Attractiveness by Sales Channel, 2023 to 2033

Figure 72: Latin America Market Attractiveness by Country, 2023 to 2033

Figure 73: Western Europe Market Value (US$ Million) by Product Type, 2023 & 2033

Figure 74: Western Europe Market Value (US$ Million) by Vehicle Type, 2023 & 2033

Figure 75: Western Europe Market Value (US$ Million) by Sales Channel, 2023 & 2033

Figure 76: Western Europe Market Value (US$ Million) by Country, 2023 & 2033

Figure 77: Western Europe Market Value (US$ Million) Analysis by Country, 2018 & 2033

Figure 78: Western Europe Market Volume (Units) Analysis by Country, 2018 & 2033

Figure 79: Western Europe Market Value Share (%) and BPS Analysis by Country, 2023 & 2033

Figure 80: Western Europe Market Y-o-Y Growth (%) Projections by Country, 2023 to 2033

Figure 81: Western Europe Market Value (US$ Million) Analysis by Product Type, 2018 & 2033

Figure 82: Western Europe Market Volume (Units) Analysis by Product Type, 2018 & 2033

Figure 83: Western Europe Market Value Share (%) and BPS Analysis by Product Type, 2023 & 2033

Figure 84: Western Europe Market Y-o-Y Growth (%) Projections by Product Type, 2023 to 2033

Figure 85: Western Europe Market Value (US$ Million) Analysis by Vehicle Type, 2018 & 2033

Figure 86: Western Europe Market Volume (Units) Analysis by Vehicle Type, 2018 & 2033

Figure 87: Western Europe Market Value Share (%) and BPS Analysis by Vehicle Type, 2023 & 2033

Figure 88: Western Europe Market Y-o-Y Growth (%) Projections by Vehicle Type, 2023 to 2033

Figure 89: Western Europe Market Value (US$ Million) Analysis by Sales Channel, 2018 & 2033

Figure 90: Western Europe Market Volume (Units) Analysis by Sales Channel, 2018 & 2033

Figure 91: Western Europe Market Value Share (%) and BPS Analysis by Sales Channel, 2023 & 2033

Figure 92: Western Europe Market Y-o-Y Growth (%) Projections by Sales Channel, 2023 to 2033

Figure 93: Western Europe Market Attractiveness by Product Type, 2023 to 2033

Figure 94: Western Europe Market Attractiveness by Vehicle Type, 2023 to 2033

Figure 95: Western Europe Market Attractiveness by Sales Channel, 2023 to 2033

Figure 96: Western Europe Market Attractiveness by Country, 2023 to 2033

Figure 97: Eastern Europe Market Value (US$ Million) by Product Type, 2023 & 2033

Figure 98: Eastern Europe Market Value (US$ Million) by Vehicle Type, 2023 & 2033

Figure 99: Eastern Europe Market Value (US$ Million) by Sales Channel, 2023 & 2033

Figure 100: Eastern Europe Market Value (US$ Million) by Country, 2023 & 2033

Figure 101: Eastern Europe Market Value (US$ Million) Analysis by Country, 2018 & 2033

Figure 102: Eastern Europe Market Volume (Units) Analysis by Country, 2018 & 2033

Figure 103: Eastern Europe Market Value Share (%) and BPS Analysis by Country, 2023 & 2033

Figure 104: Eastern Europe Market Y-o-Y Growth (%) Projections by Country, 2023 to 2033

Figure 105: Eastern Europe Market Value (US$ Million) Analysis by Product Type, 2018 & 2033

Figure 106: Eastern Europe Market Volume (Units) Analysis by Product Type, 2018 & 2033

Figure 107: Eastern Europe Market Value Share (%) and BPS Analysis by Product Type, 2023 & 2033

Figure 108: Eastern Europe Market Y-o-Y Growth (%) Projections by Product Type, 2023 to 2033

Figure 109: Eastern Europe Market Value (US$ Million) Analysis by Vehicle Type, 2018 & 2033

Figure 110: Eastern Europe Market Volume (Units) Analysis by Vehicle Type, 2018 & 2033

Figure 111: Eastern Europe Market Value Share (%) and BPS Analysis by Vehicle Type, 2023 & 2033

Figure 112: Eastern Europe Market Y-o-Y Growth (%) Projections by Vehicle Type, 2023 to 2033

Figure 113: Eastern Europe Market Value (US$ Million) Analysis by Sales Channel, 2018 & 2033

Figure 114: Eastern Europe Market Volume (Units) Analysis by Sales Channel, 2018 & 2033

Figure 115: Eastern Europe Market Value Share (%) and BPS Analysis by Sales Channel, 2023 & 2033

Figure 116: Eastern Europe Market Y-o-Y Growth (%) Projections by Sales Channel, 2023 to 2033

Figure 117: Eastern Europe Market Attractiveness by Product Type, 2023 to 2033

Figure 118: Eastern Europe Market Attractiveness by Vehicle Type, 2023 to 2033

Figure 119: Eastern Europe Market Attractiveness by Sales Channel, 2023 to 2033

Figure 120: Eastern Europe Market Attractiveness by Country, 2023 to 2033

Figure 121: East Asia Market Value (US$ Million) by Product Type, 2023 & 2033

Figure 122: East Asia Market Value (US$ Million) by Vehicle Type, 2023 & 2033

Figure 123: East Asia Market Value (US$ Million) by Sales Channel, 2023 & 2033

Figure 124: East Asia Market Value (US$ Million) by Country, 2023 & 2033

Figure 125: East Asia Market Value (US$ Million) Analysis by Country, 2018 & 2033

Figure 126: East Asia Market Volume (Units) Analysis by Country, 2018 & 2033

Figure 127: East Asia Market Value Share (%) and BPS Analysis by Country, 2023 & 2033

Figure 128: East Asia Market Y-o-Y Growth (%) Projections by Country, 2023 to 2033

Figure 129: East Asia Market Value (US$ Million) Analysis by Product Type, 2018 & 2033

Figure 130: East Asia Market Volume (Units) Analysis by Product Type, 2018 & 2033

Figure 131: East Asia Market Value Share (%) and BPS Analysis by Product Type, 2023 & 2033

Figure 132: East Asia Market Y-o-Y Growth (%) Projections by Product Type, 2023 to 2033

Figure 133: East Asia Market Value (US$ Million) Analysis by Vehicle Type, 2018 & 2033

Figure 134: East Asia Market Volume (Units) Analysis by Vehicle Type, 2018 & 2033

Figure 135: East Asia Market Value Share (%) and BPS Analysis by Vehicle Type, 2023 & 2033

Figure 136: East Asia Market Y-o-Y Growth (%) Projections by Vehicle Type, 2023 to 2033

Figure 137: East Asia Market Value (US$ Million) Analysis by Sales Channel, 2018 & 2033

Figure 138: East Asia Market Volume (Units) Analysis by Sales Channel, 2018 & 2033

Figure 139: East Asia Market Value Share (%) and BPS Analysis by Sales Channel, 2023 & 2033

Figure 140: East Asia Market Y-o-Y Growth (%) Projections by Sales Channel, 2023 to 2033

Figure 141: East Asia Market Attractiveness by Product Type, 2023 to 2033

Figure 142: East Asia Market Attractiveness by Vehicle Type, 2023 to 2033

Figure 143: East Asia Market Attractiveness by Sales Channel, 2023 to 2033

Figure 144: East Asia Market Attractiveness by Country, 2023 to 2033

Figure 145: South Asia Market Value (US$ Million) by Product Type, 2023 & 2033

Figure 146: South Asia Market Value (US$ Million) by Vehicle Type, 2023 & 2033

Figure 147: South Asia Market Value (US$ Million) by Sales Channel, 2023 & 2033

Figure 148: South Asia Market Value (US$ Million) by Country, 2023 & 2033

Figure 149: South Asia Market Value (US$ Million) Analysis by Country, 2018 & 2033

Figure 150: South Asia Market Volume (Units) Analysis by Country, 2018 & 2033

Figure 151: South Asia Market Value Share (%) and BPS Analysis by Country, 2023 & 2033

Figure 152: South Asia Market Y-o-Y Growth (%) Projections by Country, 2023 to 2033

Figure 153: South Asia Market Value (US$ Million) Analysis by Product Type, 2018 & 2033

Figure 154: South Asia Market Volume (Units) Analysis by Product Type, 2018 & 2033

Figure 155: South Asia Market Value Share (%) and BPS Analysis by Product Type, 2023 & 2033

Figure 156: South Asia Market Y-o-Y Growth (%) Projections by Product Type, 2023 to 2033

Figure 157: South Asia Market Value (US$ Million) Analysis by Vehicle Type, 2018 & 2033

Figure 158: South Asia Market Volume (Units) Analysis by Vehicle Type, 2018 & 2033

Figure 159: South Asia Market Value Share (%) and BPS Analysis by Vehicle Type, 2023 & 2033

Figure 160: South Asia Market Y-o-Y Growth (%) Projections by Vehicle Type, 2023 to 2033

Figure 161: South Asia Market Value (US$ Million) Analysis by Sales Channel, 2018 & 2033

Figure 162: South Asia Market Volume (Units) Analysis by Sales Channel, 2018 & 2033

Figure 163: South Asia Market Value Share (%) and BPS Analysis by Sales Channel, 2023 & 2033

Figure 164: South Asia Market Y-o-Y Growth (%) Projections by Sales Channel, 2023 to 2033

Figure 165: South Asia Market Attractiveness by Product Type, 2023 to 2033

Figure 166: South Asia Market Attractiveness by Vehicle Type, 2023 to 2033

Figure 167: South Asia Market Attractiveness by Sales Channel, 2023 to 2033

Figure 168: South Asia Market Attractiveness by Country, 2023 to 2033

Figure 169: MEA Market Value (US$ Million) by Product Type, 2023 & 2033

Figure 170: MEA Market Value (US$ Million) by Vehicle Type, 2023 & 2033

Figure 171: MEA Market Value (US$ Million) by Sales Channel, 2023 & 2033

Figure 172: MEA Market Value (US$ Million) by Country, 2023 & 2033

Figure 173: MEA Market Value (US$ Million) Analysis by Country, 2018 & 2033

Figure 174: MEA Market Volume (Units) Analysis by Country, 2018 & 2033

Figure 175: MEA Market Value Share (%) and BPS Analysis by Country, 2023 & 2033

Figure 176: MEA Market Y-o-Y Growth (%) Projections by Country, 2023 to 2033

Figure 177: MEA Market Value (US$ Million) Analysis by Product Type, 2018 & 2033

Figure 178: MEA Market Volume (Units) Analysis by Product Type, 2018 & 2033

Figure 179: MEA Market Value Share (%) and BPS Analysis by Product Type, 2023 & 2033

Figure 180: MEA Market Y-o-Y Growth (%) Projections by Product Type, 2023 to 2033

Figure 181: MEA Market Value (US$ Million) Analysis by Vehicle Type, 2018 & 2033

Figure 182: MEA Market Volume (Units) Analysis by Vehicle Type, 2018 & 2033

Figure 183: MEA Market Value Share (%) and BPS Analysis by Vehicle Type, 2023 & 2033

Figure 184: MEA Market Y-o-Y Growth (%) Projections by Vehicle Type, 2023 to 2033

Figure 185: MEA Market Value (US$ Million) Analysis by Sales Channel, 2018 & 2033

Figure 186: MEA Market Volume (Units) Analysis by Sales Channel, 2018 & 2033

Figure 187: MEA Market Value Share (%) and BPS Analysis by Sales Channel, 2023 & 2033

Figure 188: MEA Market Y-o-Y Growth (%) Projections by Sales Channel, 2023 to 2033

Figure 189: MEA Market Attractiveness by Product Type, 2023 to 2033

Figure 190: MEA Market Attractiveness by Vehicle Type, 2023 to 2033

Figure 191: MEA Market Attractiveness by Sales Channel, 2023 to 2033

Figure 192: MEA Market Attractiveness by Country, 2023 to 2033

Frequently Asked Questions

What is the expected market value in 2023?

The market will reach USD 352.9 million in 2023.

What is the growth rate of the market through 2033?

The market will rise at a 4.5% CAGR until 2033.

What is China’s growth rate through 2033?

China will expand at a 4.7% CAGR through 2033.

Which product type is highly lucrative?

Exhaust systems will be the most lucrative accessory.

Who are some prominent manufacturers?

Tenneco Inc., Brembo, and Continental AG are some key players.

Explore Similar Insights

Future Market Insights

Automotive Performance Accessories Market