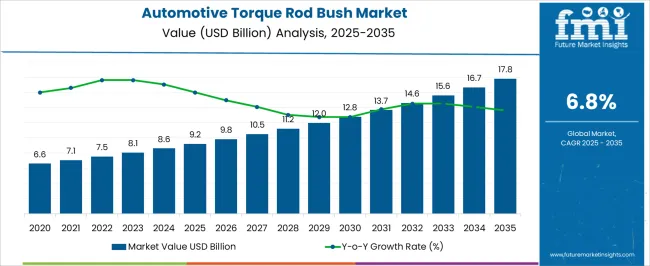
The Automotive Torque Rod Bush Market is estimated to be valued at USD 9.2 billion in 2025 and is projected to reach USD 17.8 billion by 2035, registering a compound annual growth rate (CAGR) of 6.8% over the forecast period.
| Metric | Value |
|---|---|
| Automotive Torque Rod Bush Market Estimated Value in (2025 E) | USD 9.2 billion |
| Automotive Torque Rod Bush Market Forecast Value in (2035 F) | USD 17.8 billion |
| Forecast CAGR (2025 to 2035) | 6.8% |
The Automotive Torque Rod Bush market is witnessing steady growth, driven by increasing demand for vehicle suspension components that enhance ride quality, stability, and handling performance. Rising production of passenger and commercial vehicles, coupled with stricter safety and emission standards, is accelerating the adoption of high-performance torque rod bushes. Advancements in materials engineering and manufacturing processes have improved durability, vibration absorption, and noise reduction characteristics of torque rod bushes, making them critical for modern automotive suspension systems.
The growing preference for passenger cars equipped with advanced suspension solutions is supporting market expansion, while urbanization and rising disposable incomes are increasing vehicle ownership in emerging regions. Ongoing research in elastomeric and polymer-based bushing materials is enhancing product performance, enabling longer service life and reduced maintenance costs.
Integration with lightweight suspension systems and compatibility with diverse vehicle architectures are further strengthening market appeal As automakers prioritize comfort, safety, and efficiency, the Automotive Torque Rod Bush market is expected to sustain growth, driven by technological innovation and increasing vehicle production worldwide.
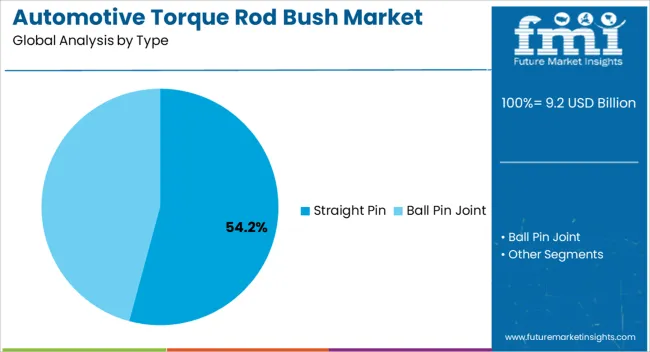
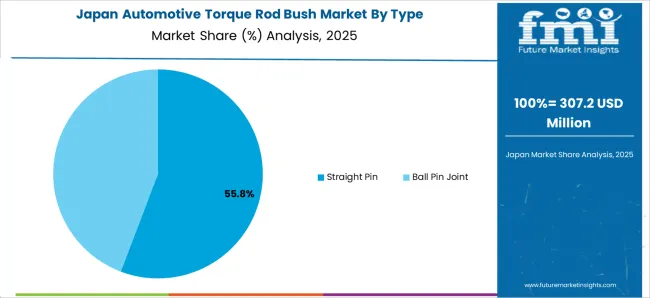
The straight pin type segment is projected to hold 54.2% of the market revenue in 2025, establishing it as the leading product type. Its dominance is driven by its simple design, ease of installation, and ability to provide reliable performance in various vehicle suspension systems. The straight pin torque rod bush is preferred for its high load-bearing capacity, vibration damping, and durability, which contribute to improved ride comfort and stability.
Advanced elastomeric materials used in straight pin bushes reduce wear and extend service life, lowering maintenance requirements. Adoption is further reinforced by compatibility with a wide range of passenger cars and commercial vehicles, supporting broad-scale deployment.
Manufacturers are increasingly focusing on optimizing the design and material composition to meet evolving safety, noise, vibration, and harshness standards With growing production of passenger cars and emphasis on vehicle comfort and handling, the straight pin type is expected to maintain its market leadership, supported by proven reliability and cost-effective performance in suspension systems.
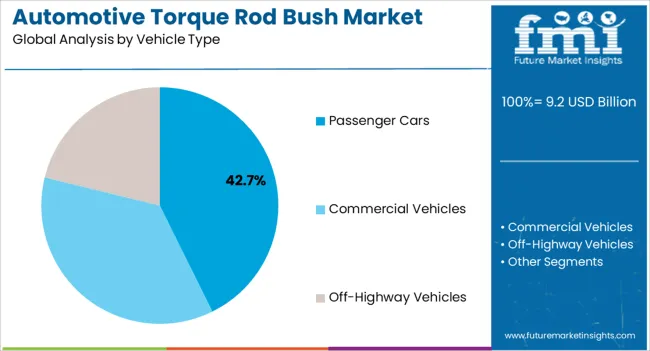
The passenger cars segment is anticipated to account for 42.7% of the market revenue in 2025, making it the leading vehicle type. Growth in this segment is being driven by increasing global demand for personal vehicles, urbanization, and rising disposable incomes in emerging economies. Passenger cars equipped with advanced suspension systems increasingly rely on torque rod bushes to enhance ride comfort, handling stability, and safety.
The adoption of lightweight materials and elastomeric components in suspension design reduces noise, vibration, and harshness, improving overall vehicle performance. OEMs are prioritizing durability, low maintenance, and compatibility with modern suspension architectures, which supports adoption of high-performance bushes.
Continuous improvements in materials, design optimization, and testing protocols ensure consistent performance under varying operating conditions As passenger car production continues to rise and consumers demand enhanced driving comfort, the segment is expected to remain the largest revenue contributor in the Automotive Torque Rod Bush market, reinforced by technological advancements and evolving vehicle safety standards.
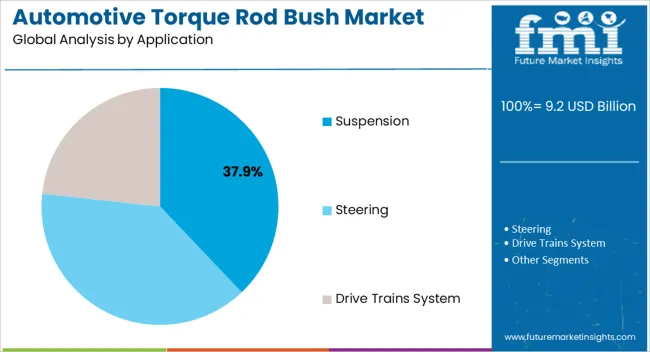
The suspension application segment is projected to hold 37.9% of the market revenue in 2025, establishing it as the leading application area. Growth is being driven by the increasing need to enhance vehicle stability, ride comfort, and safety across passenger cars and light commercial vehicles. Torque rod bushes in suspension systems reduce vibrations, absorb shocks, and provide precise alignment of control arms, contributing to improved handling performance.
The segment benefits from ongoing innovations in elastomeric materials and polymer composites, which extend durability and reduce maintenance costs. Integration of torque rod bushes with modern multi-link and independent suspension systems is further accelerating adoption.
Manufacturers are increasingly focusing on optimizing bush geometry and material properties to meet stringent noise, vibration, and harshness regulations, as well as evolving safety and comfort standards Rising vehicle production, coupled with consumer preference for smooth and stable rides, is expected to reinforce the suspension application segment’s leadership in the market, supported by continuous advancements in performance-oriented suspension solutions.
From 2020.2 to 2025, the global Automotive Torque Rod Bush market experienced a CAGR of 7.2%, reaching a market size of USD 9.2 billion in 2025. From 2020.2 to 2025, the global Automotive Torque Rod Bush industry witnessed steady growth due to the rising demand for Commercial Vehicles. Across globally growing e-commerce and logistics industries, as well as the increasing need for last-mile delivery services. This increased demand for commercial vehicles is driving the demand for Automotive Torque Rod Bushes. Additionally, the implementation of stringent environmental regulations by governments across the globe further propelled market growth during this period.
Looking ahead, the global Automotive Torque Rod Bush industry is expected to rise at a CAGR of 7.2% from 2025 to 2035. During the forecast period, the market size is expected to reach USD 17 billion.
The market is being driven by a number of factors, including the increasing demand for electric and hybrid vehicles, the growing demand for lightweight components, and focusing on safety and performance in the automotive industry.
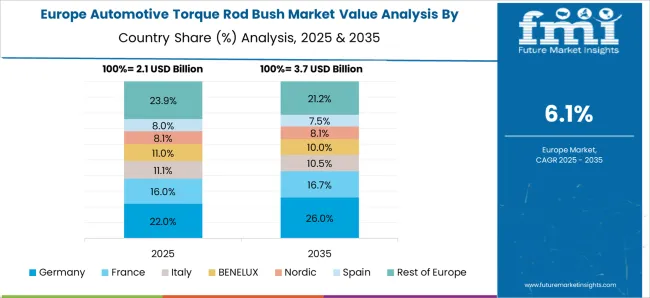
The market is also likely to witness significant growth in the Europe region due to the presence of significantly increasing adoption of advanced driver assistance systems and the growing demand for high-performance components to improve vehicle performance and safety. This creates a positive outlook for the market in the future period.
| Country | The United States |
|---|---|
| Market Size (USD billion) by End of Forecast Period (17.8033) | USD 17.8 billion |
| CAGR % 17.8017.83 to End of Forecast (17.8033) | 6.6% |
The Automotive Torque Rod Bush industry in the United States is expected to reach a market share of USD 17.8 billion by 17.8033, expanding at a CAGR of 6.6%. The Automotive Torque Rod Bush industry in the United States is expected to witness growth due to the increasing adoption of electric and hybrid vehicles. Additionally, there are a few other factors expected to drive the demand for torque rod bushes in the country are:
| Country | Germany |
|---|---|
| Market Size (USD billion) by End of Forecast Period (17.8033) | USD 1.17.8 billion |
| CAGR % 17.8017.83 to End of Forecast (17.8033) | 7.0% |
The Automotive Torque Rod Bush industry in Germany is expected to reach a market share of USD 1.17.8 billion, expanding at a CAGR of 7.0% during the forecast period. The Germany market is projected to experience growth owing to the rising demand for torque rod bushes in the automotive Industry. A large number of major automakers and suppliers, like BMW, Mercedes-Benz, and Volkswagen, are the largest automakers in the world. These companies require a wide range of components, including torque rod bushes to manufacture their vehicles and meet the demand of their customers.
| Country | China |
|---|---|
| Market Size (USD billion) by End of Forecast Period (17.8033) | USD 1.05 billion |
| CAGR % 17.8017.83 to End of Forecast (17.8033) | 7.6% |
The Automotive Torque Rod Bush in China is anticipated to reach a market share of USD 1.05 billion, moving at a CAGR of 7.6% during the forecast period. The Automotive Torque Rod Bush industry in China is predicted to grow because the increasing demand for fuel-efficient and environmentally friendly vehicles is leading to the adoption of new technologies and components that improve the efficiency and performance of vehicles. Secondly, advances and new vehicle design and manufacturing are leading to the development of new and improved torque rod bushes that are more comfortable, and able to withstand the demands of modern vehicle applications
| Country | Japan |
|---|---|
| Market Size (USD billion) by End of Forecast Period (17.8033) | USD 1.75 billion |
| CAGR % 17.8017.83 to End of Forecast (17.8033) | 6.8% |
The Automotive Torque Rod Bush industry in Japan is estimated to reach a market share of USD 1.75 billion by 17.8033, thriving at a CAGR of 6.8%. The market in Japan is expected to grow prominently due to the increasing demand for increasing adoption of electric and hybrid vehicles led to a growing demand for high-performance components that can withstand the higher loads and stresses associated with these vehicles. In addition, these Lightweight components are highly used in vehicles to improve fuel efficiency and reduce emissions, and torque rod buses.
The passenger cars segment is expected to dominate the Automotive Torque Rod Bush industry with a CAGR of 7.1% from 2025 to 2035. This segment captures a significant market share in 2025 due to its cost-effectiveness, high efficiency, and low maintenance requirements.
Due to the rising demand for fuel-efficient and low-emission vehicles, the passenger car segment will likely dominate the automotive torque rod bush business. The demand for electric cars is predicted to increase, which will fuel the expansion of the automotive torque rod bush market. EVs need high-quality torque rod bushes to ensure the drivetrain operates smoothly and effectively.
Commercial vehicles are expected to dominate the Automotive Torque Rod Bush industry with a CAGR of 7.0% from 2025 to 2035. This segment captures a significant market share in 2025 due to the significant contributor to the global economy, and its growth is driving various industries, including the automotive sector.
The growing e-commerce and logistics industries, as well as the increasing need for last-mile delivery services, have driven up global demand for commercial vehicles such as trucks, buses, and vans. This rising need for commercial vehicles has fueled the demand for Automotive Torque Rod Bushes, which are an integral component of these vehicles' gearbox systems.
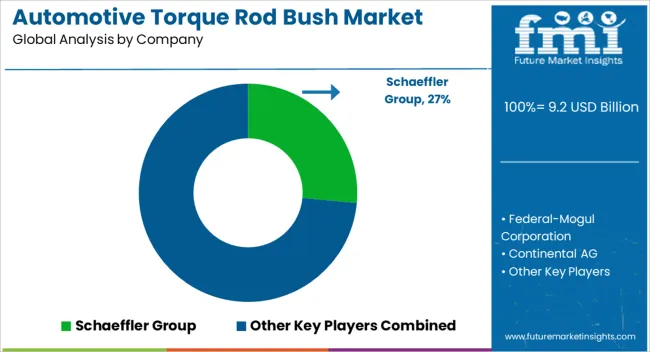
The Automotive Torque Rod Bush industry is highly competitive, with numerous players vying for market share. In such a scenario, key players must adopt effective strategies to stay ahead of the competition.
Key Strategies Adopted by the Players
Companies invest hugely in research and development to introduce innovative products that offer enhanced efficiency, reliability, and cost-effectiveness. Product innovation enables companies to differentiate themselves from their competitors and cater to the evolving needs of customers.
Key players in the industry often form strategic partnerships and collaborations with other companies to leverage their strengths and expand their reach in the market. Such collaborations also allow companies to gain access to new technologies and markets.
The Automotive Torque Rod Bush industry is witnessing significant growth in emerging markets such as China and India. Key players are expanding their presence in these markets by establishing local manufacturing facilities and strengthening their distribution networks.
Key players in the Automotive Torque Rod Bush industry often engage in mergers and acquisitions to consolidate their market position, expand their product portfolio, and gain access to new markets.
Key Players in the Automotive Torque Rod Bush Industry
Key Developments in the Automotive Torque Rod Bush Market:
The global automotive torque rod bush market is estimated to be valued at USD 9.2 billion in 2025.
The market size for the automotive torque rod bush market is projected to reach USD 17.8 billion by 2035.
The automotive torque rod bush market is expected to grow at a 6.8% CAGR between 2025 and 2035.
The key product types in automotive torque rod bush market are straight pin and ball pin joint.
In terms of vehicle type, passenger cars segment to command 42.7% share in the automotive torque rod bush market in 2025.


Full Research Suite comprises of:
Market outlook & trends analysis
Interviews & case studies
Strategic recommendations
Vendor profiles & capabilities analysis
5-year forecasts
8 regions and 60+ country-level data splits
Market segment data splits
12 months of continuous data updates
DELIVERED AS:
PDF EXCEL ONLINE
Automotive Performance Part Market Size and Share Forecast Outlook 2025 to 2035
Automotive Carbon Ceramic Brake Market Size and Share Forecast Outlook 2025 to 2035
Automotive Camshaft Market Size and Share Forecast Outlook 2025 to 2035
Automotive Stamping Industry Analysis in India Size and Share Forecast Outlook 2025 to 2035
Automotive Cylinder Liner Market Size and Share Forecast Outlook 2025 to 2035
Automotive Microcontroller Market Size and Share Forecast Outlook 2025 to 2035
Automotive Roof Rails Market Size and Share Forecast Outlook 2025 to 2035
Automotive Active Safety System Market Size and Share Forecast Outlook 2025 to 2035
Automotive Diagnostic Scan Tool Market Size and Share Forecast Outlook 2025 to 2035
Automotive Test Equipment Market Size and Share Forecast Outlook 2025 to 2035
Automotive Dynamic Map Data Market Size and Share Forecast Outlook 2025 to 2035
Automotive Green Tires Market Size and Share Forecast Outlook 2025 to 2035
Automotive E-Tailing Market Size and Share Forecast Outlook 2025 to 2035
Automotive Interior Market Forecast Outlook 2025 to 2035
Automotive Key Market Size and Share Forecast Outlook 2025 to 2035
Automotive Appearance Chemical Market Forecast and Outlook 2025 to 2035
Automotive Seating Market Forecast and Outlook 2025 to 2035
Automotive Domain Control Module Market Forecast and Outlook 2025 to 2035
Automotive Remote Diagnostic Market Forecast and Outlook 2025 to 2035
Automotive-grade Inertial Navigation System Market Size and Share Forecast Outlook 2025 to 2035

Thank you!
You will receive an email from our Business Development Manager. Please be sure to check your SPAM/JUNK folder too.
Chat With
MaRIA