Automotive Interior Market Size and Share Forecast Outlook From 2024 to 2034

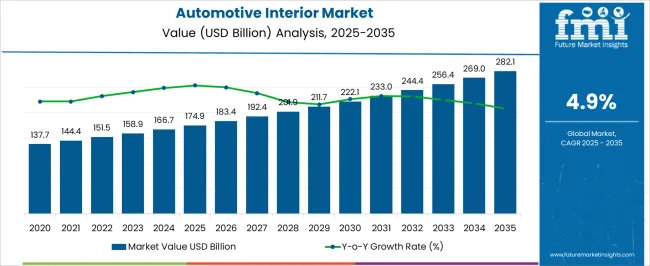
The automotive interior market is estimated to be valued at USD 166.7 billion in 2024. The automotive interior is predicted to rise at a CAGR of 4.9% from 2024 to 2034. The global automotive interior market is anticipated to reach USD 270 billion by 2034.

The automotive interior market is witnessing significant growth due to the increasing demand for connected features within vehicles. Features like in-car Wi-Fi, seamless smartphone integration, and advanced navigation systems are becoming increasingly popular among consumers, contributing to the overall expansion of the market.

The automotive interior market is experiencing growth driven by the heightened awareness and increased significance placed on safety features within vehicles. The growing acknowledgment of the importance of safety features is a key factor propelling advancements and innovations in automotive interiors.

Attributes Key Insights
Estimated Market Size in 2024 USD 166.7 billion
Projected Market Value in 2034 USD 270 billion
Value-based CAGR from 2024 to 2034 4.9%

Sales Trend Analysis from 2019 to 2023 Compared to Market Outlook for 2024 to 2034

From 2019 to 2023, the automotive interior market experienced a CAGR of 6.6% in market value. Rising demand for advanced infotainment systems, touchscreens, voice recognition, augmented reality displays, and connectivity options. The trend towards electric and autonomous vehicles is also driving the need for innovative automotive interior technologies.

Manufacturers are constantly exploring new materials for interiors to improve durability, reduce weight, and enhance aesthetics. This includes advancements in materials such as leather alternatives, sustainable materials, and smart fabrics.

Consumers increasingly demand personalized and customizable interiors. This has led to manufacturers offering a range of interior customization options, allowing buyers to choose from different materials, colors, and design elements.

Changing consumer preferences and lifestyle trends also impact the automotive interior market. For example, the increasing demand for SUVs and crossovers has influenced the design of interiors to provide a more spacious and versatile environment. Projections indicate that the global automotive interior market is expected to experience a CAGR of 4.9% from 2024 to 2034.

Historical CAGR from 2019 to 2023 6.6%
Forecast CAGR from 2024 to 2034 4.9%

Key Growth Drivers for the Automotive Interior Market

  • The growing demand for personalized and customizable interior options.
  • The integration of advanced technologies within automotive interiors is a significant driver.
  • Consumer preferences for comfortable and aesthetically pleasing interiors drive innovation in automotive design.
  • The rise of electric vehicles (EVs) and autonomous vehicles is influencing interior design.
  • The demand for connected features within vehicles, such as in-car Wi-Fi, smartphone integration, and advanced navigation systems, contributes to the growth of the automotive interior market.
  • The growth of the luxury and premium vehicle segments is driving demand for high-quality interiors with premium materials and advanced features.
  • Increasing awareness and importance placed on safety features within vehicles contribute to the growth of the automotive interior market.

Factors Restraining the Demand for Automotive Interior Solutions

  • Fluctuations in the prices of raw materials, such as metals, plastics, and leather, can impact manufacturing costs.
  • With the increasing integration of digital technologies and connectivity in vehicles, there is a growing concern about cybersecurity.
  • Shifting consumer preferences, such as a growing interest in shared mobility and a preference for digital experiences, can impact the design and features of automotive interiors.
  • The development of autonomous vehicles presents challenges in designing interiors that accommodate new functionalities while ensuring user comfort and safety.
  • Meeting and exceeding rapidly evolving consumer expectations for innovative and personalized interiors can be challenging, particularly with changing design trends.

Analysis of Top Countries Producing and Using Automotive Interiors

The following table shows the top five countries by revenue, led by Japan and South Korea. In South Korea, a robust focus on technological advancements is evident, with market growth driven by advanced infotainment systems, connectivity features, and intelligent interiors.

In Japan, the incorporation of cutting-edge technology, such as advanced infotainment systems and safety features, is a key driver propelling growth in the automotive interior market.
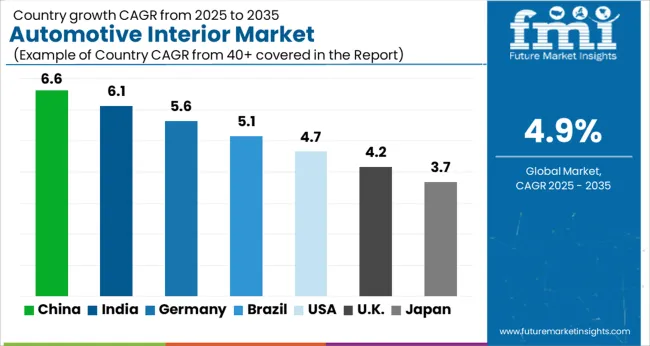
Countries Forecast CAGRs from 2024 to 2034
United States 5.3%
United Kingdom 6.0%
China 5.7%
Japan 6.6%
South Korea 7.0%

Increasing Demand for Sophisticated Interior Solutions is Propelling Market Growth in the United States.

The automotive interior market in the United States is expected to grow with a CAGR of 5.3% from 2024 to 2034. Consumers in the country often place a high value on comfort, convenience, and the latest technology when it comes to vehicle interiors. Features such as advanced infotainment systems, connectivity options, and premium materials are in demand in the United States.

The demand for luxury and premium vehicles with high-quality interiors has been strong in the United States market. Consumers in this segment often seek sophisticated designs, premium materials, and advanced features.

Advancements in material science, including the use of lightweight materials, durable fabrics, and eco-friendly options, contribute to the growth of the automotive interior market.

Increasing Demand for Luxury Vehicles to Boost the Market in the United Kingdom

The automotive interior market in the United Kingdom is expected to grow with a CAGR of 6.0% from 2024 to 2034. The demand for luxury vehicles with premium interiors is notable in the United Kingdom. Consumers seeking upscale and sophisticated driving experiences contribute to the demand for high-end automotive interiors.

The increasing awareness of environmental issues in the United Kingdom has led to a growing demand for eco-friendly and sustainable interior designs. Automakers incorporating environmentally conscious materials and manufacturing processes may find favor among consumers.

The Rapid Growth of Automotive Industry Propels Market Growth in China

The market in China is expected to expand with a 5.7% CAGR through 2034. China holds a prominent position in the global automotive industry, both as a major manufacturer and consumer. The nation commands a significant share of the worldwide market, driven by the expansion of its middle class and its increasing demand for automobiles featuring opulent and aesthetically pleasing interiors.

This growing desire for luxurious and visually appealing automotive interiors serves as a key catalyst propelling the overall market growth in China. Consumers often seek premium materials, advanced technologies, and sophisticated designs.

The demand for vehicles with cutting-edge infotainment systems, connectivity features, and driver-assistance technologies is on the rise, influencing the design of automotive interiors.

Government support for electric vehicles (EVs) and new energy vehicles (NEVs) has led to the growth of this market segment. The unique interior features of EVs, such as spacious cabins due to the absence of a traditional engine, contribute to market demand.

Rising Demand for Customized Interior in Japan to Boost Market Sales

The automotive interior market in Japan is anticipated to develop with a 6.6% CAGR from 2024 to 2034. Japan is known for its technological innovation, and this is reflected in the automotive sector. Advanced technology integration, including infotainment systems and safety features, influences the demand for automotive interiors.

Compact cars are popular in Japan due to urbanization and limited parking space. Efficient use of interior space and features that cater to urban mobility needs are crucial in the design of interiors.

The Japanese automotive market is experiencing a surge in the demand for personalized vehicle interiors, propelling market growth. This trend is driven by a growing consumer preference for customized features, reflecting a desire for unique and tailored driving experiences.

The adoption of lightweight materials for automotive interiors is gaining momentum, particularly in response to heightened interest in fuel efficiency. This shift is evident in the increasing sales of lightweight vehicles, aligning with both manufacturers and consumers aiming to maximize fuel efficiency and environmental sustainability.

Growing Technological Innovation to Drive Market Growth in South Korea

The automotive interior market in South Korea is expected to grow with a CAGR of 7.0% from 2024 to 2034. South Korean consumers often prioritize modern and technologically advanced interiors. Features such as advanced infotainment systems, connectivity options, and high-quality materials are likely to be in demand.

South Korea is known for its technological innovation, and this is reflected in the automotive sector. The demand for cutting-edge technology, including smart connectivity and safety features, influences interior design.

South Korean consumers may place a strong emphasis on safety features within vehicles. Interior designs that prioritize occupant safety, including airbags and advanced driver assistance systems (ADAS), align with consumer expectations.

Automotive Interior Industry Analysis by Top Investment Segments

The below section shows the leading segment. The cockpit module segment is anticipated to register a CAGR of 4.7% from 2024 to 2034. Based on application, the passenger car segment is anticipated to hold a dominant share through 2034. It is set to exhibit a CAGR of 4.5% from 2024 to 2034.

Category CAGR
Cockpit Module 4.7%
Passenger car 4.5%

Passenger Car Segment to Generate High Revenue in the Market

Based on vehicle type, the passenger car segment is anticipated to thrive at a CAGR of 4.5% from 2024 to 2034. Passenger car buyers place a high emphasis on the overall driving experience and comfort. A well-designed and comfortable interior contributes significantly to the satisfaction of the occupants during their journeys.

Passengers in personal vehicles often expect the integration of advanced technologies for entertainment, navigation, connectivity, and safety. Features like touchscreen infotainment systems, voice recognition, and advanced driver assistance systems (ADAS) contribute to the appeal of the interior.

Cockpit Module Segment to Remain Prominent in the Market

Based on components, the cockpit module segment is anticipated to thrive at a CAGR of 4.7% from 2024 to 2034. Many essential safety features, such as airbags, collision warning systems, lane departure warning, and adaptive cruise control, are integrated into the cockpit module. This prioritization of safety features contributes to the demand for automotive interiors.

The demand for seamless connectivity and intuitive user interfaces has driven the need for well-designed cockpit modules. Integration with smartphones, voice recognition, and easy-to-use controls contribute to the appeal of the interior.

Automakers use cockpit design as a way to differentiate their brands and models. A unique and well-designed cockpit can become a signature element, helping a brand stand out in a competitive market.
Leading Suppliers in the Automotive Interior Sector

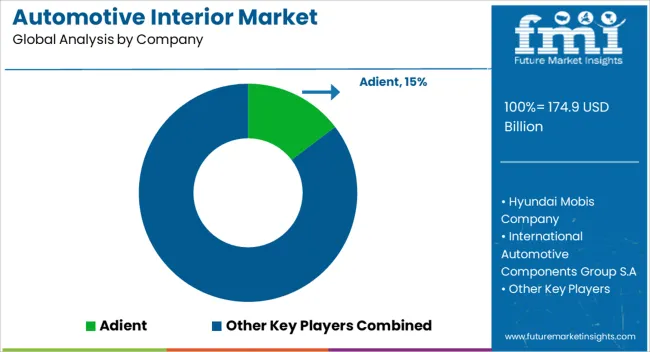
Key players in the automotive interior market are actively engaging in research and development initiatives to deliver advanced, premium, and comfortable interior systems. Many of these leading companies are forming strategic collaborations with local partners in developing countries, aiming to expand their distribution networks.

The industry is witnessing a notable trend towards increased emphasis on product differentiation, and the expansion of regional players is anticipated to pose a significant challenge for global market leaders in the foreseeable future.

  • In January 2023, Visteon and Qualcomm Technologies, Inc. revealed plans to elevate their technological collaboration. The companies aim to advance their partnership by developing a high-performance cockpit domain controller. This controller is specifically crafted to empower global automakers in constructing next-generation cockpits, showcasing a commitment to innovative automotive technology solutions.

Scope and Coverage of the Automotive Interior Market Report

Attributes Details
Estimated Market Size in 2024 USD 166.7 billion
Projected Market Valuation in 2034 USD 270 billion
Value-based CAGR 2024 to 2034 4.9%
Forecast Period 2024 to 2034
Historical Data Available for 2019 to 2023
Market Analysis Value in USD billion
Key Regions Covered North America; Latin America; Western Europe; Eastern Europe; South Asia and Pacific; East Asia; The Middle East and Africa
Key Market Segments Covered Component, Vehicle Type, Region
Key Countries Profiled The United States, Canada, Brazil, Mexico, Germany, The United Kingdom, France, Spain, Italy, Russia, Poland, Czech Republic, Romania, India, Bangladesh, Australia, New Zealand, China, Japan, South Korea, GCC countries, South Africa, Israel
Key Companies Profiled Hyundai Mobis Company; International Automotive Components Group S.A; Adient;Lear Corporation; Grupo Antolin; Visteon Corporation; Faurecia S.A; Calsonic Kansei Corporation; Robert Bosch; Yanfeng Automotive Interiors

Top Segments Studied in the Automotive Interior Market

By Component:

  • Cockpit Module
  • Flooring
  • Door Panel
  • Automotive Seat
  • Interior Lighting
  • Other

By Vehicle Type:

  • Passenger Car
  • Commercial Vehicle

By Region:

  • North America
  • Latin America
  • Western Europe
  • Eastern Europe
  • South Asia and Pacific
  • East Asia
  • Middle East and Africa

Table of Content

  • 1. Executive Summary
  • 2. Market Overview
  • 3. Market Background
  • 4. Global Market Analysis 2019 to 2023 and Forecast, 2024 to 2034
  • 5. Global Market Analysis 2019 to 2023 and Forecast 2024 to 2034, By Component
    • 5.1. COCKPIT MODULE
    • 5.2. FLOORING
    • 5.3. DOOR PANEL
    • 5.4. AUTOMOTIVE SEAT
    • 5.5. INTERIOR LIGHTING
    • 5.6. Others
  • 6. Global Market Analysis 2019 to 2023 and Forecast 2024 to 2034, By Vehicle Type
    • 6.1. PASSENGER CAR
    • 6.2. COMMERCIAL VEHICLE
  • 7. Global Market Analysis 2019 to 2023 and Forecast 2024 to 2034, By Region
    • 7.1. North America
    • 7.2. Latin America
    • 7.3. Europe
    • 7.4. East Asia
    • 7.5. South Asia
    • 7.6. Oceania
    • 7.7. MEA
  • 8. North America Market Analysis 2019 to 2023 and Forecast 2024 to 2034, By Country
  • 9. Latin America Market Analysis 2019 to 2023 and Forecast 2024 to 2034, By Country
  • 10. Europe Market Analysis 2019 to 2023 and Forecast 2024 to 2034, By Country
  • 11. East Asia Market Analysis 2019 to 2023 and Forecast 2024 to 2034, By Country
  • 12. South Asia Market Analysis 2019 to 2023 and Forecast 2024 to 2034, By Country
  • 13. Oceania Market Analysis 2019 to 2023 and Forecast 2024 to 2034, By Country
  • 14. MEA Market Analysis 2019 to 2023 and Forecast 2024 to 2034, By Country
  • 15. Key Countries Market Analysis
  • 16. Market Structure Analysis
  • 17. Competition Analysis
    • 17.1. HYUNDAI MOBIS COMPANY
    • 17.2. INTERNATIONAL AUTOMOTIVE COMPONENTS GROUP S.A
    • 17.3. ADIENT
    • 17.4. LEAR CORPORATION
    • 17.5. GRUPO ANTOLIN
    • 17.6. VISTEON CORPORATION
    • 17.7. FAURECIA S.A
    • 17.8. CALSONIC KANSEI CORPORATION
    • 17.9. ROBERT BOSCH
    • 17.10. YANFENG AUTOMOTIVE INTERIORS
  • 18. Assumptions & Acronyms Used
  • 19. Research Methodology

List of Tables

Table 1: Global Market Value (US$ Million) Forecast by Region, 2019 to 2034

Table 2: Global Market Volume (Units) Forecast by Region, 2019 to 2034

Table 3: Global Market Value (US$ Million) Forecast by Component, 2019 to 2034

Table 4: Global Market Volume (Units) Forecast by Component, 2019 to 2034

Table 5: Global Market Value (US$ Million) Forecast by Vehicle Type, 2019 to 2034

Table 6: Global Market Volume (Units) Forecast by Vehicle Type, 2019 to 2034

Table 7: North America Market Value (US$ Million) Forecast by Country, 2019 to 2034

Table 8: North America Market Volume (Units) Forecast by Country, 2019 to 2034

Table 9: North America Market Value (US$ Million) Forecast by Component, 2019 to 2034

Table 10: North America Market Volume (Units) Forecast by Component, 2019 to 2034

Table 11: North America Market Value (US$ Million) Forecast by Vehicle Type, 2019 to 2034

Table 12: North America Market Volume (Units) Forecast by Vehicle Type, 2019 to 2034

Table 13: Latin America Market Value (US$ Million) Forecast by Country, 2019 to 2034

Table 14: Latin America Market Volume (Units) Forecast by Country, 2019 to 2034

Table 15: Latin America Market Value (US$ Million) Forecast by Component, 2019 to 2034

Table 16: Latin America Market Volume (Units) Forecast by Component, 2019 to 2034

Table 17: Latin America Market Value (US$ Million) Forecast by Vehicle Type, 2019 to 2034

Table 18: Latin America Market Volume (Units) Forecast by Vehicle Type, 2019 to 2034

Table 19: Europe Market Value (US$ Million) Forecast by Country, 2019 to 2034

Table 20: Europe Market Volume (Units) Forecast by Country, 2019 to 2034

Table 21: Europe Market Value (US$ Million) Forecast by Component, 2019 to 2034

Table 22: Europe Market Volume (Units) Forecast by Component, 2019 to 2034

Table 23: Europe Market Value (US$ Million) Forecast by Vehicle Type, 2019 to 2034

Table 24: Europe Market Volume (Units) Forecast by Vehicle Type, 2019 to 2034

Table 25: East Asia Market Value (US$ Million) Forecast by Country, 2019 to 2034

Table 26: East Asia Market Volume (Units) Forecast by Country, 2019 to 2034

Table 27: East Asia Market Value (US$ Million) Forecast by Component, 2019 to 2034

Table 28: East Asia Market Volume (Units) Forecast by Component, 2019 to 2034

Table 29: East Asia Market Value (US$ Million) Forecast by Vehicle Type, 2019 to 2034

Table 30: East Asia Market Volume (Units) Forecast by Vehicle Type, 2019 to 2034

Table 31: South Asia Market Value (US$ Million) Forecast by Country, 2019 to 2034

Table 32: South Asia Market Volume (Units) Forecast by Country, 2019 to 2034

Table 33: South Asia Market Value (US$ Million) Forecast by Component, 2019 to 2034

Table 34: South Asia Market Volume (Units) Forecast by Component, 2019 to 2034

Table 35: South Asia Market Value (US$ Million) Forecast by Vehicle Type, 2019 to 2034

Table 36: South Asia Market Volume (Units) Forecast by Vehicle Type, 2019 to 2034

Table 37: Oceania Market Value (US$ Million) Forecast by Country, 2019 to 2034

Table 38: Oceania Market Volume (Units) Forecast by Country, 2019 to 2034

Table 39: Oceania Market Value (US$ Million) Forecast by Component, 2019 to 2034

Table 40: Oceania Market Volume (Units) Forecast by Component, 2019 to 2034

Table 41: Oceania Market Value (US$ Million) Forecast by Vehicle Type, 2019 to 2034

Table 42: Oceania Market Volume (Units) Forecast by Vehicle Type, 2019 to 2034

Table 43: MEA Market Value (US$ Million) Forecast by Country, 2019 to 2034

Table 44: MEA Market Volume (Units) Forecast by Country, 2019 to 2034

Table 45: MEA Market Value (US$ Million) Forecast by Component, 2019 to 2034

Table 46: MEA Market Volume (Units) Forecast by Component, 2019 to 2034

Table 47: MEA Market Value (US$ Million) Forecast by Vehicle Type, 2019 to 2034

Table 48: MEA Market Volume (Units) Forecast by Vehicle Type, 2019 to 2034

List of Figures

Figure 1: Global Market Value (US$ Million) by Component, 2024 to 2034

Figure 2: Global Market Value (US$ Million) by Vehicle Type, 2024 to 2034

Figure 3: Global Market Value (US$ Million) by Region, 2024 to 2034

Figure 4: Global Market Value (US$ Million) Analysis by Region, 2019 to 2034

Figure 5: Global Market Volume (Units) Analysis by Region, 2019 to 2034

Figure 6: Global Market Value Share (%) and BPS Analysis by Region, 2024 to 2034

Figure 7: Global Market Y-o-Y Growth (%) Projections by Region, 2024 to 2034

Figure 8: Global Market Value (US$ Million) Analysis by Component, 2019 to 2034

Figure 9: Global Market Volume (Units) Analysis by Component, 2019 to 2034

Figure 10: Global Market Value Share (%) and BPS Analysis by Component, 2024 to 2034

Figure 11: Global Market Y-o-Y Growth (%) Projections by Component, 2024 to 2034

Figure 12: Global Market Value (US$ Million) Analysis by Vehicle Type, 2019 to 2034

Figure 13: Global Market Volume (Units) Analysis by Vehicle Type, 2019 to 2034

Figure 14: Global Market Value Share (%) and BPS Analysis by Vehicle Type, 2024 to 2034

Figure 15: Global Market Y-o-Y Growth (%) Projections by Vehicle Type, 2024 to 2034

Figure 16: Global Market Attractiveness by Component, 2024 to 2034

Figure 17: Global Market Attractiveness by Vehicle Type, 2024 to 2034

Figure 18: Global Market Attractiveness by Region, 2024 to 2034

Figure 19: North America Market Value (US$ Million) by Component, 2024 to 2034

Figure 20: North America Market Value (US$ Million) by Vehicle Type, 2024 to 2034

Figure 21: North America Market Value (US$ Million) by Country, 2024 to 2034

Figure 22: North America Market Value (US$ Million) Analysis by Country, 2019 to 2034

Figure 23: North America Market Volume (Units) Analysis by Country, 2019 to 2034

Figure 24: North America Market Value Share (%) and BPS Analysis by Country, 2024 to 2034

Figure 25: North America Market Y-o-Y Growth (%) Projections by Country, 2024 to 2034

Figure 26: North America Market Value (US$ Million) Analysis by Component, 2019 to 2034

Figure 27: North America Market Volume (Units) Analysis by Component, 2019 to 2034

Figure 28: North America Market Value Share (%) and BPS Analysis by Component, 2024 to 2034

Figure 29: North America Market Y-o-Y Growth (%) Projections by Component, 2024 to 2034

Figure 30: North America Market Value (US$ Million) Analysis by Vehicle Type, 2019 to 2034

Figure 31: North America Market Volume (Units) Analysis by Vehicle Type, 2019 to 2034

Figure 32: North America Market Value Share (%) and BPS Analysis by Vehicle Type, 2024 to 2034

Figure 33: North America Market Y-o-Y Growth (%) Projections by Vehicle Type, 2024 to 2034

Figure 34: North America Market Attractiveness by Component, 2024 to 2034

Figure 35: North America Market Attractiveness by Vehicle Type, 2024 to 2034

Figure 36: North America Market Attractiveness by Country, 2024 to 2034

Figure 37: Latin America Market Value (US$ Million) by Component, 2024 to 2034

Figure 38: Latin America Market Value (US$ Million) by Vehicle Type, 2024 to 2034

Figure 39: Latin America Market Value (US$ Million) by Country, 2024 to 2034

Figure 40: Latin America Market Value (US$ Million) Analysis by Country, 2019 to 2034

Figure 41: Latin America Market Volume (Units) Analysis by Country, 2019 to 2034

Figure 42: Latin America Market Value Share (%) and BPS Analysis by Country, 2024 to 2034

Figure 43: Latin America Market Y-o-Y Growth (%) Projections by Country, 2024 to 2034

Figure 44: Latin America Market Value (US$ Million) Analysis by Component, 2019 to 2034

Figure 45: Latin America Market Volume (Units) Analysis by Component, 2019 to 2034

Figure 46: Latin America Market Value Share (%) and BPS Analysis by Component, 2024 to 2034

Figure 47: Latin America Market Y-o-Y Growth (%) Projections by Component, 2024 to 2034

Figure 48: Latin America Market Value (US$ Million) Analysis by Vehicle Type, 2019 to 2034

Figure 49: Latin America Market Volume (Units) Analysis by Vehicle Type, 2019 to 2034

Figure 50: Latin America Market Value Share (%) and BPS Analysis by Vehicle Type, 2024 to 2034

Figure 51: Latin America Market Y-o-Y Growth (%) Projections by Vehicle Type, 2024 to 2034

Figure 52: Latin America Market Attractiveness by Component, 2024 to 2034

Figure 53: Latin America Market Attractiveness by Vehicle Type, 2024 to 2034

Figure 54: Latin America Market Attractiveness by Country, 2024 to 2034

Figure 55: Europe Market Value (US$ Million) by Component, 2024 to 2034

Figure 56: Europe Market Value (US$ Million) by Vehicle Type, 2024 to 2034

Figure 57: Europe Market Value (US$ Million) by Country, 2024 to 2034

Figure 58: Europe Market Value (US$ Million) Analysis by Country, 2019 to 2034

Figure 59: Europe Market Volume (Units) Analysis by Country, 2019 to 2034

Figure 60: Europe Market Value Share (%) and BPS Analysis by Country, 2024 to 2034

Figure 61: Europe Market Y-o-Y Growth (%) Projections by Country, 2024 to 2034

Figure 62: Europe Market Value (US$ Million) Analysis by Component, 2019 to 2034

Figure 63: Europe Market Volume (Units) Analysis by Component, 2019 to 2034

Figure 64: Europe Market Value Share (%) and BPS Analysis by Component, 2024 to 2034

Figure 65: Europe Market Y-o-Y Growth (%) Projections by Component, 2024 to 2034

Figure 66: Europe Market Value (US$ Million) Analysis by Vehicle Type, 2019 to 2034

Figure 67: Europe Market Volume (Units) Analysis by Vehicle Type, 2019 to 2034

Figure 68: Europe Market Value Share (%) and BPS Analysis by Vehicle Type, 2024 to 2034

Figure 69: Europe Market Y-o-Y Growth (%) Projections by Vehicle Type, 2024 to 2034

Figure 70: Europe Market Attractiveness by Component, 2024 to 2034

Figure 71: Europe Market Attractiveness by Vehicle Type, 2024 to 2034

Figure 72: Europe Market Attractiveness by Country, 2024 to 2034

Figure 73: East Asia Market Value (US$ Million) by Component, 2024 to 2034

Figure 74: East Asia Market Value (US$ Million) by Vehicle Type, 2024 to 2034

Figure 75: East Asia Market Value (US$ Million) by Country, 2024 to 2034

Figure 76: East Asia Market Value (US$ Million) Analysis by Country, 2019 to 2034

Figure 77: East Asia Market Volume (Units) Analysis by Country, 2019 to 2034

Figure 78: East Asia Market Value Share (%) and BPS Analysis by Country, 2024 to 2034

Figure 79: East Asia Market Y-o-Y Growth (%) Projections by Country, 2024 to 2034

Figure 80: East Asia Market Value (US$ Million) Analysis by Component, 2019 to 2034

Figure 81: East Asia Market Volume (Units) Analysis by Component, 2019 to 2034

Figure 82: East Asia Market Value Share (%) and BPS Analysis by Component, 2024 to 2034

Figure 83: East Asia Market Y-o-Y Growth (%) Projections by Component, 2024 to 2034

Figure 84: East Asia Market Value (US$ Million) Analysis by Vehicle Type, 2019 to 2034

Figure 85: East Asia Market Volume (Units) Analysis by Vehicle Type, 2019 to 2034

Figure 86: East Asia Market Value Share (%) and BPS Analysis by Vehicle Type, 2024 to 2034

Figure 87: East Asia Market Y-o-Y Growth (%) Projections by Vehicle Type, 2024 to 2034

Figure 88: East Asia Market Attractiveness by Component, 2024 to 2034

Figure 89: East Asia Market Attractiveness by Vehicle Type, 2024 to 2034

Figure 90: East Asia Market Attractiveness by Country, 2024 to 2034

Figure 91: South Asia Market Value (US$ Million) by Component, 2024 to 2034

Figure 92: South Asia Market Value (US$ Million) by Vehicle Type, 2024 to 2034

Figure 93: South Asia Market Value (US$ Million) by Country, 2024 to 2034

Figure 94: South Asia Market Value (US$ Million) Analysis by Country, 2019 to 2034

Figure 95: South Asia Market Volume (Units) Analysis by Country, 2019 to 2034

Figure 96: South Asia Market Value Share (%) and BPS Analysis by Country, 2024 to 2034

Figure 97: South Asia Market Y-o-Y Growth (%) Projections by Country, 2024 to 2034

Figure 98: South Asia Market Value (US$ Million) Analysis by Component, 2019 to 2034

Figure 99: South Asia Market Volume (Units) Analysis by Component, 2019 to 2034

Figure 100: South Asia Market Value Share (%) and BPS Analysis by Component, 2024 to 2034

Figure 101: South Asia Market Y-o-Y Growth (%) Projections by Component, 2024 to 2034

Figure 102: South Asia Market Value (US$ Million) Analysis by Vehicle Type, 2019 to 2034

Figure 103: South Asia Market Volume (Units) Analysis by Vehicle Type, 2019 to 2034

Figure 104: South Asia Market Value Share (%) and BPS Analysis by Vehicle Type, 2024 to 2034

Figure 105: South Asia Market Y-o-Y Growth (%) Projections by Vehicle Type, 2024 to 2034

Figure 106: South Asia Market Attractiveness by Component, 2024 to 2034

Figure 107: South Asia Market Attractiveness by Vehicle Type, 2024 to 2034

Figure 108: South Asia Market Attractiveness by Country, 2024 to 2034

Figure 109: Oceania Market Value (US$ Million) by Component, 2024 to 2034

Figure 110: Oceania Market Value (US$ Million) by Vehicle Type, 2024 to 2034

Figure 111: Oceania Market Value (US$ Million) by Country, 2024 to 2034

Figure 112: Oceania Market Value (US$ Million) Analysis by Country, 2019 to 2034

Figure 113: Oceania Market Volume (Units) Analysis by Country, 2019 to 2034

Figure 114: Oceania Market Value Share (%) and BPS Analysis by Country, 2024 to 2034

Figure 115: Oceania Market Y-o-Y Growth (%) Projections by Country, 2024 to 2034

Figure 116: Oceania Market Value (US$ Million) Analysis by Component, 2019 to 2034

Figure 117: Oceania Market Volume (Units) Analysis by Component, 2019 to 2034

Figure 118: Oceania Market Value Share (%) and BPS Analysis by Component, 2024 to 2034

Figure 119: Oceania Market Y-o-Y Growth (%) Projections by Component, 2024 to 2034

Figure 120: Oceania Market Value (US$ Million) Analysis by Vehicle Type, 2019 to 2034

Figure 121: Oceania Market Volume (Units) Analysis by Vehicle Type, 2019 to 2034

Figure 122: Oceania Market Value Share (%) and BPS Analysis by Vehicle Type, 2024 to 2034

Figure 123: Oceania Market Y-o-Y Growth (%) Projections by Vehicle Type, 2024 to 2034

Figure 124: Oceania Market Attractiveness by Component, 2024 to 2034

Figure 125: Oceania Market Attractiveness by Vehicle Type, 2024 to 2034

Figure 126: Oceania Market Attractiveness by Country, 2024 to 2034

Figure 127: MEA Market Value (US$ Million) by Component, 2024 to 2034

Figure 128: MEA Market Value (US$ Million) by Vehicle Type, 2024 to 2034

Figure 129: MEA Market Value (US$ Million) by Country, 2024 to 2034

Figure 130: MEA Market Value (US$ Million) Analysis by Country, 2019 to 2034

Figure 131: MEA Market Volume (Units) Analysis by Country, 2019 to 2034

Figure 132: MEA Market Value Share (%) and BPS Analysis by Country, 2024 to 2034

Figure 133: MEA Market Y-o-Y Growth (%) Projections by Country, 2024 to 2034

Figure 134: MEA Market Value (US$ Million) Analysis by Component, 2019 to 2034

Figure 135: MEA Market Volume (Units) Analysis by Component, 2019 to 2034

Figure 136: MEA Market Value Share (%) and BPS Analysis by Component, 2024 to 2034

Figure 137: MEA Market Y-o-Y Growth (%) Projections by Component, 2024 to 2034

Figure 138: MEA Market Value (US$ Million) Analysis by Vehicle Type, 2019 to 2034

Figure 139: MEA Market Volume (Units) Analysis by Vehicle Type, 2019 to 2034

Figure 140: MEA Market Value Share (%) and BPS Analysis by Vehicle Type, 2024 to 2034

Figure 141: MEA Market Y-o-Y Growth (%) Projections by Vehicle Type, 2024 to 2034

Figure 142: MEA Market Attractiveness by Component, 2024 to 2034

Figure 143: MEA Market Attractiveness by Vehicle Type, 2024 to 2034

Figure 144: MEA Market Attractiveness by Country, 2024 to 2034

Frequently Asked Questions

What is the expected worth of the automotive interior market in 2024?

As of 2024, the market for automotive interiors is expected to be valued at USD 166.7 billion.

What is the anticipated market value for automotive interiors in 2034?

By 2034, the market value of automotive interiors is expected to reach USD 270 billion.

What is the projected forecast CAGR for the automotive interior market from 2024 to 2034?

From 2024 to 2034, the automotive interior market is expected to flourish at a CAGR of 4.9%.

Based on the component, which segment dominates the automotive interior market?

The cockpit module segment is expected to rise at a CAGR of 4.7% from 2024 to 2034.

Which country is likely to be at the pinnacle of the market?

South Korea is likely the top-performing market, with a CAGR of 7.0%.

Explore Similar Insights

Future Market Insights

Automotive Interior Market