Reports

- Global Locations -

Headquarters

Future Market Insights, Inc.

Christiana Corporate, 200
Continental Drive, Suite 401,
Newark, Delaware - 19713,
United States

T: +1-845-579-5705

Americas

Future Market Insights, Inc.

616 Corporate Way, Suite 2-9018,
Valley Cottage, NY 10989, United States

T: +1-347-918-3531

MEA

Future Market Insights

1602-6 Jumeirah Bay X2 Tower, Plot No: JLT-PH2-X2A,
Jumeirah Lakes Towers, Dubai,
United Arab Emirates

Europe

Future Market Insights

3rd Floor, 207 Regent Street,
W1B 3HH London
United Kingdom

T: + 44 (0) 20 8123 9659
D: +44 (0) 20 3287 4268

Asia Pacific

Future Market Insights

IndiaLand Global Tech Park, Unit UG-1, Behind Grand HighStreet, Phase 1, Hinjawadi, MH, Pune – 411057, India

Automotive Interior Leather Market Outlook (2023 to 2033)

The rising demand for lightweight design and optimized efficiency, while simultaneously providing comfort for the driver and passengers is the key factor aiding the automotive interior leather market growth. Automobile manufacturers are using synthetic leathers in vehicle interior components such as steering wheels and door panels owing to the rising demand for aesthetic-looking vehicle interiors.

Car seats for instance play an integral role in reducing the overall weight of a vehicle and improving its fuel efficiency. Moreover, increasing consumer preference towards styling and comfort along with safety is expected to fuel the demand for automotive interior leather.

In its new study, ESOMAR-certified market research and consulting firm Future Market Insights (FMI) offers insights into key factors driving demand for Global Automotive Interior Leather.

The report tracks the global sales of Global Automotive Interior Leather in 20+ high-growth markets, along with analyzing the impact COVID-19 has had on the automotive industry in general, and Global Automotive Interior Leather in particular.

Attributes Details
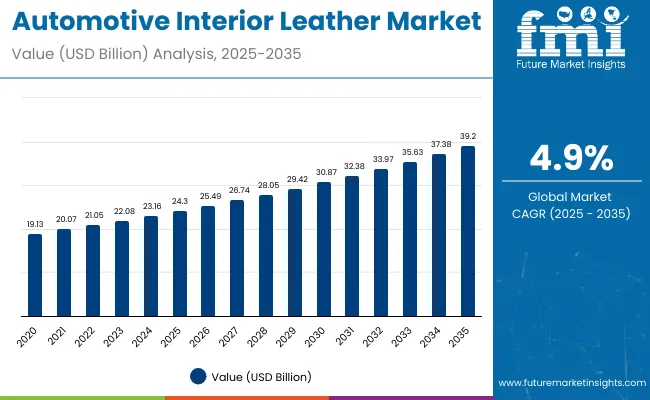
Automotive Interior Leather Market Value (2022) US$ 9.7 billion
Automotive Interior Leather Market Value (2023) US$ 34.94 billion
Automotive Interior Leather Market Expected Value (2033) US$ 54.27 billion
Automotive Interior Leather Market Projected CAGR (2023 to 2033) 4.5%

Don't pay for what you don't need

Customize your report by selecting specific countries or regions and save 30%!

Interior Leather Market in Comparison to Historic Sales?

Interior design and comfort to emerge as primary growth attributes

Interior design and comfort are key factors influencing a buyer’s decision when getting a new car. These components have always been the primary concerns of people interested in investing in a vehicle. Faux leather or artificial leather or synthetic leather, is being more commonly used these days in car upholsteries due to its affordability and positive attributes such as easy-to-clean and visually appealing look.

The market is likely to gain significantly from the growing replacement and aftermarket installation of the interior leather. This provides opportunities for newcomers as well as established players to gain traction. Consequently, this will result in the advent of better custom requirement solutions for vehicle owners.

Some of the leading players in the automotive interior leather market are investing in research and development (R&D) activities to facilitate the provision of a variety of leather produced in various colors and materials for diverse uses. Through this, manufacturers intend at keeping pace with the dynamic environment.

Leather has been consistently used in vehicles due to rising demand for lightweight, high quality, and durable leather interiors, especially for seats, which improves not only the foundation of the car but also ensures comfort to the driver and passengers. Owing to the ongoing crisis caused by the COVID-19 pandemic, automotive production and related supply chain activities have been disrupted. While this could inhibit the growth of the market, sales are expected to recover with the containment of the pandemic. The global market was exhibiting a CAGR of 3.9% over the historical period.

A key factor to consider here is that the COVID-19 outbreak disrupted sales across some of the most lucrative pockets. With several producers affected in regions such as South Asia and the Pacific and the Middle East and Africa, restricted supply and shortage in demand are expected to result in a temporary period of lull. Nonetheless, FMI has forecast the global automotive interior leather market to grow at a 4.5% CAGR through 2033.

What is the Commercial Potential of Automotive Interior Leather?

High expenditure to drive the rapid development of automotive sector

The automotive interior leather is designed to provide comfort and improve the visual appeal of the interior of any vehicle. It also leaves the vehicle with a remarkable appearance and feel. It is used widely for automotive interiors across the globe, especially in midrange and premium passenger vehicles.

Growing spending capacity and rapid developments in automobile manufacturing are giving tailwinds to market growth. The interior of a vehicle that adds to its aesthetic appeal has remained a primary factor determining the purchase decision of potential vehicle owners. With customers willing to spend a little more on style and comfort, the demand for automotive interior leather is poised to surge considerably in the coming years.

Nikhil Kaitwade
Nikhil Kaitwade

Principal Consultant

Talk to Analyst

Find your sweet spots for generating winning opportunities in this market.

What is the impact of the regulatory framework?

Strict regulatory acts to impede the market growth

Automotive interior leather and textile manufacturers operate within the purview of government regulations. Most of these regulations target some of the important factors such as product safety standards, manufacturing parameters, and disposal methods. For instance, in India registration, construction, and maintenance of motor vehicles and others are governed by Central Motor Vehicles Rules (CMVR), 1989, and Motor Vehicles Act (MVA), 1988.

Besides this, the formation of the International Automotive Task Force (ITAF), intended at providing improved quality automotive products worldwide has had considerable influence on the market. Some of the leading automakers such as BMW Group, Ford Motor Company, and General Motors among others are members of this organization.

The rising focus on providing better quality and experience has been encouraging carmakers to be a member of similar international organizations. This is expected to drive the market in the coming years.

Comparative Analysis of the Adjacent Market

Automotive Interior Leather Market:

Differentiating Aspects Automotive Interior Leather Market
CAGR (2023 to 2033) 4.5%
Market Valuation in 2023 US$ 34.94 billion
Projected Market Value in 2033 US$ 54.27 billion
Growth Factors Growing spending power and rapid advancements in automotive production are providing positive momentum to market growth.
Opportunities The growing emphasis on delivering better quality and experience has encouraged automakers to join similar international organizations, opening up new opportunities for the companies.
Key Trends The growing emphasis on providing better customer service and quality has encouraged automakers to join similar international organizations.

Leather Goods Market:

Differentiating Aspects Leather Goods Market
CAGR (2023 to 2033) 6.7%
Market Valuation in 2023 US$ 245 billion
Projected Market Value in 2033 US$ 468.61 billion
Growth Factors Rising consumer interest in comfortable, fashionable, and elegant leather apparel, footwear, and accessories, along with a greater understanding of brands will contribute to growth in the leather goods market.
Opportunities Designers all over the globe showcase fresh apparel at fashion shows and events, drawing in more customers to leather goods. On leather-based apparel and other elegant clothes, different embroidery techniques such as brocade, Lamé, and applique are frequently employed.
Key Trends As many well-known designers have promoted the notion of sustainability, environmentally conscious clothing is steadily pulling consumers.

Get the data you need at a Fraction of the cost

Personalize your report by choosing insights you need
and save 40%!

Country-wise Insights

Which Vehicle Category is Exhibiting High Demand in the United States Market?

United States to dominate North America market

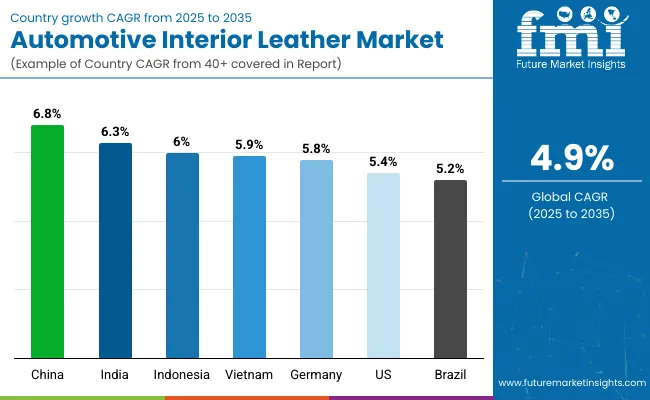
FMI has forecast the United States market for automotive interior leather to grow at a healthy rate over the forecast period. The rising demand for light vehicles will boost sales in America. However, demand in the United States is driven primarily by the commercial vehicle market, accounting for a nearly two-thirds share of the market.

According to Trading Economics, total vehicle sales in the United States reached 16.60 million in January 2021 from 16.30 million in December 2020. Despite the crippling effect of the pandemic on United States car sales, steady demand for aftermarkets will ascertain steady sales of automotive interior leather in the country.

What is The Impact of the Aftermarket Sector in the United Kingdom?

The autonomous sector in United Kingdom to spur market development

The auto industry in the United Kingdom averted what could potentially hamper growth when the United Kingdom and European Union agreed upon the post Brexit trade accord. It remains to be seen how the domestic United Kingdom auto industry will respond in the coming years as the road will continue to be rocky for the foreseeable future.

However, aftermarket customization and replacement remain positive hope for automotive interior leather in the United Kingdom. Increasing customers’ attention on the latest features in car interiors and their preferences are decisive factors, which are driving the market for automotive interior leather. With growing recreational activities, the demand for luxury and sports vehicles’ aftermarket customization remains certain.

How Improving Auto Sales in China Impacting Automotive Interior Leather Market?

High investment is poised to accelerate Chinese market

China presents lucrative opportunities for the expansion of the automotive interior leather market on account of the customers’ willingness towards spending on premium vehicles and their interiors.

In addition, surging demand for artificial/synthetic leather in cheaper motor vehicle variants will create lucrative prospects for growth during the forecast period. Also, the automotive sector in China is expanding at a fast pace, providing attractive opportunities for manufacturers of automotive interior leather.

How are Japan-based Manufacturers Positioned in the Market?

Compact automobiles substance in Japan to propel the industry

The demand for customized interiors in vehicles is rising in Japan which is boosting the growth of the market. The popularity of lightweight automotive materials for vehicle interiors is driven by the increasing sales of lightweight vehicles as both manufacturers and buyers aim for maximum fuel efficiency.

Japan also has become a key supplier of materials used for providing a luxurious feel in car interiors. More specifically, Japanese firms are in the driver’s position for high-end synthetic suede and leather used to cover car seats and other interior components in vehicles. Manufacturers within Japan have combined Japanese manufacturing excellence, a willingness to spend money on R&D, and the ability to forge close relationships with Japanese carmakers to come up with top-end seat materials.

How Surging Auto Production Will Benefit Automotive Interior Leather Sales in India?

India to take over the South Asian Industry

India is a major passenger vehicle manufacturing hub in Asia, which makes it a lucrative market for automotive interior leather sales. According to data released by the Society of Indian Automobile Manufacturers (SIAM), passenger vehicle wholesales in India increased by 11.4% in January 2020, despite supply chain challenges.

FMI too has identified India as one of the highly lucrative markets in South Asia. Despite the temporary downturn registered amid COVID-19, the demand for automotive interior leather is expected to rise in the country in response to the recovering auto sales.

Category-wise Insights

How will Synthetic Leather Segment Outpace Its Counterparts?

High demand for vegan products to drive segment growth

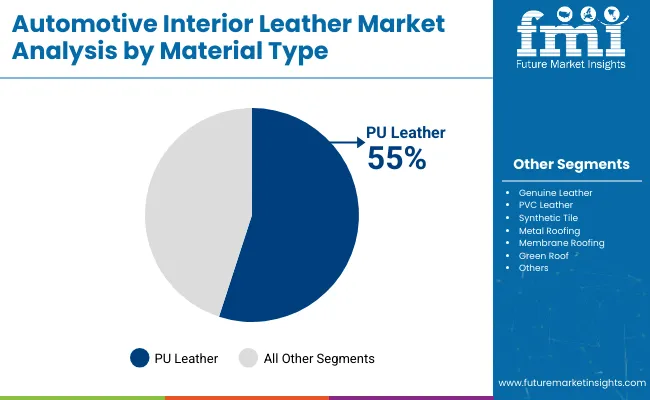
Due to increasing demand for cruelty-free products among customers and hindrances towards the use of leather made of cattle hides, an increasing number of premium car makers are exhibiting an inclination towards synthetic leather. They consider it a better alternative than real/genuine leather. Fake/synthetic leather trim was introduced as a cheap substitute for real leather. It is now being keenly pursued by various customers, especially by customers who prefer environmental-friendly vehicles.

How is the Market Gaining from Passenger Vehicles Sales?

Passenger cars segment to boost the industry growth

Passenger cars such as sports utility vehicles (SUVs) and sedans continue to be high in demand. This has helped the passenger cars segment to emerge as the largest end-user in the market. The expansion of the automobile industry and increasing sales of passenger vehicles are making the interior leather market more attractive.

Various interior features that were previously available in premium and luxury cars are now being introduced in mid-size and compact cars by manufacturers to stand apart from competitors. There also is immense focus on strengthening their product portfolio. Increasing consumer preference for passenger cars and attention towards automotive interior components such as upholstery, seat, seat belts, trunk & floor carpets, and leather-covered dashboards is fuelling the demand for automotive interior leather. The passenger vehicles segment took over the automotive interior leather market in terms of revenue with a percentage of more than 51.5% in 2022.

What Makes OEMs Preferred Sales Channel?

OEM to dominate sales channel growth

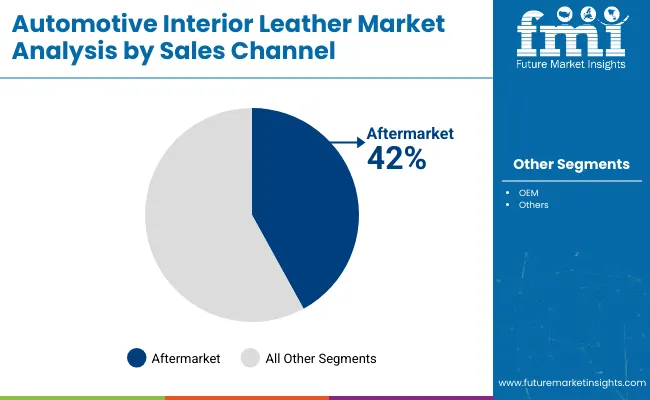
Under the sales channel segment, the original equipment manufacturer (OEM) channel is expected to record faster growth than the aftermarket segment. However, due to rising demand for customization, aftermarket sales are expected to increase shortly. Consumers’ inclination for retrofitting automobile interiors is also supporting expansion through the aftermarket channel.

Why Upholstery Remains the Most Lucrative Application Segment?

Advanced automotive interior to surge the segment growth

Currently, customers consider automotive upholstery as one of the most important prerequisites while purchasing a car. Also, rising demand for lightweight automotive materials and increasing demand for advanced automotive interiors are some of the key aspects that are likely to propel the automotive interior leather market growth over the forecast period.

Competitive Landscape

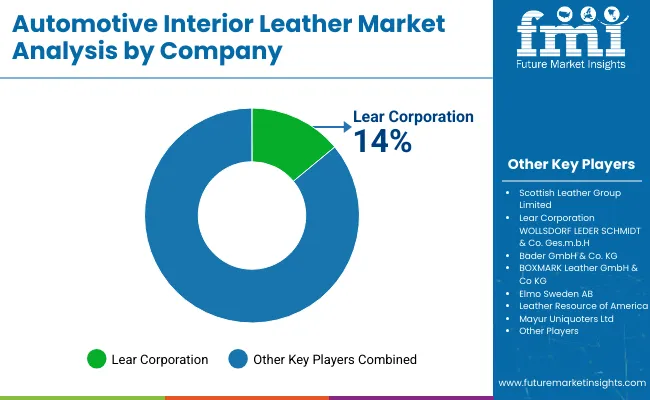
The global automotive interior leather market is highly fragmented. Some of the players are focusing to carve a niche for specific regions or vehicle types. Companies operating in the market are focusing on strategic collaborations. There is also a focus on introducing sustainable materials to keep pace with changing consumer preferences. However, expansion strategies are expected to remain highly popular among leading players.

For instance:

  • GST AutoLeather Inc. inaugurated a new leather finishing facility in Jiaxing, in April 2019
  • Faurecia S.A. also inaugurated a production line in Huejotzingo, Puebla, Mexico in June 2017
  • Sage-ONF, a synthetic leather producer and distributor, began serial manufacturing of silicone artificial leather for automotive interiors in July 2022. Due to high customer interest, the sage-ONF plant has begun production in Shanghai, China.
  • ILM presented a unique digital forum in December 2021 that revived together significant stakeholders from across the automotive leather manufacturing chain to shed the spotlight on the key improvements in addition to long-term conditions that will influence the industry in the years and months to come.
  • In an interview with Bloomberg in October 2022, Noboru Yoshimura, president of the Tokyo-based vegan leather producer, stated that as more individuals use the leather, the firm is deliberately creating premium products. Land Rover, among others, has complied with the suit by putting the material among choices for seating. The recently released Range Rover SV's interior is made of synthetic leather.

Some of the leading companies operating in the market are

  • Lear Corporation
  • Seiren Co., Ltd
  • GST AutoLeather Inc
  • BOXMARK Leather GmbH & Co KG
  • Bader GmbH & Co. KG
  • Katzkin Leather,Inc. 
  • Leather Resource of America
  • WOLLSDORF LEDER SCHMIDT & Co. Ges.m.b.H.
  • DK Leather Corporation
  • Scottish Leather Group Limited

Scope of the Report

Attribute Details
Forecast Period 2023 to 2033
Historical Data Available for 2018 to 2022
Market Analysis USD Million for value and Sq meters for Volume
Key Regions Covered North America, Latin America, Europe, East Asia, South Asia & Pacific, Middle East & Africa
Key Countries Covered United States, Canada, Germany, United Kingdom, France, Italy, Spain, Russia, Poland China, Japan, South Korea, India, ASEAN, GCC Countries, South Africa
Key Segments Covered Material Type, Vehicle Type, Application, Sales Channel and Region
Key Companies Profiled
  • Lear Corporation
  • Seiren Co., Ltd
  • GST AutoLeather Inc
  • BOXMARK Leather GmbH & Co KG
  • Bader GmbH & Co. KG
  • Katzkin Leather,Inc.
  • Leather Resource of America
  • WOLLSDORF LEDER SCHMIDT & Co. Ges.m.b.H.
  • DK Leather Corporation
  • Scottish Leather Group Limited
Report Coverage Market Forecast, brand share analysis, competition intelligence, DROT analysis, Market Dynamics and Challenges, Strategic Growth Initiatives
Customization & Pricing Available upon Request

Global Automotive Interior Leather Market by Category

Material Type:

  • Genuine Leather
  • Synthetic Leather
    • PU Leather
    • PVC

Vehicle Type:

  • Passenger Cars
    • Compact
    • Mid-Sized
    • Sedan
    • Luxury
    • Van
  • Light Commercial Vehicles
  • Heavy Commercial Vehicles

Application:

  • Upholstery
  • Dashboard
  • Seat belts
  • Air-bags
  • Floor & trunk carpets
  • Headliners
  • Others

Sales Channel:

  • OEM
  • Aftermarket

Region:

  • North America
  • Latin America
  • Europe
  • East Asia
  • South Asia & Pacific
  • Middle East and Africa (MEA)

Frequently Asked Questions

What is the Growth Potential of the Automotive Interior Leather Market?

The market is expected to record a CAGR of 4.5% through 2033.

How Big is the Automotive Interior Leather Market?

The market is valued at US$ 34.94 billion in 2023.

What is the Projected Market Value of the Market for 2033?

The projected market value for 2033 is US$ 54.27 billion.

How Key Players are Developing the Automotive Interior Leather Market?

Key players are focusing on innovation.

Who are the Key Automotive Interior Leather Market Players?

Lear Corporation, GST Autoleather Inc., and JBS Couros are key market players.

Table of Content

1. Executive Summary

    1.1. Global Market Outlook

    1.2. Demand-side Trends

    1.3. Supply-side Trends

    1.4. Technology Roadmap Analysis

    1.5. Analysis and Recommendations

2. Market Overview

    2.1. Market Coverage / Taxonomy

    2.2. Market Definition / Scope / Limitations

3. Market Background

    3.1. Market Dynamics

        3.1.1. Drivers

        3.1.2. Restraints

        3.1.3. Opportunity

        3.1.4. Trends

    3.2. Scenario Forecast

        3.2.1. Demand in Optimistic Scenario

        3.2.2. Demand in Likely Scenario

        3.2.3. Demand in Conservative Scenario

    3.3. Opportunity Map Analysis

    3.4. Product Life Cycle Analysis

    3.5. Supply Chain Analysis

        3.5.1. Supply Side Participants and their Roles

            3.5.1.1. Producers

            3.5.1.2. Mid-Level Participants (Traders/ Agents/ Brokers)

            3.5.1.3. Wholesalers and Distributors

        3.5.2. Value Added and Value Created at Node in the Supply Chain

        3.5.3. List of Raw Material Suppliers

        3.5.4. List of Existing and Potential Buyer’s

    3.6. Investment Feasibility Matrix

    3.7. Value Chain Analysis

        3.7.1. Profit Margin Analysis

        3.7.2. Wholesalers and Distributors

        3.7.3. Retailers

    3.8. PESTLE and Porter’s Analysis

    3.9. Regulatory Landscape

        3.9.1. By Key Regions

        3.9.2. By Key Countries

    3.10. Regional Parent Market Outlook

    3.11. Production and Consumption Statistics

    3.12. Import and Export Statistics

4. Global Market Analysis 2018 to 2022 and Forecast, 2023 to 2033

    4.1. Historical Market Size Value (US$ Million) & Volume (Sq meters) Analysis, 2018 to 2022

    4.2. Current and Future Market Size Value (US$ Million) & Volume (Sq meters) Projections, 2023 to 2033

        4.2.1. Y-o-Y Growth Trend Analysis

        4.2.2. Absolute $ Opportunity Analysis

5. Global Market Analysis 2018 to 2022 and Forecast 2023 to 2033, By Material

    5.1. Introduction / Key Findings

    5.2. Historical Market Size Value (US$ Million) & Volume (Sq meters) Analysis By Material, 2018 to 2022

    5.3. Current and Future Market Size Value (US$ Million) & Volume (Sq meters) Analysis and Forecast By Material, 2023 to 2033

        5.3.1. Genuine Leather

        5.3.2. Synthetic Leather

            5.3.2.1. PU Leather

            5.3.2.2. PVC

    5.4. Y-o-Y Growth Trend Analysis By Material, 2018 to 2022

    5.5. Absolute $ Opportunity Analysis By Material, 2023 to 2033

6. Global Market Analysis 2018 to 2022 and Forecast 2023 to 2033, By Vehicle Type

    6.1. Introduction / Key Findings

    6.2. Historical Market Size Value (US$ Million) & Volume (Sq meters) Analysis By Vehicle Type, 2018 to 2022

    6.3. Current and Future Market Size Value (US$ Million) & Volume (Sq meters) Analysis and Forecast By Vehicle Type, 2023 to 2033

        6.3.1. Passenger Cars

            6.3.1.1. Compact

            6.3.1.2. Mid-Sized

            6.3.1.3. Sedan

            6.3.1.4. Luxury

            6.3.1.5. Van

        6.3.2. Light Commercial Vehicles

        6.3.3. Heavy Commercial Vehicles

    6.4. Y-o-Y Growth Trend Analysis By Vehicle Type, 2018 to 2022

    6.5. Absolute $ Opportunity Analysis By Vehicle Type, 2023 to 2033

7. Global Market Analysis 2018 to 2022 and Forecast 2023 to 2033, By Application

    7.1. Introduction / Key Findings

    7.2. Historical Market Size Value (US$ Million) & Volume (Sq meters) Analysis By Application, 2018 to 2022

    7.3. Current and Future Market Size Value (US$ Million) & Volume (Sq meters) Analysis and Forecast By Application, 2023 to 2033

        7.3.1. Upholstery

        7.3.2. Dashboard

        7.3.3. Seat belts

        7.3.4. Air-bags

        7.3.5. Floor & trunk carpets

        7.3.6. Headliners

        7.3.7. Others

    7.4. Y-o-Y Growth Trend Analysis By Application, 2018 to 2022

    7.5. Absolute $ Opportunity Analysis By Application, 2023 to 2033

8. Global Market Analysis 2018 to 2022 and Forecast 2023 to 2033, By Sales Channel

    8.1. Introduction / Key Findings

    8.2. Historical Market Size Value (US$ Million) & Volume (Sq meters) Analysis By Sales Channel, 2018 to 2022

    8.3. Current and Future Market Size Value (US$ Million) & Volume (Sq meters) Analysis and Forecast By Sales Channel, 2023 to 2033

        8.3.1. OEM

        8.3.2. Aftermarket

    8.4. Y-o-Y Growth Trend Analysis By Sales Channel, 2018 to 2022

    8.5. Absolute $ Opportunity Analysis By Sales Channel, 2023 to 2033

9. Global Market Analysis 2018 to 2022 and Forecast 2023 to 2033, By Region

    9.1. Introduction

    9.2. Historical Market Size Value (US$ Million) & Volume (Sq meters) Analysis By Region, 2018 to 2022

    9.3. Current Market Size Value (US$ Million) & Volume (Sq meters) Analysis and Forecast By Region, 2023 to 2033

        9.3.1. North America

        9.3.2. Latin America

        9.3.3. Europe

        9.3.4. Asia Pacific

        9.3.5. MEA

    9.4. Market Attractiveness Analysis By Region

10. North America Market Analysis 2018 to 2022 and Forecast 2023 to 2033, By Country

    10.1. Historical Market Size Value (US$ Million) & Volume (Sq meters) Trend Analysis By Market Taxonomy, 2018 to 2022

    10.2. Market Size Value (US$ Million) & Volume (Sq meters) Forecast By Market Taxonomy, 2023 to 2033

        10.2.1. By Country

            10.2.1.1. The USA

            10.2.1.2. Canada

        10.2.2. By Material

        10.2.3. By Vehicle Type

        10.2.4. By Application

        10.2.5. By Sales Channel

    10.3. Market Attractiveness Analysis

        10.3.1. By Country

        10.3.2. By Material

        10.3.3. By Vehicle Type

        10.3.4. By Application

        10.3.5. By Sales Channel

    10.4. Key Takeaways

11. Latin America Market Analysis 2018 to 2022 and Forecast 2023 to 2033, By Country

    11.1. Historical Market Size Value (US$ Million) & Volume (Sq meters) Trend Analysis By Market Taxonomy, 2018 to 2022

    11.2. Market Size Value (US$ Million) & Volume (Sq meters) Forecast By Market Taxonomy, 2023 to 2033

        11.2.1. By Country

            11.2.1.1. Brazil

            11.2.1.2. Mexico

            11.2.1.3. Rest of Latin America

        11.2.2. By Material

        11.2.3. By Vehicle Type

        11.2.4. By Application

        11.2.5. By Sales Channel

    11.3. Market Attractiveness Analysis

        11.3.1. By Country

        11.3.2. By Material

        11.3.3. By Vehicle Type

        11.3.4. By Application

        11.3.5. By Sales Channel

    11.4. Key Takeaways

12. Europe Market Analysis 2018 to 2022 and Forecast 2023 to 2033, By Country

    12.1. Historical Market Size Value (US$ Million) & Volume (Sq meters) Trend Analysis By Market Taxonomy, 2018 to 2022

    12.2. Market Size Value (US$ Million) & Volume (Sq meters) Forecast By Market Taxonomy, 2023 to 2033

        12.2.1. By Country

            12.2.1.1. Germany

            12.2.1.2. United Kingdom

            12.2.1.3. France

            12.2.1.4. Spain

            12.2.1.5. Italy

            12.2.1.6. Rest of Europe

        12.2.2. By Material

        12.2.3. By Vehicle Type

        12.2.4. By Application

        12.2.5. By Sales Channel

    12.3. Market Attractiveness Analysis

        12.3.1. By Country

        12.3.2. By Material

        12.3.3. By Vehicle Type

        12.3.4. By Application

        12.3.5. By Sales Channel

    12.4. Key Takeaways

13. Asia Pacific Market Analysis 2018 to 2022 and Forecast 2023 to 2033, By Country

    13.1. Historical Market Size Value (US$ Million) & Volume (Sq meters) Trend Analysis By Market Taxonomy, 2018 to 2022

    13.2. Market Size Value (US$ Million) & Volume (Sq meters) Forecast By Market Taxonomy, 2023 to 2033

        13.2.1. By Country

            13.2.1.1. China

            13.2.1.2. Japan

            13.2.1.3. South Korea

            13.2.1.4. Singapore

            13.2.1.5. Thailand

            13.2.1.6. Indonesia

            13.2.1.7. Australia

            13.2.1.8. New Zealand

            13.2.1.9. Rest of Asia Pacific

        13.2.2. By Material

        13.2.3. By Vehicle Type

        13.2.4. By Application

        13.2.5. By Sales Channel

    13.3. Market Attractiveness Analysis

        13.3.1. By Country

        13.3.2. By Material

        13.3.3. By Vehicle Type

        13.3.4. By Application

        13.3.5. By Sales Channel

    13.4. Key Takeaways

14. MEA Market Analysis 2018 to 2022 and Forecast 2023 to 2033, By Country

    14.1. Historical Market Size Value (US$ Million) & Volume (Sq meters) Trend Analysis By Market Taxonomy, 2018 to 2022

    14.2. Market Size Value (US$ Million) & Volume (Sq meters) Forecast By Market Taxonomy, 2023 to 2033

        14.2.1. By Country

            14.2.1.1. GCC Countries

            14.2.1.2. South Africa

            14.2.1.3. Israel

            14.2.1.4. Rest of MEA

        14.2.2. By Material

        14.2.3. By Vehicle Type

        14.2.4. By Application

        14.2.5. By Sales Channel

    14.3. Market Attractiveness Analysis

        14.3.1. By Country

        14.3.2. By Material

        14.3.3. By Vehicle Type

        14.3.4. By Application

        14.3.5. By Sales Channel

    14.4. Key Takeaways

15. Key Countries Market Analysis

    15.1. USA

        15.1.1. Pricing Analysis

        15.1.2. Market Share Analysis, 2022

            15.1.2.1. By Material

            15.1.2.2. By Vehicle Type

            15.1.2.3. By Application

            15.1.2.4. By Sales Channel

    15.2. Canada

        15.2.1. Pricing Analysis

        15.2.2. Market Share Analysis, 2022

            15.2.2.1. By Material

            15.2.2.2. By Vehicle Type

            15.2.2.3. By Application

            15.2.2.4. By Sales Channel

    15.3. Brazil

        15.3.1. Pricing Analysis

        15.3.2. Market Share Analysis, 2022

            15.3.2.1. By Material

            15.3.2.2. By Vehicle Type

            15.3.2.3. By Application

            15.3.2.4. By Sales Channel

    15.4. Mexico

        15.4.1. Pricing Analysis

        15.4.2. Market Share Analysis, 2022

            15.4.2.1. By Material

            15.4.2.2. By Vehicle Type

            15.4.2.3. By Application

            15.4.2.4. By Sales Channel

    15.5. Germany

        15.5.1. Pricing Analysis

        15.5.2. Market Share Analysis, 2022

            15.5.2.1. By Material

            15.5.2.2. By Vehicle Type

            15.5.2.3. By Application

            15.5.2.4. By Sales Channel

    15.6. United Kingdom

        15.6.1. Pricing Analysis

        15.6.2. Market Share Analysis, 2022

            15.6.2.1. By Material

            15.6.2.2. By Vehicle Type

            15.6.2.3. By Application

            15.6.2.4. By Sales Channel

    15.7. France

        15.7.1. Pricing Analysis

        15.7.2. Market Share Analysis, 2022

            15.7.2.1. By Material

            15.7.2.2. By Vehicle Type

            15.7.2.3. By Application

            15.7.2.4. By Sales Channel

    15.8. Spain

        15.8.1. Pricing Analysis

        15.8.2. Market Share Analysis, 2022

            15.8.2.1. By Material

            15.8.2.2. By Vehicle Type

            15.8.2.3. By Application

            15.8.2.4. By Sales Channel

    15.9. Italy

        15.9.1. Pricing Analysis

        15.9.2. Market Share Analysis, 2022

            15.9.2.1. By Material

            15.9.2.2. By Vehicle Type

            15.9.2.3. By Application

            15.9.2.4. By Sales Channel

    15.10. China

        15.10.1. Pricing Analysis

        15.10.2. Market Share Analysis, 2022

            15.10.2.1. By Material

            15.10.2.2. By Vehicle Type

            15.10.2.3. By Application

            15.10.2.4. By Sales Channel

    15.11. Japan

        15.11.1. Pricing Analysis

        15.11.2. Market Share Analysis, 2022

            15.11.2.1. By Material

            15.11.2.2. By Vehicle Type

            15.11.2.3. By Application

            15.11.2.4. By Sales Channel

    15.12. South Korea

        15.12.1. Pricing Analysis

        15.12.2. Market Share Analysis, 2022

            15.12.2.1. By Material

            15.12.2.2. By Vehicle Type

            15.12.2.3. By Application

            15.12.2.4. By Sales Channel

    15.13. Singapore

        15.13.1. Pricing Analysis

        15.13.2. Market Share Analysis, 2022

            15.13.2.1. By Material

            15.13.2.2. By Vehicle Type

            15.13.2.3. By Application

            15.13.2.4. By Sales Channel

    15.14. Thailand

        15.14.1. Pricing Analysis

        15.14.2. Market Share Analysis, 2022

            15.14.2.1. By Material

            15.14.2.2. By Vehicle Type

            15.14.2.3. By Application

            15.14.2.4. By Sales Channel

    15.15. Indonesia

        15.15.1. Pricing Analysis

        15.15.2. Market Share Analysis, 2022

            15.15.2.1. By Material

            15.15.2.2. By Vehicle Type

            15.15.2.3. By Application

            15.15.2.4. By Sales Channel

    15.16. Australia

        15.16.1. Pricing Analysis

        15.16.2. Market Share Analysis, 2022

            15.16.2.1. By Material

            15.16.2.2. By Vehicle Type

            15.16.2.3. By Application

            15.16.2.4. By Sales Channel

    15.17. New Zealand

        15.17.1. Pricing Analysis

        15.17.2. Market Share Analysis, 2022

            15.17.2.1. By Material

            15.17.2.2. By Vehicle Type

            15.17.2.3. By Application

            15.17.2.4. By Sales Channel

    15.18. GCC Countries

        15.18.1. Pricing Analysis

        15.18.2. Market Share Analysis, 2022

            15.18.2.1. By Material

            15.18.2.2. By Vehicle Type

            15.18.2.3. By Application

            15.18.2.4. By Sales Channel

    15.19. South Africa

        15.19.1. Pricing Analysis

        15.19.2. Market Share Analysis, 2022

            15.19.2.1. By Material

            15.19.2.2. By Vehicle Type

            15.19.2.3. By Application

            15.19.2.4. By Sales Channel

    15.20. Israel

        15.20.1. Pricing Analysis

        15.20.2. Market Share Analysis, 2022

            15.20.2.1. By Material

            15.20.2.2. By Vehicle Type

            15.20.2.3. By Application

            15.20.2.4. By Sales Channel

16. Market Structure Analysis

    16.1. Competition Dashboard

    16.2. Competition Benchmarking

    16.3. Market Share Analysis of Top Players

        16.3.1. By Regional

        16.3.2. By Material

        16.3.3. By Vehicle Type

        16.3.4. By Application

        16.3.5. By Sales Channel

17. Competition Analysis

    17.1. Competition Deep Dive

        17.1.1. Lear Corporation

            17.1.1.1. Overview

            17.1.1.2. Product Portfolio

            17.1.1.3. Profitability by Market Segments

            17.1.1.4. Sales Footprint

            17.1.1.5. Strategy Overview

                17.1.1.5.1. Marketing Strategy

                17.1.1.5.2. Product Strategy

                17.1.1.5.3. Channel Strategy

        17.1.2. Seiren Co., Ltd

            17.1.2.1. Overview

            17.1.2.2. Product Portfolio

            17.1.2.3. Profitability by Market Segments

            17.1.2.4. Sales Footprint

            17.1.2.5. Strategy Overview

                17.1.2.5.1. Marketing Strategy

                17.1.2.5.2. Product Strategy

                17.1.2.5.3. Channel Strategy

        17.1.3. GST AutoLeather Inc

            17.1.3.1. Overview

            17.1.3.2. Product Portfolio

            17.1.3.3. Profitability by Market Segments

            17.1.3.4. Sales Footprint

            17.1.3.5. Strategy Overview

                17.1.3.5.1. Marketing Strategy

                17.1.3.5.2. Product Strategy

                17.1.3.5.3. Channel Strategy

        17.1.4. BOXMARK Leather GmbH & Co KG

            17.1.4.1. Overview

            17.1.4.2. Product Portfolio

            17.1.4.3. Profitability by Market Segments

            17.1.4.4. Sales Footprint

            17.1.4.5. Strategy Overview

                17.1.4.5.1. Marketing Strategy

                17.1.4.5.2. Product Strategy

                17.1.4.5.3. Channel Strategy

        17.1.5. Bader GmbH & Co. KG

            17.1.5.1. Overview

            17.1.5.2. Product Portfolio

            17.1.5.3. Profitability by Market Segments

            17.1.5.4. Sales Footprint

            17.1.5.5. Strategy Overview

                17.1.5.5.1. Marketing Strategy

                17.1.5.5.2. Product Strategy

                17.1.5.5.3. Channel Strategy

        17.1.6. Katzkin Leather,Inc. 

            17.1.6.1. Overview

            17.1.6.2. Product Portfolio

            17.1.6.3. Profitability by Market Segments

            17.1.6.4. Sales Footprint

            17.1.6.5. Strategy Overview

                17.1.6.5.1. Marketing Strategy

                17.1.6.5.2. Product Strategy

                17.1.6.5.3. Channel Strategy

        17.1.7. Leather Resource of America

            17.1.7.1. Overview

            17.1.7.2. Product Portfolio

            17.1.7.3. Profitability by Market Segments

            17.1.7.4. Sales Footprint

            17.1.7.5. Strategy Overview

                17.1.7.5.1. Marketing Strategy

                17.1.7.5.2. Product Strategy

                17.1.7.5.3. Channel Strategy

        17.1.8. WOLLSDORF LEDER SCHMIDT & Co. Ges.m.b.H.

            17.1.8.1. Overview

            17.1.8.2. Product Portfolio

            17.1.8.3. Profitability by Market Segments

            17.1.8.4. Sales Footprint

            17.1.8.5. Strategy Overview

                17.1.8.5.1. Marketing Strategy

                17.1.8.5.2. Product Strategy

                17.1.8.5.3. Channel Strategy

        17.1.9. DK Leather Corporation

            17.1.9.1. Overview

            17.1.9.2. Product Portfolio

            17.1.9.3. Profitability by Market Segments

            17.1.9.4. Sales Footprint

            17.1.9.5. Strategy Overview

                17.1.9.5.1. Marketing Strategy

                17.1.9.5.2. Product Strategy

                17.1.9.5.3. Channel Strategy

        17.1.10. Scottish Leather Group Limited

            17.1.10.1. Overview

            17.1.10.2. Product Portfolio

            17.1.10.3. Profitability by Market Segments

            17.1.10.4. Sales Footprint

            17.1.10.5. Strategy Overview

                17.1.10.5.1. Marketing Strategy

                17.1.10.5.2. Product Strategy

                17.1.10.5.3. Channel Strategy

18. Assumptions & Acronyms Used

19. Research Methodology

Don't pay for what you don't need

Customize your report by selecting specific countries or regions and save 30%!

List of Tables

Table 1: Global Market Value (US$ Million) Forecast by Region, 2018 to 2033

Table 2: Global Market Volume (Sq meters) Forecast by Region, 2018 to 2033

Table 3: Global Market Value (US$ Million) Forecast by Material, 2018 to 2033

Table 4: Global Market Volume (Sq meters) Forecast by Material, 2018 to 2033

Table 5: Global Market Value (US$ Million) Forecast by Vehicle Type, 2018 to 2033

Table 6: Global Market Volume (Sq meters) Forecast by Vehicle Type, 2018 to 2033

Table 7: Global Market Value (US$ Million) Forecast by Application, 2018 to 2033

Table 8: Global Market Volume (Sq meters) Forecast by Application, 2018 to 2033

Table 9: Global Market Value (US$ Million) Forecast by Sales Channel, 2018 to 2033

Table 10: Global Market Volume (Sq meters) Forecast by Sales Channel, 2018 to 2033

Table 11: North America Market Value (US$ Million) Forecast by Country, 2018 to 2033

Table 12: North America Market Volume (Sq meters) Forecast by Country, 2018 to 2033

Table 13: North America Market Value (US$ Million) Forecast by Material, 2018 to 2033

Table 14: North America Market Volume (Sq meters) Forecast by Material, 2018 to 2033

Table 15: North America Market Value (US$ Million) Forecast by Vehicle Type, 2018 to 2033

Table 16: North America Market Volume (Sq meters) Forecast by Vehicle Type, 2018 to 2033

Table 17: North America Market Value (US$ Million) Forecast by Application, 2018 to 2033

Table 18: North America Market Volume (Sq meters) Forecast by Application, 2018 to 2033

Table 19: North America Market Value (US$ Million) Forecast by Sales Channel, 2018 to 2033

Table 20: North America Market Volume (Sq meters) Forecast by Sales Channel, 2018 to 2033

Table 21: Latin America Market Value (US$ Million) Forecast by Country, 2018 to 2033

Table 22: Latin America Market Volume (Sq meters) Forecast by Country, 2018 to 2033

Table 23: Latin America Market Value (US$ Million) Forecast by Material, 2018 to 2033

Table 24: Latin America Market Volume (Sq meters) Forecast by Material, 2018 to 2033

Table 25: Latin America Market Value (US$ Million) Forecast by Vehicle Type, 2018 to 2033

Table 26: Latin America Market Volume (Sq meters) Forecast by Vehicle Type, 2018 to 2033

Table 27: Latin America Market Value (US$ Million) Forecast by Application, 2018 to 2033

Table 28: Latin America Market Volume (Sq meters) Forecast by Application, 2018 to 2033

Table 29: Latin America Market Value (US$ Million) Forecast by Sales Channel, 2018 to 2033

Table 30: Latin America Market Volume (Sq meters) Forecast by Sales Channel, 2018 to 2033

Table 31: Europe Market Value (US$ Million) Forecast by Country, 2018 to 2033

Table 32: Europe Market Volume (Sq meters) Forecast by Country, 2018 to 2033

Table 33: Europe Market Value (US$ Million) Forecast by Material, 2018 to 2033

Table 34: Europe Market Volume (Sq meters) Forecast by Material, 2018 to 2033

Table 35: Europe Market Value (US$ Million) Forecast by Vehicle Type, 2018 to 2033

Table 36: Europe Market Volume (Sq meters) Forecast by Vehicle Type, 2018 to 2033

Table 37: Europe Market Value (US$ Million) Forecast by Application, 2018 to 2033

Table 38: Europe Market Volume (Sq meters) Forecast by Application, 2018 to 2033

Table 39: Europe Market Value (US$ Million) Forecast by Sales Channel, 2018 to 2033

Table 40: Europe Market Volume (Sq meters) Forecast by Sales Channel, 2018 to 2033

Table 41: Asia Pacific Market Value (US$ Million) Forecast by Country, 2018 to 2033

Table 42: Asia Pacific Market Volume (Sq meters) Forecast by Country, 2018 to 2033

Table 43: Asia Pacific Market Value (US$ Million) Forecast by Material, 2018 to 2033

Table 44: Asia Pacific Market Volume (Sq meters) Forecast by Material, 2018 to 2033

Table 45: Asia Pacific Market Value (US$ Million) Forecast by Vehicle Type, 2018 to 2033

Table 46: Asia Pacific Market Volume (Sq meters) Forecast by Vehicle Type, 2018 to 2033

Table 47: Asia Pacific Market Value (US$ Million) Forecast by Application, 2018 to 2033

Table 48: Asia Pacific Market Volume (Sq meters) Forecast by Application, 2018 to 2033

Table 49: Asia Pacific Market Value (US$ Million) Forecast by Sales Channel, 2018 to 2033

Table 50: Asia Pacific Market Volume (Sq meters) Forecast by Sales Channel, 2018 to 2033

Table 51: MEA Market Value (US$ Million) Forecast by Country, 2018 to 2033

Table 52: MEA Market Volume (Sq meters) Forecast by Country, 2018 to 2033

Table 53: MEA Market Value (US$ Million) Forecast by Material, 2018 to 2033

Table 54: MEA Market Volume (Sq meters) Forecast by Material, 2018 to 2033

Table 55: MEA Market Value (US$ Million) Forecast by Vehicle Type, 2018 to 2033

Table 56: MEA Market Volume (Sq meters) Forecast by Vehicle Type, 2018 to 2033

Table 57: MEA Market Value (US$ Million) Forecast by Application, 2018 to 2033

Table 58: MEA Market Volume (Sq meters) Forecast by Application, 2018 to 2033

Table 59: MEA Market Value (US$ Million) Forecast by Sales Channel, 2018 to 2033

Table 60: MEA Market Volume (Sq meters) Forecast by Sales Channel, 2018 to 2033
Nikhil Kaitwade
Nikhil Kaitwade

Principal Consultant

Talk to Analyst

Find your sweet spots for generating winning opportunities in this market.

List of Charts

Figure 1: Global Market Value (US$ Million) by Material, 2023 to 2033

Figure 2: Global Market Value (US$ Million) by Vehicle Type, 2023 to 2033

Figure 3: Global Market Value (US$ Million) by Application, 2023 to 2033

Figure 4: Global Market Value (US$ Million) by Sales Channel, 2023 to 2033

Figure 5: Global Market Value (US$ Million) by Region, 2023 to 2033

Figure 6: Global Market Value (US$ Million) Analysis by Region, 2018 to 2033

Figure 7: Global Market Volume (Sq meters) Analysis by Region, 2018 to 2033

Figure 8: Global Market Value Share (%) and BPS Analysis by Region, 2023 to 2033

Figure 9: Global Market Y-o-Y Growth (%) Projections by Region, 2023 to 2033

Figure 10: Global Market Value (US$ Million) Analysis by Material, 2018 to 2033

Figure 11: Global Market Volume (Sq meters) Analysis by Material, 2018 to 2033

Figure 12: Global Market Value Share (%) and BPS Analysis by Material, 2023 to 2033

Figure 13: Global Market Y-o-Y Growth (%) Projections by Material, 2023 to 2033

Figure 14: Global Market Value (US$ Million) Analysis by Vehicle Type, 2018 to 2033

Figure 15: Global Market Volume (Sq meters) Analysis by Vehicle Type, 2018 to 2033

Figure 16: Global Market Value Share (%) and BPS Analysis by Vehicle Type, 2023 to 2033

Figure 17: Global Market Y-o-Y Growth (%) Projections by Vehicle Type, 2023 to 2033

Figure 18: Global Market Value (US$ Million) Analysis by Application, 2018 to 2033

Figure 19: Global Market Volume (Sq meters) Analysis by Application, 2018 to 2033

Figure 20: Global Market Value Share (%) and BPS Analysis by Application, 2023 to 2033

Figure 21: Global Market Y-o-Y Growth (%) Projections by Application, 2023 to 2033

Figure 22: Global Market Value (US$ Million) Analysis by Sales Channel, 2018 to 2033

Figure 23: Global Market Volume (Sq meters) Analysis by Sales Channel, 2018 to 2033

Figure 24: Global Market Value Share (%) and BPS Analysis by Sales Channel, 2023 to 2033

Figure 25: Global Market Y-o-Y Growth (%) Projections by Sales Channel, 2023 to 2033

Figure 26: Global Market Attractiveness by Material, 2023 to 2033

Figure 27: Global Market Attractiveness by Vehicle Type, 2023 to 2033

Figure 28: Global Market Attractiveness by Application, 2023 to 2033

Figure 29: Global Market Attractiveness by Sales Channel, 2023 to 2033

Figure 30: Global Market Attractiveness by Region, 2023 to 2033

Figure 31: North America Market Value (US$ Million) by Material, 2023 to 2033

Figure 32: North America Market Value (US$ Million) by Vehicle Type, 2023 to 2033

Figure 33: North America Market Value (US$ Million) by Application, 2023 to 2033

Figure 34: North America Market Value (US$ Million) by Sales Channel, 2023 to 2033

Figure 35: North America Market Value (US$ Million) by Country, 2023 to 2033

Figure 36: North America Market Value (US$ Million) Analysis by Country, 2018 to 2033

Figure 37: North America Market Volume (Sq meters) Analysis by Country, 2018 to 2033

Figure 38: North America Market Value Share (%) and BPS Analysis by Country, 2023 to 2033

Figure 39: North America Market Y-o-Y Growth (%) Projections by Country, 2023 to 2033

Figure 40: North America Market Value (US$ Million) Analysis by Material, 2018 to 2033

Figure 41: North America Market Volume (Sq meters) Analysis by Material, 2018 to 2033

Figure 42: North America Market Value Share (%) and BPS Analysis by Material, 2023 to 2033

Figure 43: North America Market Y-o-Y Growth (%) Projections by Material, 2023 to 2033

Figure 44: North America Market Value (US$ Million) Analysis by Vehicle Type, 2018 to 2033

Figure 45: North America Market Volume (Sq meters) Analysis by Vehicle Type, 2018 to 2033

Figure 46: North America Market Value Share (%) and BPS Analysis by Vehicle Type, 2023 to 2033

Figure 47: North America Market Y-o-Y Growth (%) Projections by Vehicle Type, 2023 to 2033

Figure 48: North America Market Value (US$ Million) Analysis by Application, 2018 to 2033

Figure 49: North America Market Volume (Sq meters) Analysis by Application, 2018 to 2033

Figure 50: North America Market Value Share (%) and BPS Analysis by Application, 2023 to 2033

Figure 51: North America Market Y-o-Y Growth (%) Projections by Application, 2023 to 2033

Figure 52: North America Market Value (US$ Million) Analysis by Sales Channel, 2018 to 2033

Figure 53: North America Market Volume (Sq meters) Analysis by Sales Channel, 2018 to 2033

Figure 54: North America Market Value Share (%) and BPS Analysis by Sales Channel, 2023 to 2033

Figure 55: North America Market Y-o-Y Growth (%) Projections by Sales Channel, 2023 to 2033

Figure 56: North America Market Attractiveness by Material, 2023 to 2033

Figure 57: North America Market Attractiveness by Vehicle Type, 2023 to 2033

Figure 58: North America Market Attractiveness by Application, 2023 to 2033

Figure 59: North America Market Attractiveness by Sales Channel, 2023 to 2033

Figure 60: North America Market Attractiveness by Country, 2023 to 2033

Figure 61: Latin America Market Value (US$ Million) by Material, 2023 to 2033

Figure 62: Latin America Market Value (US$ Million) by Vehicle Type, 2023 to 2033

Figure 63: Latin America Market Value (US$ Million) by Application, 2023 to 2033

Figure 64: Latin America Market Value (US$ Million) by Sales Channel, 2023 to 2033

Figure 65: Latin America Market Value (US$ Million) by Country, 2023 to 2033

Figure 66: Latin America Market Value (US$ Million) Analysis by Country, 2018 to 2033

Figure 67: Latin America Market Volume (Sq meters) Analysis by Country, 2018 to 2033

Figure 68: Latin America Market Value Share (%) and BPS Analysis by Country, 2023 to 2033

Figure 69: Latin America Market Y-o-Y Growth (%) Projections by Country, 2023 to 2033

Figure 70: Latin America Market Value (US$ Million) Analysis by Material, 2018 to 2033

Figure 71: Latin America Market Volume (Sq meters) Analysis by Material, 2018 to 2033

Figure 72: Latin America Market Value Share (%) and BPS Analysis by Material, 2023 to 2033

Figure 73: Latin America Market Y-o-Y Growth (%) Projections by Material, 2023 to 2033

Figure 74: Latin America Market Value (US$ Million) Analysis by Vehicle Type, 2018 to 2033

Figure 75: Latin America Market Volume (Sq meters) Analysis by Vehicle Type, 2018 to 2033

Figure 76: Latin America Market Value Share (%) and BPS Analysis by Vehicle Type, 2023 to 2033

Figure 77: Latin America Market Y-o-Y Growth (%) Projections by Vehicle Type, 2023 to 2033

Figure 78: Latin America Market Value (US$ Million) Analysis by Application, 2018 to 2033

Figure 79: Latin America Market Volume (Sq meters) Analysis by Application, 2018 to 2033

Figure 80: Latin America Market Value Share (%) and BPS Analysis by Application, 2023 to 2033

Figure 81: Latin America Market Y-o-Y Growth (%) Projections by Application, 2023 to 2033

Figure 82: Latin America Market Value (US$ Million) Analysis by Sales Channel, 2018 to 2033

Figure 83: Latin America Market Volume (Sq meters) Analysis by Sales Channel, 2018 to 2033

Figure 84: Latin America Market Value Share (%) and BPS Analysis by Sales Channel, 2023 to 2033

Figure 85: Latin America Market Y-o-Y Growth (%) Projections by Sales Channel, 2023 to 2033

Figure 86: Latin America Market Attractiveness by Material, 2023 to 2033

Figure 87: Latin America Market Attractiveness by Vehicle Type, 2023 to 2033

Figure 88: Latin America Market Attractiveness by Application, 2023 to 2033

Figure 89: Latin America Market Attractiveness by Sales Channel, 2023 to 2033

Figure 90: Latin America Market Attractiveness by Country, 2023 to 2033

Figure 91: Europe Market Value (US$ Million) by Material, 2023 to 2033

Figure 92: Europe Market Value (US$ Million) by Vehicle Type, 2023 to 2033

Figure 93: Europe Market Value (US$ Million) by Application, 2023 to 2033

Figure 94: Europe Market Value (US$ Million) by Sales Channel, 2023 to 2033

Figure 95: Europe Market Value (US$ Million) by Country, 2023 to 2033

Figure 96: Europe Market Value (US$ Million) Analysis by Country, 2018 to 2033

Figure 97: Europe Market Volume (Sq meters) Analysis by Country, 2018 to 2033

Figure 98: Europe Market Value Share (%) and BPS Analysis by Country, 2023 to 2033

Figure 99: Europe Market Y-o-Y Growth (%) Projections by Country, 2023 to 2033

Figure 100: Europe Market Value (US$ Million) Analysis by Material, 2018 to 2033

Figure 101: Europe Market Volume (Sq meters) Analysis by Material, 2018 to 2033

Figure 102: Europe Market Value Share (%) and BPS Analysis by Material, 2023 to 2033

Figure 103: Europe Market Y-o-Y Growth (%) Projections by Material, 2023 to 2033

Figure 104: Europe Market Value (US$ Million) Analysis by Vehicle Type, 2018 to 2033

Figure 105: Europe Market Volume (Sq meters) Analysis by Vehicle Type, 2018 to 2033

Figure 106: Europe Market Value Share (%) and BPS Analysis by Vehicle Type, 2023 to 2033

Figure 107: Europe Market Y-o-Y Growth (%) Projections by Vehicle Type, 2023 to 2033

Figure 108: Europe Market Value (US$ Million) Analysis by Application, 2018 to 2033

Figure 109: Europe Market Volume (Sq meters) Analysis by Application, 2018 to 2033

Figure 110: Europe Market Value Share (%) and BPS Analysis by Application, 2023 to 2033

Figure 111: Europe Market Y-o-Y Growth (%) Projections by Application, 2023 to 2033

Figure 112: Europe Market Value (US$ Million) Analysis by Sales Channel, 2018 to 2033

Figure 113: Europe Market Volume (Sq meters) Analysis by Sales Channel, 2018 to 2033

Figure 114: Europe Market Value Share (%) and BPS Analysis by Sales Channel, 2023 to 2033

Figure 115: Europe Market Y-o-Y Growth (%) Projections by Sales Channel, 2023 to 2033

Figure 116: Europe Market Attractiveness by Material, 2023 to 2033

Figure 117: Europe Market Attractiveness by Vehicle Type, 2023 to 2033

Figure 118: Europe Market Attractiveness by Application, 2023 to 2033

Figure 119: Europe Market Attractiveness by Sales Channel, 2023 to 2033

Figure 120: Europe Market Attractiveness by Country, 2023 to 2033

Figure 121: Asia Pacific Market Value (US$ Million) by Material, 2023 to 2033

Figure 122: Asia Pacific Market Value (US$ Million) by Vehicle Type, 2023 to 2033

Figure 123: Asia Pacific Market Value (US$ Million) by Application, 2023 to 2033

Figure 124: Asia Pacific Market Value (US$ Million) by Sales Channel, 2023 to 2033

Figure 125: Asia Pacific Market Value (US$ Million) by Country, 2023 to 2033

Figure 126: Asia Pacific Market Value (US$ Million) Analysis by Country, 2018 to 2033

Figure 127: Asia Pacific Market Volume (Sq meters) Analysis by Country, 2018 to 2033

Figure 128: Asia Pacific Market Value Share (%) and BPS Analysis by Country, 2023 to 2033

Figure 129: Asia Pacific Market Y-o-Y Growth (%) Projections by Country, 2023 to 2033

Figure 130: Asia Pacific Market Value (US$ Million) Analysis by Material, 2018 to 2033

Figure 131: Asia Pacific Market Volume (Sq meters) Analysis by Material, 2018 to 2033

Figure 132: Asia Pacific Market Value Share (%) and BPS Analysis by Material, 2023 to 2033

Figure 133: Asia Pacific Market Y-o-Y Growth (%) Projections by Material, 2023 to 2033

Figure 134: Asia Pacific Market Value (US$ Million) Analysis by Vehicle Type, 2018 to 2033

Figure 135: Asia Pacific Market Volume (Sq meters) Analysis by Vehicle Type, 2018 to 2033

Figure 136: Asia Pacific Market Value Share (%) and BPS Analysis by Vehicle Type, 2023 to 2033

Figure 137: Asia Pacific Market Y-o-Y Growth (%) Projections by Vehicle Type, 2023 to 2033

Figure 138: Asia Pacific Market Value (US$ Million) Analysis by Application, 2018 to 2033

Figure 139: Asia Pacific Market Volume (Sq meters) Analysis by Application, 2018 to 2033

Figure 140: Asia Pacific Market Value Share (%) and BPS Analysis by Application, 2023 to 2033

Figure 141: Asia Pacific Market Y-o-Y Growth (%) Projections by Application, 2023 to 2033

Figure 142: Asia Pacific Market Value (US$ Million) Analysis by Sales Channel, 2018 to 2033

Figure 143: Asia Pacific Market Volume (Sq meters) Analysis by Sales Channel, 2018 to 2033

Figure 144: Asia Pacific Market Value Share (%) and BPS Analysis by Sales Channel, 2023 to 2033

Figure 145: Asia Pacific Market Y-o-Y Growth (%) Projections by Sales Channel, 2023 to 2033

Figure 146: Asia Pacific Market Attractiveness by Material, 2023 to 2033

Figure 147: Asia Pacific Market Attractiveness by Vehicle Type, 2023 to 2033

Figure 148: Asia Pacific Market Attractiveness by Application, 2023 to 2033

Figure 149: Asia Pacific Market Attractiveness by Sales Channel, 2023 to 2033

Figure 150: Asia Pacific Market Attractiveness by Country, 2023 to 2033

Figure 151: MEA Market Value (US$ Million) by Material, 2023 to 2033

Figure 152: MEA Market Value (US$ Million) by Vehicle Type, 2023 to 2033

Figure 153: MEA Market Value (US$ Million) by Application, 2023 to 2033

Figure 154: MEA Market Value (US$ Million) by Sales Channel, 2023 to 2033

Figure 155: MEA Market Value (US$ Million) by Country, 2023 to 2033

Figure 156: MEA Market Value (US$ Million) Analysis by Country, 2018 to 2033

Figure 157: MEA Market Volume (Sq meters) Analysis by Country, 2018 to 2033

Figure 158: MEA Market Value Share (%) and BPS Analysis by Country, 2023 to 2033

Figure 159: MEA Market Y-o-Y Growth (%) Projections by Country, 2023 to 2033

Figure 160: MEA Market Value (US$ Million) Analysis by Material, 2018 to 2033

Figure 161: MEA Market Volume (Sq meters) Analysis by Material, 2018 to 2033

Figure 162: MEA Market Value Share (%) and BPS Analysis by Material, 2023 to 2033

Figure 163: MEA Market Y-o-Y Growth (%) Projections by Material, 2023 to 2033

Figure 164: MEA Market Value (US$ Million) Analysis by Vehicle Type, 2018 to 2033

Figure 165: MEA Market Volume (Sq meters) Analysis by Vehicle Type, 2018 to 2033

Figure 166: MEA Market Value Share (%) and BPS Analysis by Vehicle Type, 2023 to 2033

Figure 167: MEA Market Y-o-Y Growth (%) Projections by Vehicle Type, 2023 to 2033

Figure 168: MEA Market Value (US$ Million) Analysis by Application, 2018 to 2033

Figure 169: MEA Market Volume (Sq meters) Analysis by Application, 2018 to 2033

Figure 170: MEA Market Value Share (%) and BPS Analysis by Application, 2023 to 2033

Figure 171: MEA Market Y-o-Y Growth (%) Projections by Application, 2023 to 2033

Figure 172: MEA Market Value (US$ Million) Analysis by Sales Channel, 2018 to 2033

Figure 173: MEA Market Volume (Sq meters) Analysis by Sales Channel, 2018 to 2033

Figure 174: MEA Market Value Share (%) and BPS Analysis by Sales Channel, 2023 to 2033

Figure 175: MEA Market Y-o-Y Growth (%) Projections by Sales Channel, 2023 to 2033

Figure 176: MEA Market Attractiveness by Material, 2023 to 2033

Figure 177: MEA Market Attractiveness by Vehicle Type, 2023 to 2033

Figure 178: MEA Market Attractiveness by Application, 2023 to 2033

Figure 179: MEA Market Attractiveness by Sales Channel, 2023 to 2033

Figure 180: MEA Market Attractiveness by Country, 2023 to 2033

Recommendations

Explore Automotive Insights

View Reports

Automotive Interior Leather Market