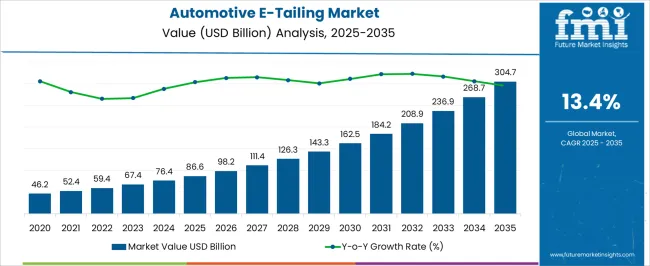
The Automotive E-Tailing Market is estimated to be valued at USD 86.6 billion in 2025 and is projected to reach USD 304.7 billion by 2035, registering a compound annual growth rate (CAGR) of 13.4% over the forecast period.
The automotive e-tailing market is witnessing robust expansion driven by the digitalization of retail channels and the increasing preference for online purchases of automotive components and accessories. Growing internet penetration, enhanced logistics networks, and competitive online pricing have collectively fueled market adoption.
Consumers are increasingly relying on e-commerce platforms for convenience, transparency, and access to a broader product range, especially in replacement and aftermarket parts. OEMs and third-party vendors are leveraging digital marketplaces to improve reach and customer engagement through real-time inventory visibility and faster delivery models.
The current scenario reflects rising online penetration across both developed and emerging economies, with continued investment in secure payment systems and AI-based product recommendations. Future growth will be underpinned by increasing vehicle ownership, expanding aftermarket demand, and the integration of virtual fitting tools enhancing the online shopping experience.
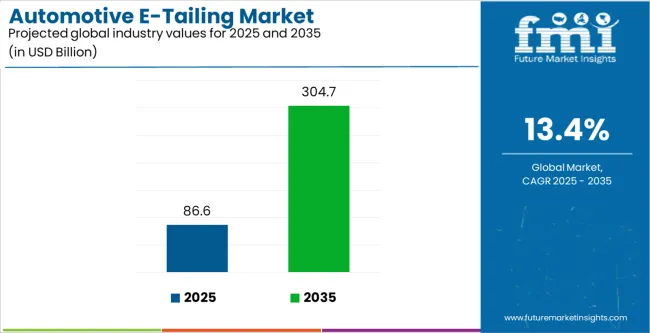
| Metric | Value |
|---|---|
| Automotive E-Tailing Market Estimated Value in (2025 E) | USD 86.6 billion |
| Automotive E-Tailing Market Forecast Value in (2035 F) | USD 304.7 billion |
| Forecast CAGR (2025 to 2035) | 13.4% |
The market is segmented by Vehicle Type, Components, Vendor, and Product Label and region. By Vehicle Type, the market is divided into Passenger Cars, Commercial Vehicles, and Two-Wheeler. In terms of Components, the market is classified into Interior Accessories, Infotainment, Engine Components, Tires, and Electrical Products. Based on Vendor, the market is segmented into OEM Vendor and Third-Party Vendor. By Product Label, the market is divided into Branded and Counterfeit. Regionally, the market is classified into North America, Latin America, Western Europe, Eastern Europe, Balkan & Baltic Countries, Russia & Belarus, Central Asia, East Asia, South Asia & Pacific, and the Middle East & Africa.
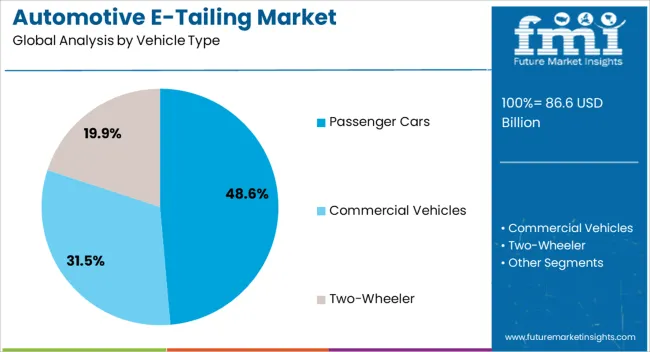
The passenger cars segment holds approximately 48.60% share of the vehicle type category in the automotive e-tailing market. This dominance is attributed to the extensive global passenger car fleet and the growing consumer inclination toward personalized and performance-enhancing vehicle parts.
Passenger car owners exhibit higher online purchasing activity, driven by the need for aesthetic upgrades, regular maintenance, and interior customization. The proliferation of e-commerce platforms offering model-specific compatibility tools has streamlined the purchasing process.
Additionally, increasing adoption of digital payment options and efficient home delivery services has reinforced the segment’s leadership. With rising vehicle replacement rates and technological upgrades enhancing online user experience, the passenger cars segment is expected to continue driving significant revenue within the market.
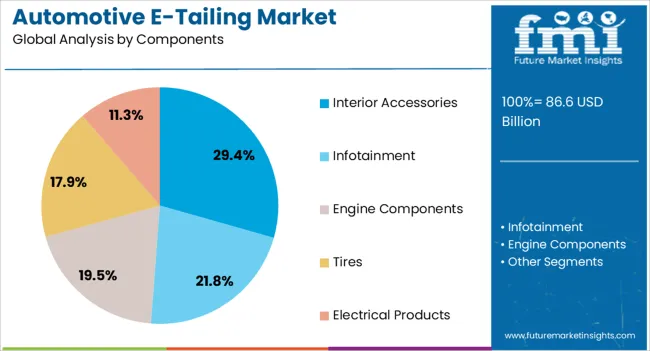
The interior accessories segment leads the components category, accounting for approximately 29.40% share. Growth is propelled by consumer demand for comfort-oriented and aesthetic enhancements such as seat covers, infotainment systems, and ambient lighting.
The availability of diverse options through online platforms, along with virtual visualization tools, has made e-tailing an appealing channel for accessory purchases. Manufacturers and third-party sellers are capitalizing on customization trends and seasonal promotions to drive online sales.
The convenience of product comparison, bundled offers, and doorstep delivery has further supported market expansion. As automotive interiors evolve with advanced infotainment integration and premium aesthetics, the interior accessories segment is expected to sustain its dominant position.
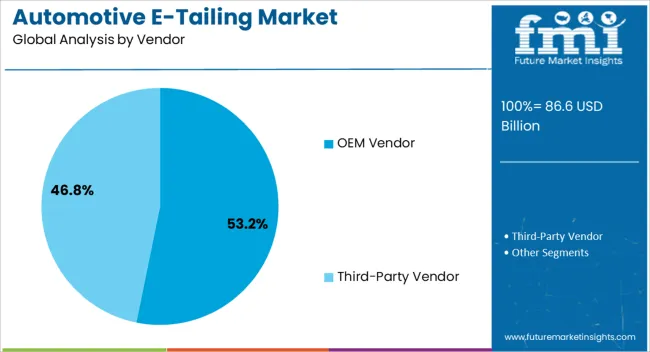
The OEM vendor segment captures approximately 53.20% share in the vendor category, driven by consumer preference for authenticity, quality assurance, and warranty-backed components. Original equipment manufacturers have increasingly invested in direct-to-consumer digital platforms to enhance accessibility and build trust.
The segment benefits from strong brand recognition and established logistics frameworks that ensure faster delivery and consistent product standards. OEMs are also expanding their e-tailing presence through partnerships with online marketplaces and authorized resellers.
With rising awareness regarding counterfeit risks in aftermarket components, consumers are gravitating toward OEM-certified sources. The segment is expected to maintain its leadership as digital transformation accelerates across the automotive retail ecosystem.
From 2020 to 2025, the automotive e-tailing market experienced a CAGR of 16.9%. The rise of mobile devices has led to increased mobile commerce, enabling consumers to shop for automotive products using smartphones and tablets.
Innovative payment options, subscription services, and a focus on aftermarket support contribute to the overall evolution of the automotive e-tailing landscape. The market continues to expand globally, reaching customers in various regions.
The integration of social commerce elements allows users to discover and purchase automotive products directly through social media platforms. Projections indicate that the global automotive e-tailing market is expected to experience a CAGR of 13.4% from 2025 to 2035.
| Historical CAGR from 2020 to 2025 | 16.9% |
|---|---|
| Forecasted CAGR from 2025 to 2035 | 13.4% |
The below table shows the estimated growth rates of the top countries. South Korea and Japan are set to record higher CAGRs of 15.6 and 14.9%, respectively, through 2035.
The inclination towards technology among Japanese consumers enables the seamless adoption of innovative technologies in the e-tailing landscape. Trust in the security of online transactions and reliable delivery services contribute to the growth of the automotive e-tailing market in South Korea
| Countries | Forecast CAGRs from 2025 to 2035 |
|---|---|
| The United States | 13.7% |
| The United Kingdom | 14.7% |
| China | 13.9% |
| Japan | 14.9% |
| South Korea | 15.6% |
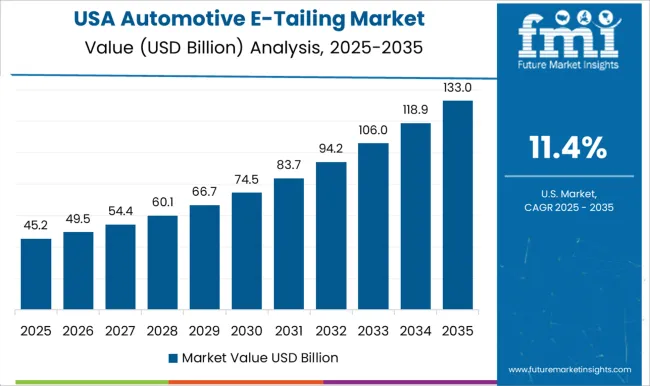
The automotive e-tailing market in the United States is expected to grow with a CAGR of 13.7% from 2025 to 2035. The ongoing digital transformation has reshaped consumer behavior, with a growing number of people in the United States preferring online channels for shopping, including automotive products.
E-tailers in the United States offer a wide range of automotive products, including replacement parts, performance parts, accessories, and maintenance items. This extensive product range caters to the diverse needs of vehicle owners, driving the market growth in the country.
The automotive e-tailing market in the United Kingdom is expected to grow with a CAGR of 14.7% from 2025 to 2035. The widespread availability of the internet and the growing number of online users contribute to the expansion of e-commerce, including automotive e-tailing.
The convenience of shopping online for automotive products, including parts, accessories, and tools, appeals to consumers in the United Kingdom. Online platforms provide a convenient way to browse, compare, and purchase automotive items.
The automotive e-tailing market in China is expected to grow with a CAGR of 13.9% from 2025 to 2035. China has undergone a rapid process of digitalization, enabling a significant portion of the population to connect to the internet. This surge in internet accessibility has played a pivotal role in fostering the expansion of online retail, particularly within the automotive e-tailing sector.
The growing middle-class population in China has led to increased vehicle ownership. As more people own cars, there is a higher demand for automotive products, and consumers often turn to online platforms for convenient shopping.
Major e-commerce players in China, such as Alibaba Group (including platforms like Taobao and Tmall) and JD.com, have played a significant role in driving the growth of the automotive e-tailing market. These platforms provide a vast marketplace for various automotive products.
Government initiatives and policies supporting e-commerce and digitalization in China have created a favorable environment for the growth of the automotive e-tailing market.
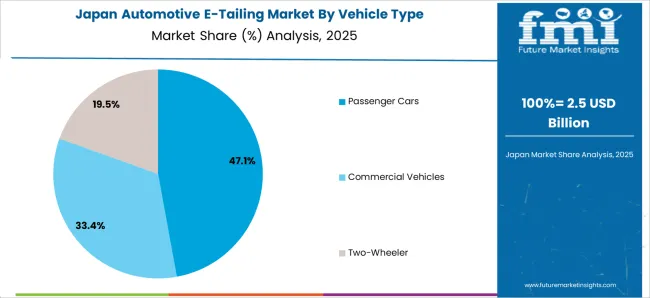
The automotive e-tailing market in Japan is expected to grow with a CAGR of 14.9% from 2025 to 2035. Japan has a tech-savvy population, and there has been a widespread adoption of digital technologies. The increased use of smartphones and internet-connected devices has fueled the growth of e-commerce, including automotive e-tailing.
The ability to browse, compare, and purchase automotive products from the comfort of their homes has contributed to the growth of the e-tailing market in the country. Major e-commerce platforms in Japan, such as Rakuten and Amazon Japan, have played a significant role in driving the automotive e-tailing market.
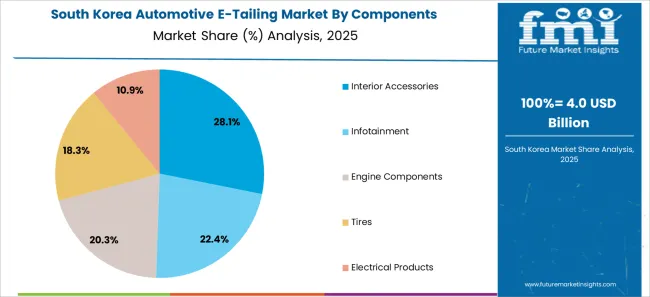
The automotive e-tailing market in Japan is expected to grow with a CAGR of 15.6% from 2025 to 2035. The tech-savvy culture in South Korea supports the adoption of online shopping platforms, contributing to the growth of e-tailing.
Supportive government policies and initiatives that encourage e-commerce and digitalization contribute to a favorable environment for the growth of the automotive e-tailing market in South Korea. An increasing awareness of environmental issues may lead to a demand for eco-friendly automotive products, and consumers can find such products through e-tailing platforms.
The below section shows the leading segment. The passenger vehicle segment is anticipated to register a CAGR of 13.2% from 2025 to 2035. Based on vendor, the OEM Vendor segment is anticipated to hold a dominant share through 2035. It is set to exhibit a CAGR of 13.0% from 2025 to 2035.
| Category | CAGR from 2025 to 2035 |
|---|---|
| Passenger Vehicle | 13.2% |
| OEM Vendor | 13.0% |
Based on vehicle type, the passenger vehicle segment is anticipated to register a CAGR of 13.2% from 2025 to 2035. Passenger vehicles, including cars and SUVs, are among the most commonly purchased and sought-after vehicles by consumers. Online platforms cater to the preferences of a broad consumer base, and the demand for passenger vehicles reflects the popularity of these vehicles in the overall automotive market.
The online purchase of passenger vehicles has become more accessible and convenient. E-tailers provide comprehensive information about various car models, features, specifications, and pricing. Consumers can easily compare different options and make informed decisions from the comfort of their homes.
Many e-tailing platforms offer tools that allow consumers to configure and customize their desired passenger vehicle. This level of personalization is attractive to buyers who want a vehicle that meets their specific requirements and preferences.
Based on vendor, the OEM vendor segment is anticipated to grow at a CAGR of 13.0% from 2025 to 2035. OEMs are often associated with trust and brand recognition. Consumers tend to trust products directly from the original manufacturer, as they are perceived to meet quality standards and specifications. This trust factor is valuable in the online marketplace.
OEM vendors supply genuine and authentic automotive parts that are designed to meet the original specifications of the vehicle. This assurance of quality and compatibility is crucial for consumers, particularly when purchasing critical components for their vehicles.
OEMs have in-depth knowledge of the products they manufacture. This expertise allows them to provide detailed product information, compatibility details, and expert advice to consumers, enhancing the online shopping experience.
OEM vendors often offer a wide range of products, including replacement parts, accessories, and maintenance items. This comprehensive product range caters to the various needs of vehicle owners, contributing to the overall appeal of OEMs in the e-tailing market.
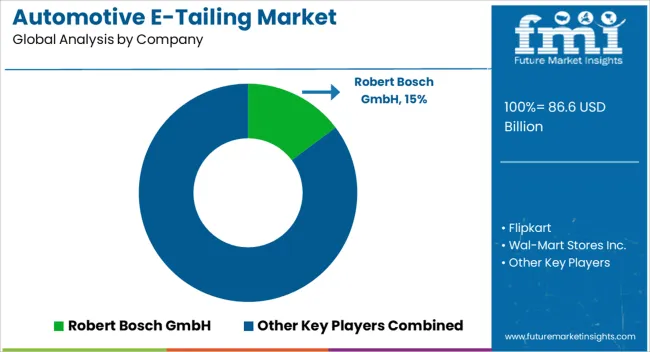
The market players in the automotive e-tailing market are collaborating with OEMs, aftermarket suppliers, and other industry players to expand product offerings and ensure a diverse inventory. Forming partnerships with logistics companies for efficient supply chain management and timely deliveries.
The players are offering an extensive and diverse product catalog, including a wide range of automotive parts, accessories, and tools.
| Attributes | Details |
|---|---|
| Estimated Market Size in 2025 | USD 76.4 billion |
| Projected Market Valuation in 2035 | USD 268 billion |
| Value-based CAGR 2025 to 2035 | 13.4% |
| Forecast Period | 2025 to 2035 |
| Historical Data Available for | 2020 to 2025 |
| Market Analysis | Value in USD billion |
| Key Regions Covered | North America; Latin America; Western Europe; Eastern Europe; South Asia and Pacific; East Asia; Middle East and Africa |
| Key Market Segments Covered | Vehicle Type, Component, Vendor, Product Label, Region |
| Key Countries Profiled | The United States, Canada, Brazil, Mexico, Germany, The United Kingdom, France, Spain, Italy, Russia, Poland, Czech Republic, Romania, India, Bangladesh, Australia, New Zealand, China, Japan, South Korea, GCC countries, South Africa, Israel |
| Key Companies Profiled | Flipkart; Wal-Mart Stores Inc.; O’ Reilly Automotive Inc.; Robert Bosch GmbH; E-bay Inc.; Continental AG; Delticom AG; Alibaba Group Holding Ltd; AutoZone Inc.; Advance Auto Parts Inc. |
The global automotive e-tailing market is estimated to be valued at USD 86.6 billion in 2025.
The market size for the automotive e-tailing market is projected to reach USD 304.7 billion by 2035.
The automotive e-tailing market is expected to grow at a 13.4% CAGR between 2025 and 2035.
The key product types in automotive e-tailing market are passenger cars, commercial vehicles and two-wheeler.
In terms of components, interior accessories segment to command 29.4% share in the automotive e-tailing market in 2025.


Full Research Suite comprises of:
Market outlook & trends analysis
Interviews & case studies
Strategic recommendations
Vendor profiles & capabilities analysis
5-year forecasts
8 regions and 60+ country-level data splits
Market segment data splits
12 months of continuous data updates
DELIVERED AS:
PDF EXCEL ONLINE
Automotive Performance Part Market Size and Share Forecast Outlook 2025 to 2035
Automotive Carbon Ceramic Brake Market Size and Share Forecast Outlook 2025 to 2035
Automotive Camshaft Market Size and Share Forecast Outlook 2025 to 2035
Automotive Stamping Industry Analysis in India Size and Share Forecast Outlook 2025 to 2035
Automotive Cylinder Liner Market Size and Share Forecast Outlook 2025 to 2035
Automotive Microcontroller Market Size and Share Forecast Outlook 2025 to 2035
Automotive Roof Rails Market Size and Share Forecast Outlook 2025 to 2035
Automotive Active Safety System Market Size and Share Forecast Outlook 2025 to 2035
Automotive Diagnostic Scan Tool Market Size and Share Forecast Outlook 2025 to 2035
Automotive Test Equipment Market Size and Share Forecast Outlook 2025 to 2035
Automotive Dynamic Map Data Market Size and Share Forecast Outlook 2025 to 2035
Automotive Green Tires Market Size and Share Forecast Outlook 2025 to 2035
Automotive Interior Market Forecast Outlook 2025 to 2035
Automotive Key Market Size and Share Forecast Outlook 2025 to 2035
Automotive Appearance Chemical Market Forecast and Outlook 2025 to 2035
Automotive Seating Market Forecast and Outlook 2025 to 2035
Automotive Domain Control Module Market Forecast and Outlook 2025 to 2035
Automotive Remote Diagnostic Market Forecast and Outlook 2025 to 2035
Automotive-grade Inertial Navigation System Market Size and Share Forecast Outlook 2025 to 2035
Automotive Thin IGBT Module Market Size and Share Forecast Outlook 2025 to 2035

Thank you!
You will receive an email from our Business Development Manager. Please be sure to check your SPAM/JUNK folder too.
Chat With
MaRIA