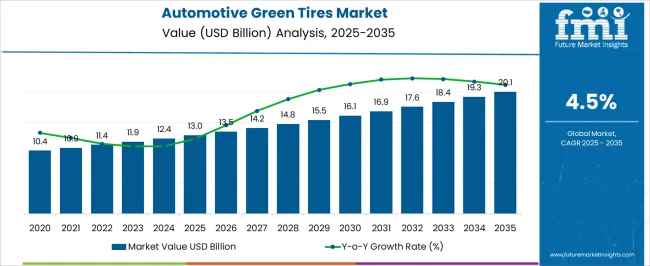
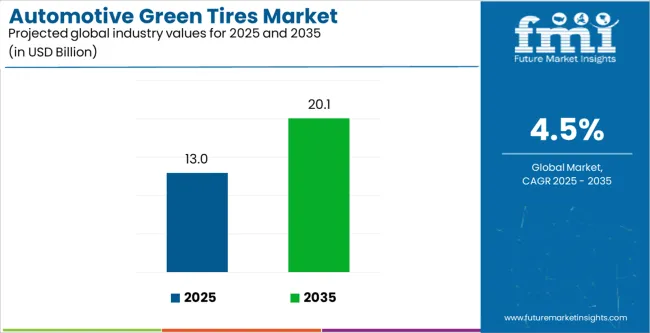
The Automotive Green Tires Market is estimated to be valued at USD 13.0 billion in 2025 and is projected to reach USD 20.1 billion by 2035, registering a compound annual growth rate (CAGR) of 4.5% over the forecast period.
The automotive green tires market is growing steadily as sustainability becomes a central theme in the automotive industry. Green tires, designed to reduce rolling resistance and improve fuel efficiency, are gaining traction among both OEMs and consumers. The use of advanced materials such as silica-reinforced compounds and bio-based rubber enhances durability while lowering carbon emissions.
Stricter environmental regulations and the shift toward electric and hybrid vehicles have accelerated market adoption. OEMs are increasingly integrating green tires as standard equipment to meet efficiency targets and brand sustainability commitments.
The aftermarket segment is also experiencing rising demand from environmentally conscious consumers seeking improved fuel economy. With continuous technological advancements and global sustainability mandates, the market is projected to expand at a significant pace in the coming years.
| Metric | Value |
|---|---|
| Automotive Green Tires Market Estimated Value in (2025 E) | USD 13.0 billion |
| Automotive Green Tires Market Forecast Value in (2035 F) | USD 20.1 billion |
| Forecast CAGR (2025 to 2035) | 4.5% |
The market is segmented by Vehicle Type and End User and region. By Vehicle Type, the market is divided into Passenger Vehicles and Commercial Vehicles. In terms of End User, the market is classified into OEM and Aftermarket. Regionally, the market is classified into North America, Latin America, Western Europe, Eastern Europe, Balkan & Baltic Countries, Russia & Belarus, Central Asia, East Asia, South Asia & Pacific, and the Middle East & Africa.
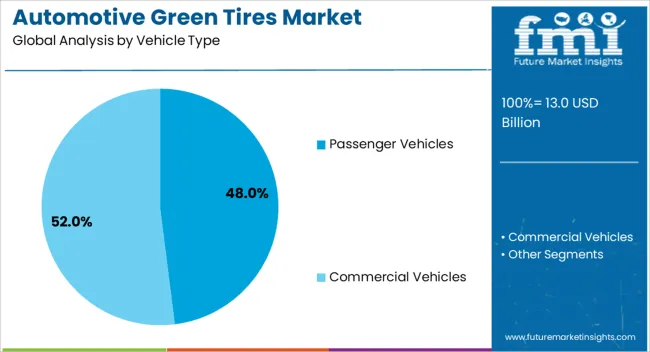
The passenger vehicles segment accounts for approximately 48.00% share in the vehicle type category, driven by the widespread adoption of green tires across compact, sedan, and SUV models. Rising consumer awareness of fuel efficiency benefits and reduced CO₂ emissions has strengthened demand.
OEMs are actively promoting green tire technologies as part of their sustainability portfolios, enhancing adoption at the production level. The segment benefits from continuous improvements in tread design and compound formulation, which extend tire life while minimizing resistance.
With increasing focus on eco-friendly mobility and stringent emission standards, the passenger vehicles segment is expected to maintain its market dominance.
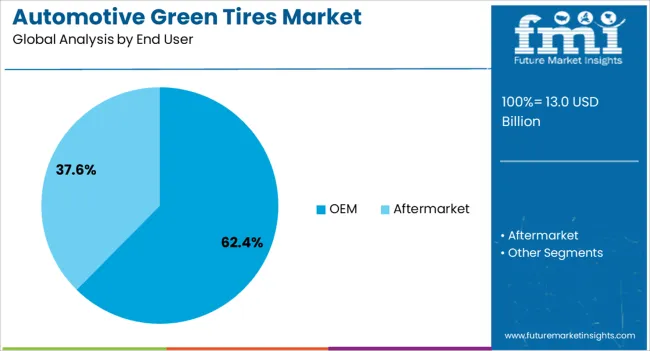
The OEM segment leads the end user category, contributing approximately 62.40% share of the automotive green tires market. This dominance is supported by OEM initiatives to comply with global emission norms and improve overall vehicle efficiency.
Automakers are increasingly collaborating with tire manufacturers to co-develop products optimized for specific vehicle platforms. Integration of green tires during manufacturing ensures compliance with regulatory requirements and enhances brand positioning for sustainability.
The segment’s strength also lies in long-term supply agreements and technological standardization, facilitating consistent quality. As OEMs expand their portfolio of electric and hybrid vehicles, the demand for green tires at the production stage is expected to remain strong.
The demand for the automotive green tires market was estimated to reach a valuation of USD 10.4 billion in 2020, according to a report from Future Market Insights. From 2020 to 2025, sales witnessed significant growth in the automotive green tires market, registering a CAGR of 8.9%.
| Historical CAGR from 2020 to 2025 | 8.9% |
|---|---|
| Forecast CAGR from 2025 to 2035 | 4.5% |
The market for automotive green tires is driven by technological developments in tire production, such as the development of innovative materials and manufacturing techniques. These advances will fuel market expansion by making it possible to produce tires with better performance attributes including decreased rolling resistance, increased durability, and greater sustainability.
Some important factors that will boost the market growth through 2035 are:
Consumer Inclination towards Eco Friendly and Fuel Efficient Vehicles to Bolster Sales
The growing customer desire for environmentally friendly and fuel-efficient cars is a major factor propelling the market for automotive green tires. Customers are actively looking for environmentally friendly transportation solutions that reduce their carbon impact as environmental awareness rises.
Green tires suit these desires because they are recognized for their capacity to improve fuel economy and lower emissions. The market for automobile green tires is expanding as a result of automakers incorporating green tire technology into their lineup of vehicles to satisfy consumer demand for eco-friendly options.
Increasing Focus on Environmental Sustainability to Bolster demand globally
The growing emphasis on environmental sustainability and the need to minimize carbon emissions are key drivers of the automotive green tire market. As global concerns about climate change rise, countries throughout the world are enacting more stringent laws designed to lower car emissions.
This encourages both customers and automakers to look for environmentally friendly options, including green tires, which provide better fuel economy and less rolling resistance while also supporting market expansion and sustainability objectives.
Supply Chain Disruptions to Stifle the Market Growth
The market for automotive green tires is being hindered by supply chain interruptions brought on by things like labor shortages, delays in shipping, and shortages of raw materials. These issues cause delays in production and higher expenses because they interfere with manufacturing procedures.
Trade tensions and uncertainty surrounding the state of the world economy intensify market issues and impede the smooth growth and development of the automobile green tire sector.
This section focuses on providing detailed analysis of two particular market segments for automotive green tires, the dominant vehicle type and the significant end user. The two main segments discussed below are passenger vehicles and OEM.
| Vehicle Type | Passenger Vehicle |
|---|---|
| CAGR from 2025 to 2035 | 7% |
During the forecast period, the passenger vehicle segment is likely to garner a 7% CAGR. Green tires are expected to be widely used in passenger vehicles for a number of important reasons.
Green tires, which minimize environmental effect and reduce carbon emissions, are in high demand as a result of the increased consumer awareness of environmental issues and their desire to choose eco-friendly options. Green tires also provide improved fuel efficiency, which saves drivers money over time.
In order to comply with strict emissions regulations and fulfill customer expectations for environmentally friendly transportation options, manufacturers of automobiles are compelled by governmental pressures to emphasize sustainability, which has resulted in the widespread incorporation of green tire technology.
| End User | OEM |
|---|---|
| Market Share in 2025 | 51.2% |
In 2025, the OEM segment is likely to acquire a 51.2% global market share. Green tires are expected to be widely used in the OEM (Original Equipment Manufacturer) sector for a variety of reasons. In order to comply with environmental requirements, manufacturers are compelled by strict emissions restrictions to integrate eco-friendly parts, such as tires, into their vehicles.
OEMs aim to conform to customer preferences while acknowledging the market demand for sustainable goods. Green tires support the objectives of OEMs for increased performance and sustainability by providing noticeable advantages like less carbon footprint and increased fuel economy.
The markets for automotive green tires in a few significant countries, including the United States, the United Kingdom, China, Japan, and South Korea, will be covered in detail in this section. The section will focus on the significant factors driving up demand for automotive green tires in these countries.
| Countries | CAGR |
|---|---|
| The United States | 7.5% |
| The United Kingdom | 8.3% |
| China | 7.8% |
| Japan | 8.8% |
| South Korea | 9.3% |
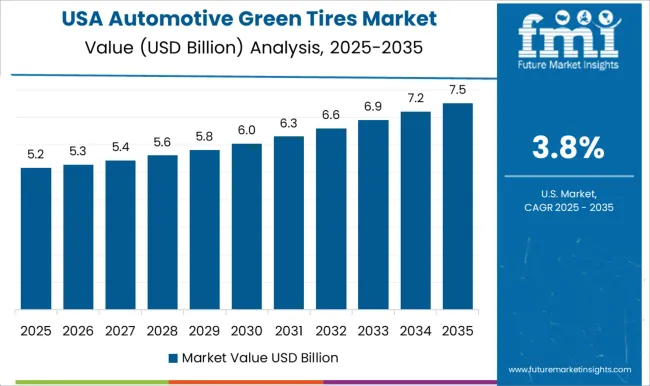
The United States automotive green tires is anticipated to gain a CAGR of 7.5% through 2035. Factors that are bolstering the growth are:
The market in the United Kingdom is expected to expand with an 8.3% CAGR through 2035. The factors pushing the growth are:
The automotive green tires ecosystem in China is anticipated to develop with a 7.8% CAGR from 2025 to 2035. The drivers behind this growth are:
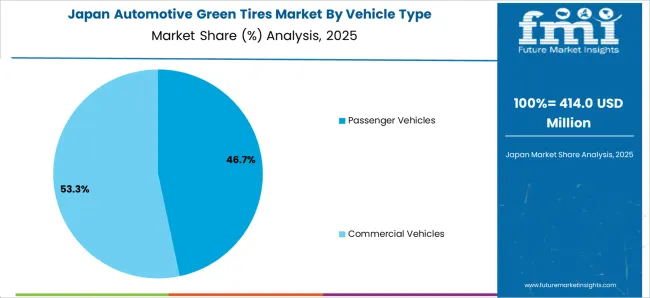
The automotive green tires industry in Japan is anticipated to reach an 8.8% CAGR from 2025 to 2035. The drivers propelling growth forward are:
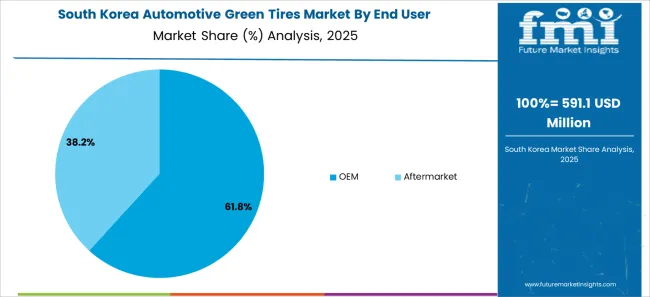
The automotive green tires ecosystem in South Korea is likely to evolve with a 9.3% CAGR during the forecast period. The factors bolstering the growth are:
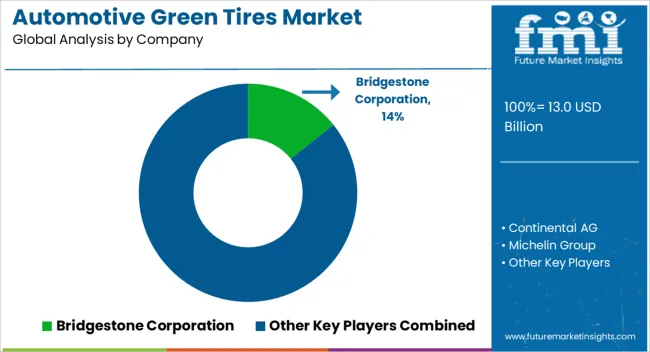
Companies in the global automotive green tires market are concentrating more on producing environmentally friendly tire solutions to solve sustainability issues and minimize carbon footprint.
Significant companies are funding research and development to create novel materials and production techniques that reduce energy use and emissions over the course of the lifespan of a tire.
Companies are working with manufacturers to incorporate green tire technology into cars, encouraging fuel economy and cutting greenhouse gas emissions. Companies are committed to meeting the increasing demand from consumers for sustainable transportation solutions, as seen by their strategic alliances and investments in environmentally friendly projects. The key players in this market include:
Significant advancements in the automotive green tires sector are being made by key market participants, and these include:
| Report Attribute | Details |
|---|---|
| Growth Rate | CAGR of 4.5% from 2025 to 2035 |
| Market value in 2025 | USD 12.4 billion |
| Market value in 2035 | USD 25 billion |
| Base Year for Estimation | 2025 |
| Historical Data | 2020 to 2025 |
| Forecast Period | 2025 to 2035 |
| Quantitative Units | USD billion for value |
| Report Coverage | Revenue Forecast, Company Ranking, Competitive Landscape, Growth Factors, Trends, and Pricing Analysis |
| Segments Covered | Vehicle Type, End User, Region |
| Regions Covered | North America; Latin America; Western Europe; Eastern Europe; South Asia and Pacific; East Asia; Middle East & Africa |
| Countries Profiled | The United States, Canada, Brazil, Mexico, Germany, The United Kingdom, France, Spain, Italy, Poland, Russia, Czech Republic, Romania, India, Bangladesh, Australia, New Zealand, China, Japan, South Korea, GCC Countries, South Africa, Israel |
| Key Companies Profiled | Bridgestone Corporation; Continental AG; Michelin Group; Apollo Tyres Limited; Yokohama Tire Corporation; Goodyear Tire & Rubber Company; Pirelli & C. Spa; Toyo Tire Corporation; MRF Limited; CEAT Limited |
| Customization Scope | Available on Request |
The global automotive green tires market is estimated to be valued at USD 13.0 billion in 2025.
The market size for the automotive green tires market is projected to reach USD 20.1 billion by 2035.
The automotive green tires market is expected to grow at a 4.5% CAGR between 2025 and 2035.
The key product types in automotive green tires market are passenger vehicles and commercial vehicles.
In terms of end user, oem segment to command 62.4% share in the automotive green tires market in 2025.


Our Research Products

The "Full Research Suite" delivers actionable market intel, deep dives on markets or technologies, so clients act faster, cut risk, and unlock growth.

The Leaderboard benchmarks and ranks top vendors, classifying them as Established Leaders, Leading Challengers, or Disruptors & Challengers.

Locates where complements amplify value and substitutes erode it, forecasting net impact by horizon

We deliver granular, decision-grade intel: market sizing, 5-year forecasts, pricing, adoption, usage, revenue, and operational KPIs—plus competitor tracking, regulation, and value chains—across 60 countries broadly.

Spot the shifts before they hit your P&L. We track inflection points, adoption curves, pricing moves, and ecosystem plays to show where demand is heading, why it is changing, and what to do next across high-growth markets and disruptive tech

Real-time reads of user behavior. We track shifting priorities, perceptions of today’s and next-gen services, and provider experience, then pace how fast tech moves from trial to adoption, blending buyer, consumer, and channel inputs with social signals (#WhySwitch, #UX).

Partner with our analyst team to build a custom report designed around your business priorities. From analysing market trends to assessing competitors or crafting bespoke datasets, we tailor insights to your needs.
Supplier Intelligence
Discovery & Profiling
Capacity & Footprint
Performance & Risk
Compliance & Governance
Commercial Readiness
Who Supplies Whom
Scorecards & Shortlists
Playbooks & Docs
Category Intelligence
Definition & Scope
Demand & Use Cases
Cost Drivers
Market Structure
Supply Chain Map
Trade & Policy
Operating Norms
Deliverables
Buyer Intelligence
Account Basics
Spend & Scope
Procurement Model
Vendor Requirements
Terms & Policies
Entry Strategy
Pain Points & Triggers
Outputs
Pricing Analysis
Benchmarks
Trends
Should-Cost
Indexation
Landed Cost
Commercial Terms
Deliverables
Brand Analysis
Positioning & Value Prop
Share & Presence
Customer Evidence
Go-to-Market
Digital & Reputation
Compliance & Trust
KPIs & Gaps
Outputs
Full Research Suite comprises of:
Market outlook & trends analysis
Interviews & case studies
Strategic recommendations
Vendor profiles & capabilities analysis
5-year forecasts
8 regions and 60+ country-level data splits
Market segment data splits
12 months of continuous data updates
DELIVERED AS:
PDF EXCEL ONLINE
Automotive Direct Liquid Cooling IGBT Module Market Size and Share Forecast Outlook 2025 to 2035
Automotive Hoses and Assemblies Market Size and Share Forecast Outlook 2025 to 2035
Automotive Network Testing Market Size and Share Forecast Outlook 2025 to 2035
Automotive Performance Part Market Size and Share Forecast Outlook 2025 to 2035
Automotive Carbon Ceramic Brake Market Size and Share Forecast Outlook 2025 to 2035
Automotive Camshaft Market Size and Share Forecast Outlook 2025 to 2035
Automotive Stamping Industry Analysis in India Size and Share Forecast Outlook 2025 to 2035
Automotive Cylinder Liner Market Size and Share Forecast Outlook 2025 to 2035
Automotive Microcontroller Market Size and Share Forecast Outlook 2025 to 2035
Automotive Roof Rails Market Size and Share Forecast Outlook 2025 to 2035
Automotive Active Safety System Market Size and Share Forecast Outlook 2025 to 2035
Automotive Diagnostic Scan Tool Market Size and Share Forecast Outlook 2025 to 2035
Automotive Test Equipment Market Size and Share Forecast Outlook 2025 to 2035
Automotive Dynamic Map Data Market Size and Share Forecast Outlook 2025 to 2035
Automotive E-Tailing Market Size and Share Forecast Outlook 2025 to 2035
Automotive Interior Market Forecast Outlook 2025 to 2035
Automotive Key Market Size and Share Forecast Outlook 2025 to 2035
Automotive Appearance Chemical Market Forecast and Outlook 2025 to 2035
Automotive Seating Market Forecast and Outlook 2025 to 2035
Automotive Domain Control Module Market Forecast and Outlook 2025 to 2035

Thank you!
You will receive an email from our Business Development Manager. Please be sure to check your SPAM/JUNK folder too.
Chat With
MaRIA