Automotive Appearance Chemicals Market
Average Growth Expected for the Automotive Appearance Chemicals Market. FMI analyses Growth Opportunities in 30+ Countries.
Automotive Appearance Chemicals Market by Product, Vehicle Type, Sales Channel & Region | Forecast 2023 to 2033
Automotive Appearance Chemicals Market Outlook 2023 to 2033
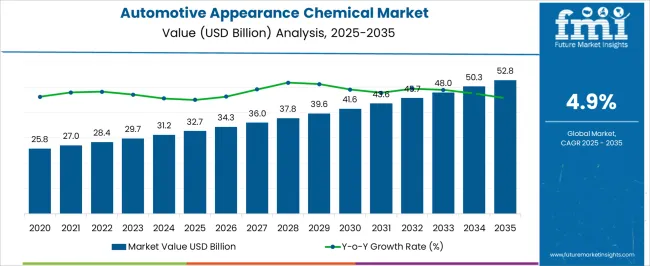
The global automotive appearance chemicals market is estimated to reach a valuation of US$ 30.7 Billion in 2023. As per Future Market Insights (FMI) analysis, the automotive appearance chemicals market size is expected to surpass US$ 49.4 Billion in the next decade. Between 2023 and 2033, the market has been forecast to record a CAGR of 4.9%.
Attributes |
Details |
Automotive Appearance Chemicals Market HCAGR (2017 to 2022) |
4.2% |
Automotive Appearance Chemicals Market CAGR (2023 to 2033) |
4.9% |
Market Size for Automotive Appearance Chemicals (2023) |
US$ 30.7 Billion |
Market Size for Automotive Appearance Chemicals (2033) |
US$ 49.4 Billion |
Let us know your requirement to get
100% FREE customization
Global Trends & Scopes Revolutionizing the Automotive Appearance Chemicals Market
Key players assist car OEMs and Tier suppliers in turning obstacles into successes. Their success is based on decades of expertise in all coating layers used in car assembly and component production activities. Moreover, they seek to make processes easier for their end customers when they need to discover and execute process improvements, fulfill ever-increasing sustainability requirements, improve quality, increase productivity, and cut costs.
Additionally, given the main players' global leadership in color, they help define a client's brand and distinguish it from competitors. They provide the appropriate color and auto appearance chemicals to suit the design and form of cars, establishing and improving brand strategy.
Key companies claim that their transportation coatings are engineered to last in the most difficult on- and off-road conditions. They aim to protect their customers' most valuable assets by engineering paints and coatings that extend the life of vehicles through outstanding corrosion protection, enduring color, and long-lasting gloss.
They have a legacy of innovations, excellent technical expertise, and industry-leading color formulations. These significant players provide one of the industry's most diverse product portfolios, including waterborne and solvent-borne primers, basecoats, clear coats, powder primers, and scratch-resistant ceramic clear coats.
They have produced solutions that are simple to use, inexpensive, and accomplish the job, with over 100 years of automotive research and invention. These companies claim to provide end-to-end solutions for the automotive aftermarket appearance chemicals industries from a single source. Their product line comprises specialty resins, acrylic polymer emulsions, formulation additives, and performance additives for improved coating performance.
Their resources and skills enable them to produce long-lasting surfaces that fulfill the designer's aesthetic goals as well as the demands of evolving legislation while adhering to sustainable environmental standards. The additives safeguard the aesthetic quality of coatings on a variety of substrates.
The surface performance of final coatings is improved by formulation additives such as defoamers, dispersants, rheology modifiers, and slide and leveling agents. They also aid in the optimization of production processes and the reduction of expenses. In close collaboration with OEMs, major companies have created solutions that operate dependably and consistently during the production process, including solutions for wet-on-wet applications.
Leading manufacturers rely on them for additives and assistance in developing competitive vehicle OEM and refinish coatings. Their solutions not only improve surface attributes like beauty and enable new effects, but they also increase resistance to corrosion and scratches. Some of these auto-appearance chemicals offer three years of protection, a ceramic coating hardness of up to 9H, and the highest-gloss finish on the market.
Comparative Analysis of Adjacent Markets
Automotive Appearance Chemicals Market:
Attributes |
Automotive Appearance Chemicals Market |
CAGR (2023 to 2033) |
4.9% |
Market Value (2033) |
US$ 49.4 Billion |
Growth Factor |
A significant rise in automobile ownership is expected in the market owing to growing urbanization and rising disposable incomes. |
Opportunity |
Increasing adoption of modern technology in specialized applications, like protecting automobiles against swirls and scratches and enhancing their luster. |
Restraints |
Consumers cannot undergo continuous replacement of parts that generate more carbon and hurt the environment. |
Automotive Refinish Coatings Market:
Attributes |
Automotive Refinish Coatings Market |
CAGR (2023 to 2033) |
5.1% |
Market Value (2033) |
US$ 12.9 Billion |
Growth Factor |
Consumers' growing environmental concerns are pushing them to select eco-friendly items over conventional products. |
Opportunity |
Technological advancements combined with continual product development to improve refinish coating performance. |
Restraints |
Governments have set stringent limitations on the use of solvent-based coatings since they create VOCs and fumes that cause illness and degrade the environment. |
Automotive Plastics Market:
Attributes |
Automotive Plastics Market |
CAGR (2023 to 2033) |
4.7% |
Market Value (2033) |
US$ 47.12 Billion |
Growth Factor |
The use of plastics decreases fuel consumption in a vehicle since reduced weight absorbs less energy during acceleration. |
Opportunity |
Advanced plastic materials are being utilized to significantly reduce carbon emissions, which bodes well for the business in the next years. |
Restraints |
A prohibition on the use of plastics is expected to limit the industry for automotive plastics since they produce waste that harms the environment. |
Find your sweet spots for generating winning opportunities in this market.
Talk to AnalystHow are Environmental Concerns Generating New Product Launches?
The increasing sales of commercial and industrial vehicles are expected to fuel the global demand for automotive appearance chemicals. Additionally, as environmental concerns grow, governments in several countries are imposing strict restrictions on petroleum products like waxes and coatings. As a result, major manufacturers are using bio-based chemicals to create environmentally acceptable product versions.
Regulatory bodies such as the USA Environmental Protection Agency and the JASMA monitor the environmental impact and develop standards for automotive components, such as noise emission levels from mufflers and resonators in automotive exhaust systems, which are expected to spur advancement in automotive parts.
Digitalization of component delivery sales and service, as well as online distribution portals for aftermarket components in collaboration with global automotive suppliers, are projected to attract significant investment from industry participants. Moreover, owing to online and computerized delivery channels, the automotive appearance of chemicals in emerging nations is likely to increase significantly.
High Costs of Chemicals & Other Hindrances
For most of the populace, the expense of vehicle modification is too expensive. Vehicle parts are promoted as a high-end alternative to comparable upper-class customers who are willing to pay a premium for them. Therefore, if this gets more frequently utilized, the price may drop so that the average person can afford it. As a result, it stifles the growth of the automotive aftermarket and hence, is likely to curb the sales of automotive appearance chemicals.

A unified Market Research Subscription Platform, built for today's disparate research needs.
Region-Wise Overview
Country | United States of America |
CAGR (2023 to 2033) | 4.6% |
HCAGR (2017 to 2022) | 4.2% |
Country | United Kingdom |
CAGR (2023 to 2033) | 4.7% |
HCAGR (2017 to 2022) | 3.9% |
Country | Germany |
CAGR (2023 to 2033) | 4.2% |
HCAGR (2017 to 2022) | 3.9% |
Country | China |
CAGR (2023 to 2033) | 5.9% |
HCAGR (2017 to 2022) | 5.1% |
Country | India |
CAGR (2023 to 2033) | 6.7% |
HCAGR (2017 to 2022) | 5.8% |
Customers in the USA are Entitled to Customize Their Vehicles -
Attributes |
Details |
USA Market Size (2033) |
US$ 7.7 Billion |
USA Market Absolute Dollar Growth (US$ Million/Billion) |
US$ 2.8 Billion |
North America holds a significant share of the automotive appearance chemicals market, particularly in the USA, with a revenue share of 4.6%. The value of the automotive appearance chemicals market in the USA is estimated to reach a high of US$ 7.7 Billion by 2033. This is attributed to the increased sales of vehicles and the desire to embellish their vehicles.
Key players in the country are working hard to defend customers' rights to drive ornamented, modified, and historic automobiles. The Specialty Equipment Market Association (SEMA) monitors legislators in Washington, D.C., as well as each state in the USA so that anyone who enjoys cars and trucks can both protest pending legislation that may harm their hobby and support legislation that is beneficial to car enthusiasts.
Region Market Players offer Various Services to their End Users
Attributes |
Details |
UK Market Size (2033) |
US$ 2.3 Billion |
UK Market Absolute Dollar Growth (US$ Million/Billion) |
US$ 842.3 Million |
Europe is a notable automotive appearance chemicals market, particularly in the UK and Germany. This is attributed to the growing demand for automotive appearance chemicals in countries such as Germany, which is likely to drive market expansion during the forecast period.
The United Kingdom generates several market potentials, growing at a slow-paced revenue of 4.7% and with an estimated value to reach US$ 2.3 Billion through the forecast period. Automotive appearance chemicals are becoming more popular in the region as a result of the large-scale production of luxury and other passenger vehicles.
Regional players in the United Kingdom provide dependable solutions that meet both high performance and C.A.R.B. compliance. They also provide 'Analytical Services,' which may evaluate for water content, ammonium content, banned chemicals, ketones, and alcohols to assist in determining whether the C.A.R.B. standards for volatile content are reached. In addition, they conduct ongoing Research And Development (R&D) to guarantee that their professional automotive cleaning solutions are the finest in the industry, whether one is a distributor, valet, or end user.
In Germany, Market Players use Recycled Plastics to Manufacture Aftermarket Chemicals
Attributes |
Details |
Germany Market Size (2033) |
US$ 3.1 Billion |
Germany Market Absolute Dollar Growth (US$ Million/Billion) |
US$ 1 Billion |
Germany is a lucrative automotive appearance chemicals market, growing at a profit of 4.2%. The value of the automotive appearance chemicals market in Germany is expected to reach a high of US$ 3.1 Billion. Key players offer grades, including post-consumer recycled (PCR) plastics, to fulfill rising industry and end-user demand for high-quality materials that make better use of natural resources.
Market players claim to understand the issues that their clients face daily, as well as what they require to satisfy the expectations of their respective industries. They work hard to create chemical solutions that are likely to provide them with a competitive advantage. Their extremely advanced production techniques and technology, as top global chemical businesses, allow them to adapt their additives and specialty chemicals to specifications.
Material solutions provided by key firms aid in lightweight construction and, as a result, play a vital role in increasing energy efficiency. Furthermore, aftermarket stores are preferred by consumers for the replacement of items and services after the warranty period has expired. The increased average service life of automobiles owing to proper and timely maintenance is expected to significantly enhance product demand.
China has witnessed a Rapid Demand for Automotive Appearance Chemicals in the Last Few Years
Attributes |
Details |
China Market Size (2033) |
US$ 8.9 Billion |
China Market Absolute Dollar Growth (US$ Million/Billion) |
US$ 3.9 Billion |
China is the largest market in the Asia Pacific, with a revenue share of 5.9%. The value of the automotive appearance chemicals market in China is estimated to reach a high of US$ 8.9 Billion by the year 2033. The advancement of industrial capacities has been hastened by several joint ventures involving typically state-owned Chinese organizations and brands from the USA, Japan, South Korea, and Germany.
Consumer demand for automotive appearance chemicals has increased in China since it improves car durability and looks while protecting it from UV radiation, severe temperatures, acid rain, and foreign particles. In addition, home-grown Chinese companies arose as local manufacturing skills and know-how expanded, with some already making inroads into the global export market.
New Entrants are Catching Up with Key Players with Innovative Strategies: Start-up Sphere
Start-up companies are slowly contributing to the automotive appearance chemicals market size by providing components and other services for the automotive aftermarket. Manufacturing enterprises for automobile aftermarket appearance chemicals are projected to grow significantly during the forecast period.
ExtreemeStyling - It is a website that sells aftermarket car components and accessories. Buyers may use the site to search for the vehicle components they wish to purchase. Their service is available globally and includes online payment, delivery, a refund policy, and other features. DHL, MasterCard, PayPal, Visa, and other companies are among the partners.
Carbox - It is a website that sells vehicle parts and accessories. The platform distributes automobile aftermarket items such as brake parts, engine components, suspension, gearbox, electrical & lighting, body parts, batteries & lubricants, interior/exterior accessories, travel & leisure, and so on. Each product sold comes with a 30-day return policy.
Out For Space - It is a German start-up that creates biomaterials for use in automobile interiors. The firm converts the natural structure of rattan palms into its own substance, karuun. It makes use of energy-saving technologies to generate a lightweight, air-permeable material with great stability and malleability. The biomaterial developed by the firm is already used in the interiors of NIO Mercedes Benz vehicles.
Key Companies Revamping the Automotive Appearance Chemicals Market Space
Key companies are seeking to get a competitive advantage and expand their market reach. Global market participants are forming joint ventures and partnerships, as well as engaging in research and development (R&D). These reasons are predicted to increase competitiveness and boost the global automotive appearance chemicals market size.
Latest Developments:
- In 2020, Adam's Polishes, a pioneer in vehicle detailing and cleaning chemicals, teamed with Microban, the industry leader in antimicrobial technology, to expand its antimicrobial solution range for car interior cleaning.
- Protect All Inc., a well-known laminating solutions provider, provides the Biolam® antimicrobial technology-based film, which is used in a variety of applications ranging from packaged foods and menus to high-grade automobile protection films.
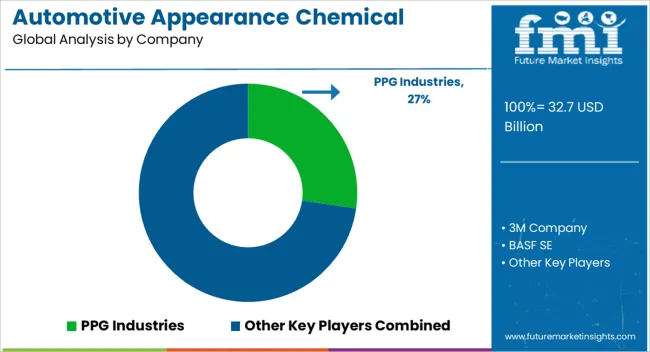
TOP MARKET PLAYERS IN THE AUTOMOTIVE APPEARANCE CHEMICALS MARKET
- PPG Industries
- 3M Company
- BASF SE
- Energizer Holdings Inc.
- Kao Corporation
- Jax Wax Inc.
- Malco Products Inc.
- Koch-Chemie GmbH
- Koster Keunen Inc.
- The Darent Wax Company Ltd.
- Northern Labs Inc.
- CRC Industries
- Turtle Wax Inc.
- DuPont de Nemours Inc.
Key Segments Profiled in the Automotive Appearance Chemicals Market Survey
By Product Type:
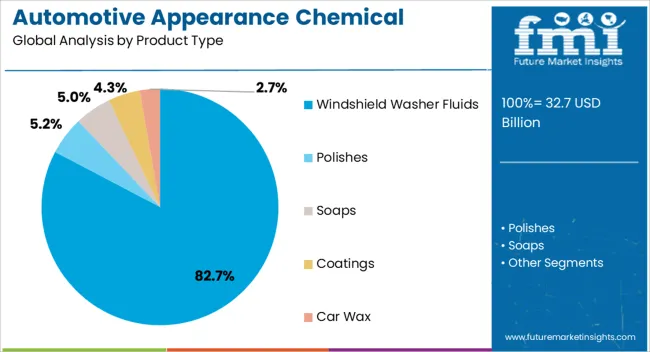
- Polishes
- Windshield Washer Fluids
- Soaps
- Coatings
- Car Wax
By Vehicle Type:
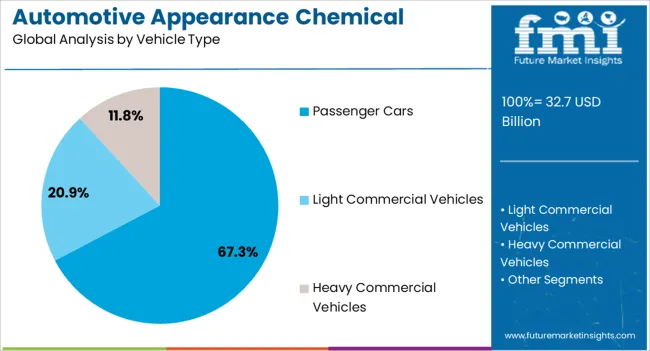
- Passenger Cars
- Light Commercial Vehicles (LCV)
- Heavy Commercial Vehicles (HCV)
By Sales Channel:
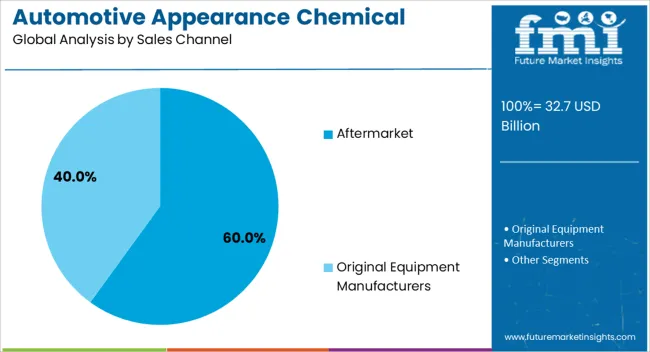
- Aftermarket
- Original Equipment Manufacturers (OEMs)
By Region:
- North America
- Latin America
- Asia Pacific
- Middle East and Africa (MEA)
- Europe
Frequently Asked Questions
How is the Automotive Appearance Chemicals Market Growing?
The automotive appearance chemicals market is anticipated to grow at a CAGR of 4.9% during the forecast period.
Why does the Automotive Appearance Chemicals Market have high growth potential?
Changing lifestyles and living standards, and an increasing income contribute to a surge in product demand.
Where is the Automotive Appearance Chemicals Market most dominant?
India is expected to hold the major share of the market, followed by China.
Table of Content
1. Executive Summary | Automotive Appearance Chemicals Market 1.1. Global Market Outlook 1.2. Demand-side Trends 1.3. Supply-side Trends 1.4. Technology Roadmap Analysis 1.5. Analysis and Recommendations 2. Market Overview 2.1. Market Coverage / Taxonomy 2.2. Market Definition / Scope / Limitations 3. Market Background 3.1. Market Dynamics 3.1.1. Drivers 3.1.2. Restraints 3.1.3. Opportunity 3.1.4. Trends 3.2. Scenario Forecast 3.2.1. Demand in Optimistic Scenario 3.2.2. Demand in Likely Scenario 3.2.3. Demand in Conservative Scenario 3.3. Opportunity Map Analysis 3.4. Product Life Cycle Analysis 3.5. Supply Chain Analysis 3.5.1. Supply Side Participants and their Roles 3.5.1.1. Producers 3.5.1.2. Mid-Level Participants (Traders/ Agents/ Brokers) 3.5.1.3. Wholesalers and Distributors 3.5.2. Value Added and Value Created at Node in the Supply Chain 3.5.3. List of Raw Material Suppliers 3.5.4. List of Existing and Potential Buyers 3.6. Investment Feasibility Matrix 3.7. Value Chain Analysis 3.7.1. Profit Margin Analysis 3.7.2. Wholesalers and Distributors 3.7.3. Retailers 3.8. PESTLE and Porter’s Analysis 3.9. Regulatory Landscape 3.9.1. By Key Regions 3.9.2. By Key Countries 3.10. Regional Parent Market Outlook 3.11. Production and Consumption Statistics 3.12. Import and Export Statistics 4. Global Market Analysis 2017 to 2022 and Forecast, 2023 to 2033 4.1. Historical Market Size Value (US$ Million) & Volume (Tons) Analysis, 2017 to 2022 4.2. Current and Future Market Size Value (US$ Million) & Volume (Tons) Projections, 2023 to 2033 4.2.1. Y-o-Y Growth Trend Analysis 4.2.2. Absolute $ Opportunity Analysis 5. Global Market Analysis 2017 to 2022 and Forecast 2023 to 2033, By Product Type 5.1. Introduction / Key Findings 5.2. Historical Market Size Value (US$ Million) & Volume (Tons) Analysis By Product Type, 2017 to 2022 5.3. Current and Future Market Size Value (US$ Million) & Volume (Tons) Analysis and Forecast By Product Type, 2023 to 2033 5.3.1. Polishes 5.3.2. Windshield Washer Fluids 5.3.3. Soaps 5.3.4. Coatings 5.3.5. Car Wax 5.4. Y-o-Y Growth Trend Analysis By Product Type, 2017 to 2022 5.5. Absolute $ Opportunity Analysis By Product Type, 2023 to 2033 6. Global Market Analysis 2017 to 2022 and Forecast 2023 to 2033, By Vehicle Type 6.1. Introduction / Key Findings 6.2. Historical Market Size Value (US$ Million) & Volume (Tons) Analysis By Vehicle Type, 2017 to 2022 6.3. Current and Future Market Size Value (US$ Million) & Volume (Tons) Analysis and Forecast By Vehicle Type, 2023 to 2033 6.3.1. Passenger Cars 6.3.2. Light Commercial Vehicles 6.3.3. Heavy Commercial Vehicles 6.4. Y-o-Y Growth Trend Analysis By Vehicle Type, 2017 to 2022 6.5. Absolute $ Opportunity Analysis By Vehicle Type, 2023 to 2033 7. Global Market Analysis 2017 to 2022 and Forecast 2023 to 2033, By Sales Channel 7.1. Introduction / Key Findings 7.2. Historical Market Size Value (US$ Million) & Volume (Tons) Analysis By Sales Channel, 2017 to 2022 7.3. Current and Future Market Size Value (US$ Million) & Volume (Tons) Analysis and Forecast By Sales Channel, 2023 to 2033 7.3.1. Aftermarket 7.3.2. Original Equipment Manufacturers 7.4. Y-o-Y Growth Trend Analysis By Sales Channel, 2017 to 2022 7.5. Absolute $ Opportunity Analysis By Sales Channel, 2023 to 2033 8. Global Market Analysis 2017 to 2022 and Forecast 2023 to 2033, By Region 8.1. Introduction 8.2. Historical Market Size Value (US$ Million) & Volume (Tons) Analysis By Region, 2017 to 2022 8.3. Current Market Size Value (US$ Million) & Volume (Tons) Analysis and Forecast By Region, 2023 to 2033 8.3.1. North America 8.3.2. Latin America 8.3.3. Europe 8.3.4. East Asia 8.3.5. South Asia Pacific 8.3.6. Middle East and Africa 8.4. Market Attractiveness Analysis By Region 9. North America Market Analysis 2017 to 2022 and Forecast 2023 to 2033, By Country 9.1. Historical Market Size Value (US$ Million) & Volume (Tons) Trend Analysis By Market Taxonomy, 2017 to 2022 9.2. Market Size Value (US$ Million) & Volume (Tons) Forecast By Market Taxonomy, 2023 to 2033 9.2.1. By Country 9.2.1.1. United States of America 9.2.1.2. Canada 9.2.2. By Product Type 9.2.3. By Vehicle Type 9.2.4. By Sales Channel 9.3. Market Attractiveness Analysis 9.3.1. By Country 9.3.2. By Product Type 9.3.3. By Vehicle Type 9.3.4. By Sales Channel 9.4. Key Takeaways 10. Latin America Market Analysis 2017 to 2022 and Forecast 2023 to 2033, By Country 10.1. Historical Market Size Value (US$ Million) & Volume (Tons) Trend Analysis By Market Taxonomy, 2017 to 2022 10.2. Market Size Value (US$ Million) & Volume (Tons) Forecast By Market Taxonomy, 2023 to 2033 10.2.1. By Country 10.2.1.1. Brazil 10.2.1.2. Mexico 10.2.1.3. Rest of Latin America 10.2.2. By Product Type 10.2.3. By Vehicle Type 10.2.4. By Sales Channel 10.3. Market Attractiveness Analysis 10.3.1. By Country 10.3.2. By Product Type 10.3.3. By Vehicle Type 10.3.4. By Sales Channel 10.4. Key Takeaways 11. Europe Market Analysis 2017 to 2022 and Forecast 2023 to 2033, By Country 11.1. Historical Market Size Value (US$ Million) & Volume (Tons) Trend Analysis By Market Taxonomy, 2017 to 2022 11.2. Market Size Value (US$ Million) & Volume (Tons) Forecast By Market Taxonomy, 2023 to 2033 11.2.1. By Country 11.2.1.1. Germany 11.2.1.2. The United Kingdom 11.2.1.3. France 11.2.1.4. Italy 11.2.1.5. Spain 11.2.1.6. Russia 11.2.1.7. Poland 11.2.1.8. Rest of Europe 11.2.2. By Product Type 11.2.3. By Vehicle Type 11.2.4. By Sales Channel 11.3. Market Attractiveness Analysis 11.3.1. By Country 11.3.2. By Product Type 11.3.3. By Vehicle Type 11.3.4. By Sales Channel 11.4. Key Takeaways 12. East Asia Market Analysis 2017 to 2022 and Forecast 2023 to 2033, By Country 12.1. Historical Market Size Value (US$ Million) & Volume (Tons) Trend Analysis By Market Taxonomy, 2017 to 2022 12.2. Market Size Value (US$ Million) & Volume (Tons) Forecast By Market Taxonomy, 2023 to 2033 12.2.1. By Country 12.2.1.1. China 12.2.1.2. Japan 12.2.1.3. South Korea 12.2.2. By Product Type 12.2.3. By Vehicle Type 12.2.4. By Sales Channel 12.3. Market Attractiveness Analysis 12.3.1. By Country 12.3.2. By Product Type 12.3.3. By Vehicle Type 12.3.4. By Sales Channel 12.4. Key Takeaways 13. South Asia Pacific Market Analysis 2017 to 2022 and Forecast 2023 to 2033, By Country 13.1. Historical Market Size Value (US$ Million) & Volume (Tons) Trend Analysis By Market Taxonomy, 2017 to 2022 13.2. Market Size Value (US$ Million) & Volume (Tons) Forecast By Market Taxonomy, 2023 to 2033 13.2.1. By Country 13.2.1.1. India 13.2.1.2. ASEAN 13.2.1.3. Australia and New Zealand 13.2.1.4. Rest of South Asia Pacific 13.2.2. By Product Type 13.2.3. By Vehicle Type 13.2.4. By Sales Channel 13.3. Market Attractiveness Analysis 13.3.1. By Country 13.3.2. By Product Type 13.3.3. By Vehicle Type 13.3.4. By Sales Channel 13.4. Key Takeaways 14. Middle East and Africa Market Analysis 2017 to 2022 and Forecast 2023 to 2033, By Country 14.1. Historical Market Size Value (US$ Million) & Volume (Tons) Trend Analysis By Market Taxonomy, 2017 to 2022 14.2. Market Size Value (US$ Million) & Volume (Tons) Forecast By Market Taxonomy, 2023 to 2033 14.2.1. By Country 14.2.1.1. GCC Countries 14.2.1.2. South Africa 14.2.1.3. Turkey 14.2.1.4. Rest of MEA 14.2.2. By Product Type 14.2.3. By Vehicle Type 14.2.4. By Sales Channel 14.3. Market Attractiveness Analysis 14.3.1. By Country 14.3.2. By Product Type 14.3.3. By Vehicle Type 14.3.4. By Sales Channel 14.4. Key Takeaways 15. Key Countries Market Analysis 15.1. United States of America 15.1.1. Pricing Analysis 15.1.2. Market Share Analysis, 2022 15.1.2.1. By Product Type 15.1.2.2. By Vehicle Type 15.1.2.3. By Sales Channel 15.2. Canada 15.2.1. Pricing Analysis 15.2.2. Market Share Analysis, 2022 15.2.2.1. By Product Type 15.2.2.2. By Vehicle Type 15.2.2.3. By Sales Channel 15.3. Brazil 15.3.1. Pricing Analysis 15.3.2. Market Share Analysis, 2022 15.3.2.1. By Product Type 15.3.2.2. By Vehicle Type 15.3.2.3. By Sales Channel 15.4. Mexico 15.4.1. Pricing Analysis 15.4.2. Market Share Analysis, 2022 15.4.2.1. By Product Type 15.4.2.2. By Vehicle Type 15.4.2.3. By Sales Channel 15.5. Germany 15.5.1. Pricing Analysis 15.5.2. Market Share Analysis, 2022 15.5.2.1. By Product Type 15.5.2.2. By Vehicle Type 15.5.2.3. By Sales Channel 15.6. United Kingdom 15.6.1. Pricing Analysis 15.6.2. Market Share Analysis, 2022 15.6.2.1. By Product Type 15.6.2.2. By Vehicle Type 15.6.2.3. By Sales Channel 15.7. France 15.7.1. Pricing Analysis 15.7.2. Market Share Analysis, 2022 15.7.2.1. By Product Type 15.7.2.2. By Vehicle Type 15.7.2.3. By Sales Channel 15.8. Italy 15.8.1. Pricing Analysis 15.8.2. Market Share Analysis, 2022 15.8.2.1. By Product Type 15.8.2.2. By Vehicle Type 15.8.2.3. By Sales Channel 15.9. Spain 15.9.1. Pricing Analysis 15.9.2. Market Share Analysis, 2022 15.9.2.1. By Product Type 15.9.2.2. By Vehicle Type 15.9.2.3. By Sales Channel 15.10. Russia 15.10.1. Pricing Analysis 15.10.2. Market Share Analysis, 2022 15.10.2.1. By Product Type 15.10.2.2. By Vehicle Type 15.10.2.3. By Sales Channel 15.11. Poland 15.11.1. Pricing Analysis 15.11.2. Market Share Analysis, 2022 15.11.2.1. By Product Type 15.11.2.2. By Vehicle Type 15.11.2.3. By Sales Channel 15.12. China 15.12.1. Pricing Analysis 15.12.2. Market Share Analysis, 2022 15.12.2.1. By Product Type 15.12.2.2. By Vehicle Type 15.12.2.3. By Sales Channel 15.13. Japan 15.13.1. Pricing Analysis 15.13.2. Market Share Analysis, 2022 15.13.2.1. By Product Type 15.13.2.2. By Vehicle Type 15.13.2.3. By Sales Channel 15.14. South Korea 15.14.1. Pricing Analysis 15.14.2. Market Share Analysis, 2022 15.14.2.1. By Product Type 15.14.2.2. By Vehicle Type 15.14.2.3. By Sales Channel 15.15. India 15.15.1. Pricing Analysis 15.15.2. Market Share Analysis, 2022 15.15.2.1. By Product Type 15.15.2.2. By Vehicle Type 15.15.2.3. By Sales Channel 15.16. ASIAN 15.16.1. Pricing Analysis 15.16.2. Market Share Analysis, 2022 15.16.2.1. By Product Type 15.16.2.2. By Vehicle Type 15.16.2.3. By Sales Channel 15.17. Australia and New Zealand 15.17.1. Pricing Analysis 15.17.2. Market Share Analysis, 2022 15.17.2.1. By Product Type 15.17.2.2. By Vehicle Type 15.17.2.3. By Sales Channel 15.18. GCC Countries 15.18.1. Pricing Analysis 15.18.2. Market Share Analysis, 2022 15.18.2.1. By Product Type 15.18.2.2. By Vehicle Type 15.18.2.3. By Sales Channel 15.19. South Africa 15.19.1. Pricing Analysis 15.19.2. Market Share Analysis, 2022 15.19.2.1. By Product Type 15.19.2.2. By Vehicle Type 15.19.2.3. By Sales Channel 15.20. Turkey 15.20.1. Pricing Analysis 15.20.2. Market Share Analysis, 2022 15.20.2.1. By Product Type 15.20.2.2. By Vehicle Type 15.20.2.3. By Sales Channel 16. Market Structure Analysis 16.1. Competition Dashboard 16.2. Competition Benchmarking 16.3. Market Share Analysis of Top Players 16.3.1. By Regional 16.3.2. By Product Type 16.3.3. By Vehicle Type 16.3.4. By Sales Channel 17. Competition Analysis 17.1. Competition Deep Dive 17.1.1. PPG Industries 17.1.1.1. Overview 17.1.1.2. Product Portfolio 17.1.1.3. Profitability by Market Segments 17.1.1.4. Sales Footprint 17.1.1.5. Strategy Overview 17.1.1.5.1. Marketing Strategy 17.1.1.5.2. Product Strategy 17.1.1.5.3. Channel Strategy 17.1.2. 3M Company 17.1.2.1. Overview 17.1.2.2. Product Portfolio 17.1.2.3. Profitability by Market Segments 17.1.2.4. Sales Footprint 17.1.2.5. Strategy Overview 17.1.2.5.1. Marketing Strategy 17.1.2.5.2. Product Strategy 17.1.2.5.3. Channel Strategy 17.1.3. BASF SE 17.1.3.1. Overview 17.1.3.2. Product Portfolio 17.1.3.3. Profitability by Market Segments 17.1.3.4. Sales Footprint 17.1.3.5. Strategy Overview 17.1.3.5.1. Marketing Strategy 17.1.3.5.2. Product Strategy 17.1.3.5.3. Channel Strategy 17.1.4. Energizer Holdings Inc. 17.1.4.1. Overview 17.1.4.2. Product Portfolio 17.1.4.3. Profitability by Market Segments 17.1.4.4. Sales Footprint 17.1.4.5. Strategy Overview 17.1.4.5.1. Marketing Strategy 17.1.4.5.2. Product Strategy 17.1.4.5.3. Channel Strategy 17.1.5. Kao Corporation 17.1.5.1. Overview 17.1.5.2. Product Portfolio 17.1.5.3. Profitability by Market Segments 17.1.5.4. Sales Footprint 17.1.5.5. Strategy Overview 17.1.5.5.1. Marketing Strategy 17.1.5.5.2. Product Strategy 17.1.5.5.3. Channel Strategy 17.1.6. Jax Wax Inc 17.1.6.1. Overview 17.1.6.2. Product Portfolio 17.1.6.3. Profitability by Market Segments 17.1.6.4. Sales Footprint 17.1.6.5. Strategy Overview 17.1.6.5.1. Marketing Strategy 17.1.6.5.2. Product Strategy 17.1.6.5.3. Channel Strategy 17.1.7. SONAX GmbH 17.1.7.1. Overview 17.1.7.2. Product Portfolio 17.1.7.3. Profitability by Market Segments 17.1.7.4. Sales Footprint 17.1.7.5. Strategy Overview 17.1.7.5.1. Marketing Strategy 17.1.7.5.2. Product Strategy 17.1.7.5.3. Channel Strategy 17.1.8. Malco Products Inc 17.1.8.1. Overview 17.1.8.2. Product Portfolio 17.1.8.3. Profitability by Market Segments 17.1.8.4. Sales Footprint 17.1.8.5. Strategy Overview 17.1.8.5.1. Marketing Strategy 17.1.8.5.2. Product Strategy 17.1.8.5.3. Channel Strategy 17.1.9. Koch-Chemie GmbH 17.1.9.1. Overview 17.1.9.2. Product Portfolio 17.1.9.3. Profitability by Market Segments 17.1.9.4. Sales Footprint 17.1.9.5. Strategy Overview 17.1.9.5.1. Marketing Strategy 17.1.9.5.2. Product Strategy 17.1.9.5.3. Channel Strategy 17.1.10. Mothers Polishes Wax Cleaners Inc 17.1.10.1. Overview 17.1.10.2. Product Portfolio 17.1.10.3. Profitability by Market Segments 17.1.10.4. Sales Footprint 17.1.10.5. Strategy Overview 17.1.10.5.1. Marketing Strategy 17.1.10.5.2. Product Strategy 17.1.10.5.3. Channel Strategy 17.1.11. Koster Keunen Inc 17.1.11.1. Overview 17.1.11.2. Product Portfolio 17.1.11.3. Profitability by Market Segments 17.1.11.4. Sales Footprint 17.1.11.5. Strategy Overview 17.1.11.5.1. Marketing Strategy 17.1.11.5.2. Product Strategy 17.1.11.5.3. Channel Strategy 17.1.12. The Darent Wax Company Ltd. 17.1.12.1. Overview 17.1.12.2. Product Portfolio 17.1.12.3. Profitability by Market Segments 17.1.12.4. Sales Footprint 17.1.12.5. Strategy Overview 17.1.12.5.1. Marketing Strategy 17.1.12.5.2. Product Strategy 17.1.12.5.3. Channel Strategy 17.1.13. Future Developments (Manufacturing) Ltd. 17.1.13.1. Overview 17.1.13.2. Product Portfolio 17.1.13.3. Profitability by Market Segments 17.1.13.4. Sales Footprint 17.1.13.5. Strategy Overview 17.1.13.5.1. Marketing Strategy 17.1.13.5.2. Product Strategy 17.1.13.5.3. Channel Strategy 17.1.14. Northern Labs Inc. 17.1.14.1. Overview 17.1.14.2. Product Portfolio 17.1.14.3. Profitability by Market Segments 17.1.14.4. Sales Footprint 17.1.14.5. Strategy Overview 17.1.14.5.1. Marketing Strategy 17.1.14.5.2. Product Strategy 17.1.14.5.3. Channel Strategy 17.1.15. CRC Industries 17.1.15.1. Overview 17.1.15.2. Product Portfolio 17.1.15.3. Profitability by Market Segments 17.1.15.4. Sales Footprint 17.1.15.5. Strategy Overview 17.1.15.5.1. Marketing Strategy 17.1.15.5.2. Product Strategy 17.1.15.5.3. Channel Strategy 17.1.16. Sasol Ltd 17.1.16.1. Overview 17.1.16.2. Product Portfolio 17.1.16.3. Profitability by Market Segments 17.1.16.4. Sales Footprint 17.1.16.5. Strategy Overview 17.1.16.5.1. Marketing Strategy 17.1.16.5.2. Product Strategy 17.1.16.5.3. Channel Strategy 17.1.17. Altro Limited 17.1.17.1. Overview 17.1.17.2. Product Portfolio 17.1.17.3. Profitability by Market Segments 17.1.17.4. Sales Footprint 17.1.17.5. Strategy Overview 17.1.17.5.1. Marketing Strategy 17.1.17.5.2. Product Strategy 17.1.17.5.3. Channel Strategy 17.1.18. Turtle Wax Inc 17.1.18.1. Overview 17.1.18.2. Product Portfolio 17.1.18.3. Profitability by Market Segments 17.1.18.4. Sales Footprint 17.1.18.5. Strategy Overview 17.1.18.5.1. Marketing Strategy 17.1.18.5.2. Product Strategy 17.1.18.5.3. Channel Strategy 17.1.19. DuPont de Nemours, Inc 17.1.19.1. Overview 17.1.19.2. Product Portfolio 17.1.19.3. Profitability by Market Segments 17.1.19.4. Sales Footprint 17.1.19.5. Strategy Overview 17.1.19.5.1. Marketing Strategy 17.1.19.5.2. Product Strategy 17.1.19.5.3. Channel Strategy 18. Assumptions & Acronyms Used 19. Research Methodology
Let us know your requirement to get
100% FREE customization
List of Tables
Table 1: Global Market Value (US$ Million) Forecast by Region, 2017 to 2033 Table 2: Global Market Volume (Tons) Forecast by Region, 2017 to 2033 Table 3: Global Market Value (US$ Million) Forecast by Product Type, 2017 to 2033 Table 4: Global Market Volume (Tons) Forecast by Product Type, 2017 to 2033 Table 5: Global Market Value (US$ Million) Forecast by Vehicle Type, 2017 to 2033 Table 6: Global Market Volume (Tons) Forecast by Vehicle Type, 2017 to 2033 Table 7: Global Market Value (US$ Million) Forecast by Sales Channel, 2017 to 2033 Table 8: Global Market Volume (Tons) Forecast by Sales Channel, 2017 to 2033 Table 9: North America Market Value (US$ Million) Forecast by Country, 2017 to 2033 Table 10: North America Market Volume (Tons) Forecast by Country, 2017 to 2033 Table 11: North America Market Value (US$ Million) Forecast by Product Type, 2017 to 2033 Table 12: North America Market Volume (Tons) Forecast by Product Type, 2017 to 2033 Table 13: North America Market Value (US$ Million) Forecast by Vehicle Type, 2017 to 2033 Table 14: North America Market Volume (Tons) Forecast by Vehicle Type, 2017 to 2033 Table 15: North America Market Value (US$ Million) Forecast by Sales Channel, 2017 to 2033 Table 16: North America Market Volume (Tons) Forecast by Sales Channel, 2017 to 2033 Table 17: Latin America Market Value (US$ Million) Forecast by Country, 2017 to 2033 Table 18: Latin America Market Volume (Tons) Forecast by Country, 2017 to 2033 Table 19: Latin America Market Value (US$ Million) Forecast by Product Type, 2017 to 2033 Table 20: Latin America Market Volume (Tons) Forecast by Product Type, 2017 to 2033 Table 21: Latin America Market Value (US$ Million) Forecast by Vehicle Type, 2017 to 2033 Table 22: Latin America Market Volume (Tons) Forecast by Vehicle Type, 2017 to 2033 Table 23: Latin America Market Value (US$ Million) Forecast by Sales Channel, 2017 to 2033 Table 24: Latin America Market Volume (Tons) Forecast by Sales Channel, 2017 to 2033 Table 25: Europe Market Value (US$ Million) Forecast by Country, 2017 to 2033 Table 26: Europe Market Volume (Tons) Forecast by Country, 2017 to 2033 Table 27: Europe Market Value (US$ Million) Forecast by Product Type, 2017 to 2033 Table 28: Europe Market Volume (Tons) Forecast by Product Type, 2017 to 2033 Table 29: Europe Market Value (US$ Million) Forecast by Vehicle Type, 2017 to 2033 Table 30: Europe Market Volume (Tons) Forecast by Vehicle Type, 2017 to 2033 Table 31: Europe Market Value (US$ Million) Forecast by Sales Channel, 2017 to 2033 Table 32: Europe Market Volume (Tons) Forecast by Sales Channel, 2017 to 2033 Table 33: East Asia Market Value (US$ Million) Forecast by Country, 2017 to 2033 Table 34: East Asia Market Volume (Tons) Forecast by Country, 2017 to 2033 Table 35: East Asia Market Value (US$ Million) Forecast by Product Type, 2017 to 2033 Table 36: East Asia Market Volume (Tons) Forecast by Product Type, 2017 to 2033 Table 37: East Asia Market Value (US$ Million) Forecast by Vehicle Type, 2017 to 2033 Table 38: East Asia Market Volume (Tons) Forecast by Vehicle Type, 2017 to 2033 Table 39: East Asia Market Value (US$ Million) Forecast by Sales Channel, 2017 to 2033 Table 40: East Asia Market Volume (Tons) Forecast by Sales Channel, 2017 to 2033 Table 41: South Asia Pacific Market Value (US$ Million) Forecast by Country, 2017 to 2033 Table 42: South Asia Pacific Market Volume (Tons) Forecast by Country, 2017 to 2033 Table 43: South Asia Pacific Market Value (US$ Million) Forecast by Product Type, 2017 to 2033 Table 44: South Asia Pacific Market Volume (Tons) Forecast by Product Type, 2017 to 2033 Table 45: South Asia Pacific Market Value (US$ Million) Forecast by Vehicle Type, 2017 to 2033 Table 46: South Asia Pacific Market Volume (Tons) Forecast by Vehicle Type, 2017 to 2033 Table 47: South Asia Pacific Market Value (US$ Million) Forecast by Sales Channel, 2017 to 2033 Table 48: South Asia Pacific Market Volume (Tons) Forecast by Sales Channel, 2017 to 2033 Table 49: Middle East and Africa Market Value (US$ Million) Forecast by Country, 2017 to 2033 Table 50: Middle East and Africa Market Volume (Tons) Forecast by Country, 2017 to 2033 Table 51: Middle East and Africa Market Value (US$ Million) Forecast by Product Type, 2017 to 2033 Table 52: Middle East and Africa Market Volume (Tons) Forecast by Product Type, 2017 to 2033 Table 53: Middle East and Africa Market Value (US$ Million) Forecast by Vehicle Type, 2017 to 2033 Table 54: Middle East and Africa Market Volume (Tons) Forecast by Vehicle Type, 2017 to 2033 Table 55: Middle East and Africa Market Value (US$ Million) Forecast by Sales Channel, 2017 to 2033 Table 56: Middle East and Africa Market Volume (Tons) Forecast by Sales Channel, 2017 to 2033
Find your sweet spots for generating winning opportunities in this market.
Talk to AnalystList of Charts
Figure 1: Global Market Value (US$ Million) by Product Type, 2023 to 2033 Figure 2: Global Market Value (US$ Million) by Vehicle Type, 2023 to 2033 Figure 3: Global Market Value (US$ Million) by Sales Channel, 2023 to 2033 Figure 4: Global Market Value (US$ Million) by Region, 2023 to 2033 Figure 5: Global Market Value (US$ Million) Analysis by Region, 2017 to 2033 Figure 6: Global Market Volume (Tons) Analysis by Region, 2017 to 2033 Figure 7: Global Market Value Share (%) and BPS Analysis by Region, 2023 to 2033 Figure 8: Global Market Y-o-Y Growth (%) Projections by Region, 2023 to 2033 Figure 9: Global Market Value (US$ Million) Analysis by Product Type, 2017 to 2033 Figure 10: Global Market Volume (Tons) Analysis by Product Type, 2017 to 2033 Figure 11: Global Market Value Share (%) and BPS Analysis by Product Type, 2023 to 2033 Figure 12: Global Market Y-o-Y Growth (%) Projections by Product Type, 2023 to 2033 Figure 13: Global Market Value (US$ Million) Analysis by Vehicle Type, 2017 to 2033 Figure 14: Global Market Volume (Tons) Analysis by Vehicle Type, 2017 to 2033 Figure 15: Global Market Value Share (%) and BPS Analysis by Vehicle Type, 2023 to 2033 Figure 16: Global Market Y-o-Y Growth (%) Projections by Vehicle Type, 2023 to 2033 Figure 17: Global Market Value (US$ Million) Analysis by Sales Channel, 2017 to 2033 Figure 18: Global Market Volume (Tons) Analysis by Sales Channel, 2017 to 2033 Figure 19: Global Market Value Share (%) and BPS Analysis by Sales Channel, 2023 to 2033 Figure 20: Global Market Y-o-Y Growth (%) Projections by Sales Channel, 2023 to 2033 Figure 21: Global Market Attractiveness by Product Type, 2023 to 2033 Figure 22: Global Market Attractiveness by Vehicle Type, 2023 to 2033 Figure 23: Global Market Attractiveness by Sales Channel, 2023 to 2033 Figure 24: Global Market Attractiveness by Region, 2023 to 2033 Figure 25: North America Market Value (US$ Million) by Product Type, 2023 to 2033 Figure 26: North America Market Value (US$ Million) by Vehicle Type, 2023 to 2033 Figure 27: North America Market Value (US$ Million) by Sales Channel, 2023 to 2033 Figure 28: North America Market Value (US$ Million) by Country, 2023 to 2033 Figure 29: North America Market Value (US$ Million) Analysis by Country, 2017 to 2033 Figure 30: North America Market Volume (Tons) Analysis by Country, 2017 to 2033 Figure 31: North America Market Value Share (%) and BPS Analysis by Country, 2023 to 2033 Figure 32: North America Market Y-o-Y Growth (%) Projections by Country, 2023 to 2033 Figure 33: North America Market Value (US$ Million) Analysis by Product Type, 2017 to 2033 Figure 34: North America Market Volume (Tons) Analysis by Product Type, 2017 to 2033 Figure 35: North America Market Value Share (%) and BPS Analysis by Product Type, 2023 to 2033 Figure 36: North America Market Y-o-Y Growth (%) Projections by Product Type, 2023 to 2033 Figure 37: North America Market Value (US$ Million) Analysis by Vehicle Type, 2017 to 2033 Figure 38: North America Market Volume (Tons) Analysis by Vehicle Type, 2017 to 2033 Figure 39: North America Market Value Share (%) and BPS Analysis by Vehicle Type, 2023 to 2033 Figure 40: North America Market Y-o-Y Growth (%) Projections by Vehicle Type, 2023 to 2033 Figure 41: North America Market Value (US$ Million) Analysis by Sales Channel, 2017 to 2033 Figure 42: North America Market Volume (Tons) Analysis by Sales Channel, 2017 to 2033 Figure 43: North America Market Value Share (%) and BPS Analysis by Sales Channel, 2023 to 2033 Figure 44: North America Market Y-o-Y Growth (%) Projections by Sales Channel, 2023 to 2033 Figure 45: North America Market Attractiveness by Product Type, 2023 to 2033 Figure 46: North America Market Attractiveness by Vehicle Type, 2023 to 2033 Figure 47: North America Market Attractiveness by Sales Channel, 2023 to 2033 Figure 48: North America Market Attractiveness by Country, 2023 to 2033 Figure 49: Latin America Market Value (US$ Million) by Product Type, 2023 to 2033 Figure 50: Latin America Market Value (US$ Million) by Vehicle Type, 2023 to 2033 Figure 51: Latin America Market Value (US$ Million) by Sales Channel, 2023 to 2033 Figure 52: Latin America Market Value (US$ Million) by Country, 2023 to 2033 Figure 53: Latin America Market Value (US$ Million) Analysis by Country, 2017 to 2033 Figure 54: Latin America Market Volume (Tons) Analysis by Country, 2017 to 2033 Figure 55: Latin America Market Value Share (%) and BPS Analysis by Country, 2023 to 2033 Figure 56: Latin America Market Y-o-Y Growth (%) Projections by Country, 2023 to 2033 Figure 57: Latin America Market Value (US$ Million) Analysis by Product Type, 2017 to 2033 Figure 58: Latin America Market Volume (Tons) Analysis by Product Type, 2017 to 2033 Figure 59: Latin America Market Value Share (%) and BPS Analysis by Product Type, 2023 to 2033 Figure 60: Latin America Market Y-o-Y Growth (%) Projections by Product Type, 2023 to 2033 Figure 61: Latin America Market Value (US$ Million) Analysis by Vehicle Type, 2017 to 2033 Figure 62: Latin America Market Volume (Tons) Analysis by Vehicle Type, 2017 to 2033 Figure 63: Latin America Market Value Share (%) and BPS Analysis by Vehicle Type, 2023 to 2033 Figure 64: Latin America Market Y-o-Y Growth (%) Projections by Vehicle Type, 2023 to 2033 Figure 65: Latin America Market Value (US$ Million) Analysis by Sales Channel, 2017 to 2033 Figure 66: Latin America Market Volume (Tons) Analysis by Sales Channel, 2017 to 2033 Figure 67: Latin America Market Value Share (%) and BPS Analysis by Sales Channel, 2023 to 2033 Figure 68: Latin America Market Y-o-Y Growth (%) Projections by Sales Channel, 2023 to 2033 Figure 69: Latin America Market Attractiveness by Product Type, 2023 to 2033 Figure 70: Latin America Market Attractiveness by Vehicle Type, 2023 to 2033 Figure 71: Latin America Market Attractiveness by Sales Channel, 2023 to 2033 Figure 72: Latin America Market Attractiveness by Country, 2023 to 2033 Figure 73: Europe Market Value (US$ Million) by Product Type, 2023 to 2033 Figure 74: Europe Market Value (US$ Million) by Vehicle Type, 2023 to 2033 Figure 75: Europe Market Value (US$ Million) by Sales Channel, 2023 to 2033 Figure 76: Europe Market Value (US$ Million) by Country, 2023 to 2033 Figure 77: Europe Market Value (US$ Million) Analysis by Country, 2017 to 2033 Figure 78: Europe Market Volume (Tons) Analysis by Country, 2017 to 2033 Figure 79: Europe Market Value Share (%) and BPS Analysis by Country, 2023 to 2033 Figure 80: Europe Market Y-o-Y Growth (%) Projections by Country, 2023 to 2033 Figure 81: Europe Market Value (US$ Million) Analysis by Product Type, 2017 to 2033 Figure 82: Europe Market Volume (Tons) Analysis by Product Type, 2017 to 2033 Figure 83: Europe Market Value Share (%) and BPS Analysis by Product Type, 2023 to 2033 Figure 84: Europe Market Y-o-Y Growth (%) Projections by Product Type, 2023 to 2033 Figure 85: Europe Market Value (US$ Million) Analysis by Vehicle Type, 2017 to 2033 Figure 86: Europe Market Volume (Tons) Analysis by Vehicle Type, 2017 to 2033 Figure 87: Europe Market Value Share (%) and BPS Analysis by Vehicle Type, 2023 to 2033 Figure 88: Europe Market Y-o-Y Growth (%) Projections by Vehicle Type, 2023 to 2033 Figure 89: Europe Market Value (US$ Million) Analysis by Sales Channel, 2017 to 2033 Figure 90: Europe Market Volume (Tons) Analysis by Sales Channel, 2017 to 2033 Figure 91: Europe Market Value Share (%) and BPS Analysis by Sales Channel, 2023 to 2033 Figure 92: Europe Market Y-o-Y Growth (%) Projections by Sales Channel, 2023 to 2033 Figure 93: Europe Market Attractiveness by Product Type, 2023 to 2033 Figure 94: Europe Market Attractiveness by Vehicle Type, 2023 to 2033 Figure 95: Europe Market Attractiveness by Sales Channel, 2023 to 2033 Figure 96: Europe Market Attractiveness by Country, 2023 to 2033 Figure 97: East Asia Market Value (US$ Million) by Product Type, 2023 to 2033 Figure 98: East Asia Market Value (US$ Million) by Vehicle Type, 2023 to 2033 Figure 99: East Asia Market Value (US$ Million) by Sales Channel, 2023 to 2033 Figure 100: East Asia Market Value (US$ Million) by Country, 2023 to 2033 Figure 101: East Asia Market Value (US$ Million) Analysis by Country, 2017 to 2033 Figure 102: East Asia Market Volume (Tons) Analysis by Country, 2017 to 2033 Figure 103: East Asia Market Value Share (%) and BPS Analysis by Country, 2023 to 2033 Figure 104: East Asia Market Y-o-Y Growth (%) Projections by Country, 2023 to 2033 Figure 105: East Asia Market Value (US$ Million) Analysis by Product Type, 2017 to 2033 Figure 106: East Asia Market Volume (Tons) Analysis by Product Type, 2017 to 2033 Figure 107: East Asia Market Value Share (%) and BPS Analysis by Product Type, 2023 to 2033 Figure 108: East Asia Market Y-o-Y Growth (%) Projections by Product Type, 2023 to 2033 Figure 109: East Asia Market Value (US$ Million) Analysis by Vehicle Type, 2017 to 2033 Figure 110: East Asia Market Volume (Tons) Analysis by Vehicle Type, 2017 to 2033 Figure 111: East Asia Market Value Share (%) and BPS Analysis by Vehicle Type, 2023 to 2033 Figure 112: East Asia Market Y-o-Y Growth (%) Projections by Vehicle Type, 2023 to 2033 Figure 113: East Asia Market Value (US$ Million) Analysis by Sales Channel, 2017 to 2033 Figure 114: East Asia Market Volume (Tons) Analysis by Sales Channel, 2017 to 2033 Figure 115: East Asia Market Value Share (%) and BPS Analysis by Sales Channel, 2023 to 2033 Figure 116: East Asia Market Y-o-Y Growth (%) Projections by Sales Channel, 2023 to 2033 Figure 117: East Asia Market Attractiveness by Product Type, 2023 to 2033 Figure 118: East Asia Market Attractiveness by Vehicle Type, 2023 to 2033 Figure 119: East Asia Market Attractiveness by Sales Channel, 2023 to 2033 Figure 120: East Asia Market Attractiveness by Country, 2023 to 2033 Figure 121: South Asia Pacific Market Value (US$ Million) by Product Type, 2023 to 2033 Figure 122: South Asia Pacific Market Value (US$ Million) by Vehicle Type, 2023 to 2033 Figure 123: South Asia Pacific Market Value (US$ Million) by Sales Channel, 2023 to 2033 Figure 124: South Asia Pacific Market Value (US$ Million) by Country, 2023 to 2033 Figure 125: South Asia Pacific Market Value (US$ Million) Analysis by Country, 2017 to 2033 Figure 126: South Asia Pacific Market Volume (Tons) Analysis by Country, 2017 to 2033 Figure 127: South Asia Pacific Market Value Share (%) and BPS Analysis by Country, 2023 to 2033 Figure 128: South Asia Pacific Market Y-o-Y Growth (%) Projections by Country, 2023 to 2033 Figure 129: South Asia Pacific Market Value (US$ Million) Analysis by Product Type, 2017 to 2033 Figure 130: South Asia Pacific Market Volume (Tons) Analysis by Product Type, 2017 to 2033 Figure 131: South Asia Pacific Market Value Share (%) and BPS Analysis by Product Type, 2023 to 2033 Figure 132: South Asia Pacific Market Y-o-Y Growth (%) Projections by Product Type, 2023 to 2033 Figure 133: South Asia Pacific Market Value (US$ Million) Analysis by Vehicle Type, 2017 to 2033 Figure 134: South Asia Pacific Market Volume (Tons) Analysis by Vehicle Type, 2017 to 2033 Figure 135: South Asia Pacific Market Value Share (%) and BPS Analysis by Vehicle Type, 2023 to 2033 Figure 136: South Asia Pacific Market Y-o-Y Growth (%) Projections by Vehicle Type, 2023 to 2033 Figure 137: South Asia Pacific Market Value (US$ Million) Analysis by Sales Channel, 2017 to 2033 Figure 138: South Asia Pacific Market Volume (Tons) Analysis by Sales Channel, 2017 to 2033 Figure 139: South Asia Pacific Market Value Share (%) and BPS Analysis by Sales Channel, 2023 to 2033 Figure 140: South Asia Pacific Market Y-o-Y Growth (%) Projections by Sales Channel, 2023 to 2033 Figure 141: South Asia Pacific Market Attractiveness by Product Type, 2023 to 2033 Figure 142: South Asia Pacific Market Attractiveness by Vehicle Type, 2023 to 2033 Figure 143: South Asia Pacific Market Attractiveness by Sales Channel, 2023 to 2033 Figure 144: South Asia Pacific Market Attractiveness by Country, 2023 to 2033 Figure 145: Middle East and Africa Market Value (US$ Million) by Product Type, 2023 to 2033 Figure 146: Middle East and Africa Market Value (US$ Million) by Vehicle Type, 2023 to 2033 Figure 147: Middle East and Africa Market Value (US$ Million) by Sales Channel, 2023 to 2033 Figure 148: Middle East and Africa Market Value (US$ Million) by Country, 2023 to 2033 Figure 149: Middle East and Africa Market Value (US$ Million) Analysis by Country, 2017 to 2033 Figure 150: Middle East and Africa Market Volume (Tons) Analysis by Country, 2017 to 2033 Figure 151: Middle East and Africa Market Value Share (%) and BPS Analysis by Country, 2023 to 2033 Figure 152: Middle East and Africa Market Y-o-Y Growth (%) Projections by Country, 2023 to 2033 Figure 153: Middle East and Africa Market Value (US$ Million) Analysis by Product Type, 2017 to 2033 Figure 154: Middle East and Africa Market Volume (Tons) Analysis by Product Type, 2017 to 2033 Figure 155: Middle East and Africa Market Value Share (%) and BPS Analysis by Product Type, 2023 to 2033 Figure 156: Middle East and Africa Market Y-o-Y Growth (%) Projections by Product Type, 2023 to 2033 Figure 157: Middle East and Africa Market Value (US$ Million) Analysis by Vehicle Type, 2017 to 2033 Figure 158: Middle East and Africa Market Volume (Tons) Analysis by Vehicle Type, 2017 to 2033 Figure 159: Middle East and Africa Market Value Share (%) and BPS Analysis by Vehicle Type, 2023 to 2033 Figure 160: Middle East and Africa Market Y-o-Y Growth (%) Projections by Vehicle Type, 2023 to 2033 Figure 161: Middle East and Africa Market Value (US$ Million) Analysis by Sales Channel, 2017 to 2033 Figure 162: Middle East and Africa Market Volume (Tons) Analysis by Sales Channel, 2017 to 2033 Figure 163: Middle East and Africa Market Value Share (%) and BPS Analysis by Sales Channel, 2023 to 2033 Figure 164: Middle East and Africa Market Y-o-Y Growth (%) Projections by Sales Channel, 2023 to 2033 Figure 165: Middle East and Africa Market Attractiveness by Product Type, 2023 to 2033 Figure 166: Middle East and Africa Market Attractiveness by Vehicle Type, 2023 to 2033 Figure 167: Middle East and Africa Market Attractiveness by Sales Channel, 2023 to 2033 Figure 168: Middle East and Africa Market Attractiveness by Country, 2023 to 2033
Need specific information?
Request CustomizationExplore Chemicals & Materials Insights
View Reports