The ASEAN automotive aftermarket is projected to grow from USD 28.8 billion in 2025 to approximately USD 63.9 billion by 2035, recording an absolute increase of USD 35.1 billion over the forecast period. This translates into a total growth of 121.9%, with the market forecast to expand at a compound annual growth rate (CAGR) of 8.3% between 2025 and 2035. The overall market size is expected to grow by nearly 2.2X during the same period, supported by increasing vehicle parc, rising vehicle age, growing urbanization, and expanding middle-class population across ASEAN countries.
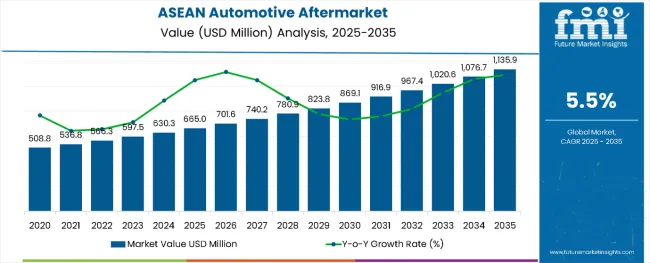
Between 2025 and 2030, the ASEAN automotive aftermarket is projected to expand from USD 28.8 billion to USD 43.2 billion, resulting in a value increase of USD 14.4 billion, which represents 41.0% of the total forecast growth for the decade. This phase of growth will be shaped by rising vehicle ownership, increasing consumer preference for vehicle maintenance, and growing availability of aftermarket products through digital channels. Automotive aftermarket companies are expanding their product portfolios and distribution networks to address the growing demand for quality replacement parts and maintenance services.
| Metric | Value |
|---|---|
| Estimated ASEAN Automotive Aftermarket Value in 2025 | USD 28.8 billion |
| Projected ASEAN Automotive Aftermarket Value in 2035 | USD 63.9 billion |
| Forecast CAGR (2025 to 2035) | 8.30% |
From 2030 to 2035, the market is forecast to grow from USD 43.2 billion to USD 63.9 billion, adding another USD 20.7 billion, which constitutes 59.0% of the overall ten-year expansion. This period is expected to be characterized by expansion of e-commerce platforms, integration of digital technologies in service delivery, and development of smart automotive components. The growing adoption of connected vehicles and advanced automotive technologies will drive demand for sophisticated aftermarket products with enhanced performance capabilities.
Between 2020 and 2025, the ASEAN automotive aftermarket experienced steady expansion, driven by increasing vehicle parc and growing consumer awareness about vehicle maintenance importance. The market developed as automotive manufacturers and aftermarket suppliers recognized the need for comprehensive service networks to support the growing vehicle population. Digital transformation and online retail channels began gaining prominence, enhancing accessibility of aftermarket products across the region.
Market expansion is being supported by the increasing vehicle ownership rates across ASEAN countries and the corresponding demand for maintenance, repair, and replacement services. Modern consumers are increasingly focused on extending vehicle lifespan through proper maintenance and quality replacement parts. The region's growing middle class and improving economic conditions are driving higher vehicle ownership rates, directly translating to increased aftermarket demand.
The growing emphasis on vehicle safety and performance optimization is driving demand for quality aftermarket products that meet international standards. Consumer preference for cost-effective maintenance solutions compared to original equipment manufacturer (OEM) alternatives is creating opportunities for innovative aftermarket suppliers. The rising influence of digitalization and e-commerce platforms is also contributing to increased product accessibility and market penetration across different demographics and geographic locations.
The market is segmented by vehicle type, product type, distribution channel, and service type. By vehicle type, the market is divided into passenger cars, commercial vehicles, and two-wheelers. Based on product type, the market is categorized into engine components, tires, filters, brake systems, electrical & electronics, body parts, lubricants, and others. In terms of distribution channel, the market is segmented into offline/traditional and online/e-commerce. By service type, the market is classified into do-it-for-me (DIFM) and do-it-yourself (DIY).
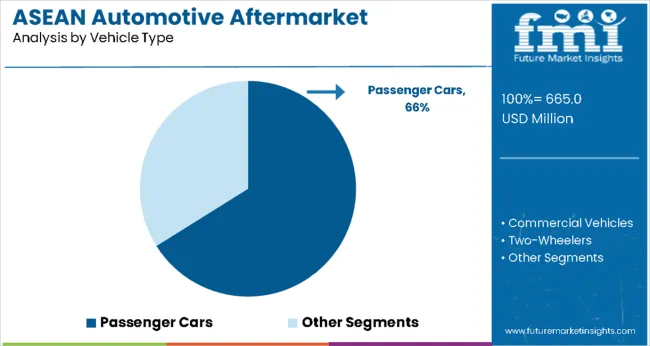
The passenger cars segment is projected to account for 66% of the ASEAN automotive aftermarket in 2025, reaffirming its position as the dominant vehicle category. The growing urban population and increasing disposable income across ASEAN countries are driving passenger car ownership rates. Modern consumers prioritize personal mobility solutions, leading to higher demand for passenger vehicles and corresponding aftermarket services.
This segment forms the foundation of market growth, as passenger cars typically require regular maintenance and replacement parts throughout their operational lifespan. The segment benefits from established service networks, widespread availability of aftermarket products, and consumer familiarity with maintenance requirements. Commercial vehicles account for 22.0% market share, driven by expanding logistics and transportation sectors, while two-wheelers represent 11.9%, supported by their popularity as cost-effective transportation solutions in urban areas.
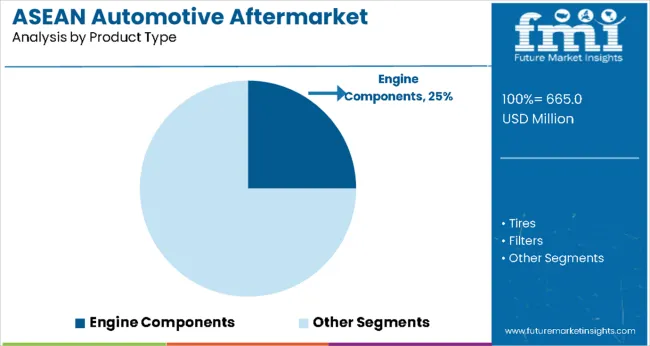
Engine components are projected to represent 25.0% of ASEAN automotive aftermarket demand in 2025, underscoring their critical role in vehicle performance and maintenance. This segment includes essential components such as pistons, cylinders, gaskets, and timing belts that require regular replacement to ensure optimal engine performance. The complexity and importance of engine systems make this segment particularly valuable for aftermarket suppliers.
The segment is supported by the need for regular engine maintenance across all vehicle types and the technical expertise required for proper installation and service. Tires follow with 20.0% market share, driven by wear-and-tear replacement cycles, while filters account for 15.0%, supported by regular maintenance requirements. Brake systems represent 12.0% of the market, emphasizing safety-critical component replacement needs. Electrical & electronics components capture 10.0%, reflecting the growing complexity of modern vehicles.
The ASEAN automotive aftermarket is advancing rapidly due to increasing vehicle parc, growing urbanization, and rising consumer awareness about vehicle maintenance importance. However, the market faces challenges including price competition from low-quality products, regulatory compliance requirements, and the need for technical expertise in installation and service. Innovation in digital platforms and sustainable product development continue to influence market expansion patterns.
The growing adoption of e-commerce platforms is enabling aftermarket suppliers to reach consumers directly and provide comprehensive product information and installation guidance. Online channels offer convenience, competitive pricing, and product comparison capabilities that influence purchasing decisions. Digital marketing and social media presence are driving brand awareness and product adoption, particularly among younger vehicle owners who prefer online shopping experiences for automotive products.
Modern automotive aftermarket suppliers are incorporating advanced technologies such as IoT sensors, predictive maintenance systems, and smart diagnostic tools into their product offerings. These technologies enhance vehicle performance monitoring, enable proactive maintenance scheduling, and provide better user experience. Advanced manufacturing techniques also enable production of high-quality aftermarket products that match or exceed OEM specifications while offering competitive pricing advantages.
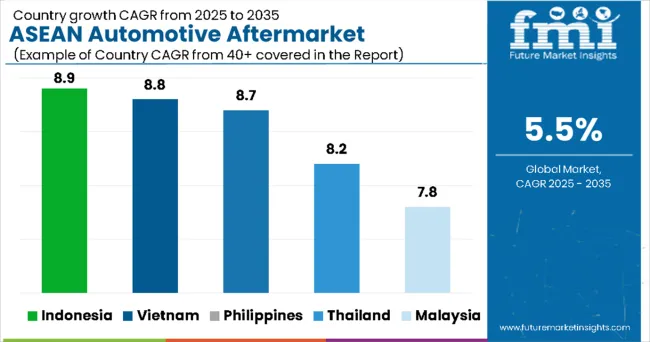
The ASEAN automotive aftermarket demonstrates strong growth potential across major economies with Indonesia showing exceptional expansion through its large vehicle population and growing middle-class consumer base, supported by increasing urbanization rates and expanding automotive infrastructure that creates sustained demand for aftermarket products and services. Vietnam represents significant market opportunities driven by rapid economic development and increasing vehicle ownership rates, with expanding manufacturing capabilities and foreign investment supporting aftermarket industry growth.
Thailand exhibits considerable market presence through its established automotive manufacturing sector and comprehensive aftermarket distribution networks, with companies leveraging the country's position as a regional automotive hub to serve broader ASEAN markets. Philippines shows expanding growth potential through increasing consumer purchasing power and growing awareness of vehicle maintenance importance, while Malaysia demonstrates steady market development supported by established automotive infrastructure and consumer preference for quality aftermarket products. Singapore contributes through its role as a regional business hub and gateway for international aftermarket suppliers entering ASEAN markets.
| Country | CAGR (2025-2035) |
|---|---|
| Indonesia | 8.9% |
| Vietnam |
8.8% |
| Philippines | 8.7% |
| Thailand | 8.2% |
| Malaysia | 7.8% |
| Mayanmar | 7.2% |
| Singapore | 7.6% |
The ASEAN automotive aftermarket is experiencing robust growth across all major countries, with Indonesia leading at an 8.9% CAGR through 2035, driven by the largest vehicle population in the region, expanding middle class, and increasing awareness of vehicle maintenance importance. Vietnam matches Indonesia's growth rate at 8.9%, supported by rapid economic development, growing vehicle ownership, and expanding automotive infrastructure. Philippines shows strong growth at 8.7%, emphasizing increasing consumer purchasing power and growing demand for quality aftermarket products.
The report covers an in-depth analysis of 6 key ASEAN countries highlighted below.
Revenue from automotive aftermarket products in Indonesia is projected to exhibit strong growth with a CAGR of 8.9% through 2035, driven by the country's position as the largest automotive market in ASEAN and expanding middle-class consumer base. Indonesia's growing urbanization and increasing disposable income are creating significant demand for vehicle ownership and corresponding aftermarket services. Major international and domestic aftermarket suppliers are establishing comprehensive distribution networks to serve the growing population of vehicle owners across major cities and emerging markets.
Government infrastructure development and improving road networks are driving vehicle usage and corresponding demand for maintenance and replacement products throughout urban and suburban areas.
E-commerce platform growth and digital payment systems are supporting rapid product adoption and brand awareness among tech-savvy consumers seeking convenient aftermarket solutions.
Revenue from automotive aftermarket products in Vietnam is expanding at a CAGR of 8.8%, supported by rapid economic growth, increasing vehicle ownership rates, and expanding manufacturing capabilities. The country's young demographic profile and rising income levels are driving demand for personal transportation and professional vehicle maintenance services. International aftermarket companies and domestic suppliers are establishing manufacturing and distribution facilities to serve the growing demand for quality automotive products.
Rising foreign investment in automotive manufacturing is creating opportunities for aftermarket suppliers to establish local production capabilities and serve regional markets efficiently.
Growing awareness of vehicle safety and performance optimization is driving consumer preference for quality aftermarket products over low-cost alternatives across urban markets.
Demand for automotive aftermarket products in the Philippines is projected to grow at a CAGR of 8.7%, supported by increasing consumer purchasing power, expanding vehicle ownership, and growing awareness of vehicle maintenance importance. Filipino consumers are increasingly focused on vehicle reliability and safety, driving demand for quality replacement parts and professional maintenance services. The market is characterized by growing preference for established brands and certified aftermarket products.
Infrastructure development and expanding transportation networks are driving vehicle usage and corresponding demand for maintenance products across urban and provincial markets.
Growing middle-class population and increasing access to financing are supporting vehicle ownership growth and creating sustained demand for aftermarket products and services.
Revenue from automotive aftermarket products in Thailand is projected to grow at a CAGR of 8.2% through 2035, driven by the country's established position as a regional automotive manufacturing hub and comprehensive aftermarket infrastructure. Thai consumers consistently demand high-quality products and professional services, creating opportunities for premium aftermarket suppliers and service providers.
Ongoing investment in automotive technology and manufacturing capabilities is supporting advanced aftermarket product development and regional export opportunities for Thai-based companies.
Collaboration between automotive manufacturers and aftermarket suppliers is enhancing product innovation and quality standards, reinforcing Thailand's position as a regional aftermarket leader.
Revenue from automotive aftermarket products in Malaysia is projected to grow at a CAGR of 7.8% through 2035, supported by established automotive infrastructure, consumer preference for quality products, and comprehensive distribution networks. Malaysian consumers value product reliability, brand reputation, and professional installation services, positioning quality aftermarket products as preferred solutions for vehicle maintenance needs.
Growth in organized retail channels and professional service networks is increasing accessibility of quality aftermarket products across diverse consumer demographics and geographic regions.
Rising demand for eco-friendly and efficient automotive products is encouraging aftermarket suppliers to develop sustainable solutions that meet environmental standards and consumer preferences.
Revenue from automotive aftermarket products in Singapore is projected to grow at a CAGR of 7.6% through 2035, supported by the country's role as a regional business hub and gateway for international aftermarket suppliers. Singapore's sophisticated consumers prioritize product quality, brand reputation, and comprehensive service support, creating opportunities for premium aftermarket products and services.
Strategic location and advanced logistics infrastructure are supporting Singapore's role as a regional distribution center for aftermarket products serving broader ASEAN markets efficiently.
High standards for vehicle safety and emissions are driving demand for certified aftermarket products that meet stringent regulatory requirements and consumer quality expectations.
Revenue from automotive aftermarket products in Myanmar is projected to grow at the highest CAGR of 7.2% through 2035, driven by the country's emerging automotive market and increasing vehicle ownership rates following economic reforms. Myanmar's growing middle class and improving infrastructure are creating significant demand for reliable transportation solutions and corresponding aftermarket services. International aftermarket suppliers are exploring market entry opportunities to serve the expanding consumer base seeking quality automotive products.
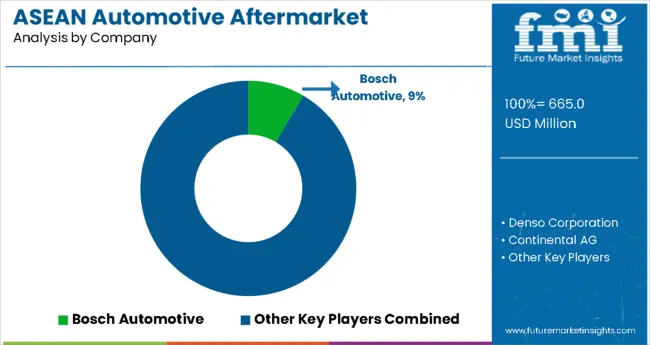
The ASEAN automotive aftermarket is characterized by competition among global automotive suppliers, regional manufacturers, and local distributors. Companies are investing in product innovation, distribution network expansion, digital marketing strategies, and customer service capabilities to deliver reliable, accessible, and cost-effective aftermarket solutions. Brand reputation, product quality, and service support are central to strengthening market position and customer loyalty.
Bosch Automotive leads the market with 8.5% regional market share, offering comprehensive aftermarket product portfolios with focus on quality, innovation, and customer support across multiple product categories. Denso Corporation provides advanced automotive components with emphasis on performance and reliability. Continental AG delivers integrated aftermarket solutions combining traditional products with digital technologies. Aisin Seiki Co. Ltd. focuses on powertrain and chassis components with strong OEM relationships translating to aftermarket credibility.
Federal-Mogul offers comprehensive engine and powertrain solutions with global manufacturing capabilities and regional distribution networks. Hella GmbH & Co. KGaA provides lighting and electronic components with focus on innovation and quality. NGK Spark Plugs specializes in ignition and sensor technologies with strong brand recognition. Bridgestone and Michelin dominate tire aftermarket segments with comprehensive product ranges and service networks. AC Delco provides broad aftermarket product portfolios with General Motors backing and established distribution channels.
Bosch Automotive
Denso Corporation
Continental AG
Aisin Seiki Co. Ltd.
Federal-Mogul
Hella GmbH & Co. KGaA
NGK Spark Plugs
Bridgestone
Michelin
AC Delco
| Items | Values |
|---|---|
| Quantitative Units (2025) | USD 28.8 billion |
| Vehicle Type | Passenger Cars, Commercial Vehicles, Two-Wheelers |
| Product Type | Engine Components, Tires, Filters, Brake Systems, Electrical & Electronics, Body Parts, Lubricants, Others |
| Distribution Channel | Offline/Traditional, Online/E-commerce |
| Service Type | Do-It-For-Me (DIFM), Do-It-Yourself (DIY) |
| Regions Covered | ASEAN Countries |
| Countries Covered | Indonesia, Vietnam, Philippines, Thailand, Malaysia, Singapore |
| Key Companies Profiled | Bosch Automotive, Denso Corporation, Continental AG, Aisin Seiki Co. Ltd., Federal-Mogul, Hella GmbH & Co. KGaA, NGK Spark Plugs, Bridgestone, Michelin, AC Delco |
| Additional Attributes | Dollar sales by product category and distribution channel, country demand trends, competitive landscape, consumer preferences for quality versus price, integration with digital platforms and e-commerce solutions, innovations in product development, supply chain optimization, and customer service enhancement |
By Vehicle Type:
Passenger Cars
Commercial Vehicles
Two-Wheelers
By Product Type:
Engine Components
Tires
Filters
Brake Systems
Electrical & Electronics
Body Parts
Lubricants
Others
By Distribution Channel:
Offline/Traditional
Online/E-commerce
By Service Type:
Do-It-For-Me (DIFM)
Do-It-Yourself (DIY)
By Countries:
Indonesia
Vietnam
Philippines
Thailand
Malaysia
Singapore
The ASEAN market is expected to reach USD 63.9 billion by 2035, growing from USD 28.8 billion in 2025, at a CAGR of 8.3% during the forecast period.
Indonesia and Vietnam are projected to grow at the fastest pace, registering a CAGR of 8.9%, driven by rising vehicle ownership, growing middle-class populations, and expanding automotive service networks in both countries.
The passenger vehicles segment is the leading contributor, supported by increasing demand for aftermarket parts and services, rising disposable incomes, and a growing preference for vehicle customization and maintenance across ASEAN markets.
Key drivers include expanding vehicle parc, increasing average vehicle age, rising focus on preventive maintenance, growing e-commerce penetration in auto parts sales, and supportive government policies promoting aftermarket services and localization.
Top companies include Bosch Automotive, Denso Corporation, Continental AG, Aisin Seiki Co. Ltd., Federal-Mogul, Hella GmbH & Co. KGaA, NGK Spark Plugs, Bridgestone, Michelin, and AC Delco, known for their broad product portfolios and strong regional distribution networks.
Table 1: Value (US$ Million) Forecast by Region, 2018 to 2033
Table 2: Value (US$ Million) Forecast by Category Type, 2018 to 2033
Table 3: Value (US$ Million) Forecast by Vehicle Type, 2018 to 2033
Table 4: Value (US$ Million) Forecast by Country, 2018 to 2033
Table 5: Value (US$ Million) Forecast by Category Type, 2018 to 2033
Table 6: Value (US$ Million) Forecast by Vehicle Type, 2018 to 2033
Figure 1: Value (US$ Million) by Category Type, 2023 to 2033
Figure 2: Value (US$ Million) by Vehicle Type, 2023 to 2033
Figure 3: Value (US$ Million) by Region, 2023 to 2033
Figure 4: Value (US$ Million) Analysis by Region, 2018 to 2033
Figure 5: Value Share (%) and BPS Analysis by Region, 2023 to 2033
Figure 6: Y-o-Y Growth (%) Projections by Region, 2023 to 2033
Figure 7: Value (US$ Million) Analysis by Category Type, 2018 to 2033
Figure 8: Value Share (%) and BPS Analysis by Category Type, 2023 to 2033
Figure 9: Y-o-Y Growth (%) Projections by Category Type, 2023 to 2033
Figure 10: Value (US$ Million) Analysis by Vehicle Type, 2018 to 2033
Figure 11: Value Share (%) and BPS Analysis by Vehicle Type, 2023 to 2033
Figure 12: Y-o-Y Growth (%) Projections by Vehicle Type, 2023 to 2033
Figure 13: Attractiveness by Category Type, 2023 to 2033
Figure 14: Attractiveness by Vehicle Type, 2023 to 2033
Figure 15: Attractiveness by Region, 2023 to 2033
Figure 16: Value (US$ Million) by Category Type, 2023 to 2033
Figure 17: Value (US$ Million) by Vehicle Type, 2023 to 2033
Figure 18: Value (US$ Million) by Country, 2023 to 2033
Figure 19: Value (US$ Million) Analysis by Country, 2018 to 2033
Figure 20: Value Share (%) and BPS Analysis by Country, 2023 to 2033
Figure 21: Y-o-Y Growth (%) Projections by Country, 2023 to 2033
Figure 22: Value (US$ Million) Analysis by Category Type, 2018 to 2033
Figure 23: Value Share (%) and BPS Analysis by Category Type, 2023 to 2033
Figure 24: Y-o-Y Growth (%) Projections by Category Type, 2023 to 2033
Figure 25: Value (US$ Million) Analysis by Vehicle Type, 2018 to 2033
Figure 26: Value Share (%) and BPS Analysis by Vehicle Type, 2023 to 2033
Figure 27: Y-o-Y Growth (%) Projections by Vehicle Type, 2023 to 2033
Figure 28: Attractiveness by Category Type, 2023 to 2033
Figure 29: Attractiveness by Vehicle Type, 2023 to 2033
Figure 30: Attractiveness by Country, 2023 to 2033


Full Research Suite comprises of:
Market outlook & trends analysis
Interviews & case studies
Strategic recommendations
Vendor profiles & capabilities analysis
5-year forecasts
8 regions and 60+ country-level data splits
Market segment data splits
12 months of continuous data updates
DELIVERED AS:
PDF EXCEL ONLINE
ASEAN and Gulf Countries MAP & VSP Packaging Market Size and Share Forecast Outlook 2025 to 2035
ASEAN Flexible Plastic Packaging Market Analysis - Size, Share, and Forecast Outlook 2025 to 2035
ASEAN Human Milk Oligosaccharides Market Report – Size, Demand & Growth 2025–2035
ASEAN Probiotic Ingredients Market Outlook – Growth, Size & Forecast 2025–2035
ASEAN Food Additives Market Insights – Growth, Demand & Forecast 2025–2035
ASEAN Chitin Market Analysis – Trends, Demand & Forecast 2025–2035
ASEAN Bakery Mixes Market Outlook – Size, Share & Forecast 2025–2035
ASEAN Non-Alcoholic Malt Beverages Market Trends – Demand & Forecast 2025–2035
ASEAN Animal Feed Alternative Protein Market Insights – Demand, Size & Industry Trends 2025–2035
ASEAN Chickpea Protein Market Trends – Growth, Demand & Forecast 2025–2035
ASEAN Food Testing Services Market Analysis – Size, Share & Forecast 2025–2035
ASEAN Food Emulsifier Market Report – Trends, Demand & Industry Forecast 2025–2035
ASEAN Yeast Market Report – Trends, Demand & Industry Forecast 2025–2035
ASEAN Green and Bio-based Polyol Market Growth – Trends, Demand & Innovations 2025–2035
ASEAN Natural Food Color Market Outlook – Share, Growth & Forecast 2025–2035
ASEAN Coated Fabrics Market Insights – Demand, Size & Industry Trends 2025–2035
ASEAN Barite Market Analysis – Size, Share & Forecast 2025–2035
ASEAN Shrimp Market Trends – Growth, Demand & Forecast 2025–2035
ASEAN Pulses Market Analysis – Size, Share & Forecast 2025–2035
ASEAN Probiotic Strains Market Analysis – Size, Share & Forecast 2025–2035

Thank you!
You will receive an email from our Business Development Manager. Please be sure to check your SPAM/JUNK folder too.
Chat With
MaRIA