Reports
- Global Locations -
Headquarters
Future Market Insights, Inc.
Christiana Corporate, 200
Continental Drive, Suite 401,
Newark, Delaware - 19713,
United States
Americas
Future Market Insights, Inc.
616 Corporate Way, Suite 2-9018,
Valley Cottage, NY 10989, United States
MEA
Future Market Insights
1602-6 Jumeirah Bay X2 Tower, Plot No: JLT-PH2-X2A,
Jumeirah Lakes Towers, Dubai,
United Arab Emirates
Europe
Future Market Insights
3rd Floor, 207 Regent Street,
W1B 3HH London
United Kingdom
Asia Pacific
Future Market Insights
Office No. 401-A, 4th Floor,
VANTAGE 9, S.No. 36/1/1,
Baner, Pune 411045, India
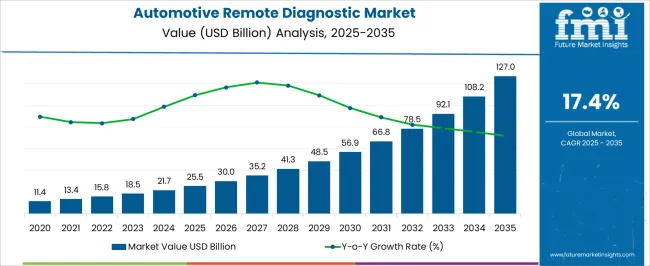
[277 Pages Report] Sales in the global automotive remote diagnostics market are slated to top US$ 11.6 Billion in 2022. Expanding at an impressive 18.9% CAGR, the market size is projected to total US$ 32.9 Billion by 2028.
Attribute | Details |
---|---|
Automotive Remote Diagnostics Market Estimated Size 2022 | US$ 11.6 Billion |
Automotive Remote Diagnostics Market Value-based CAGR (2022-2028) | 18.9% |
Automotive Remote Diagnostics Market Size in Projected 2028 | US$ 32.9 Billion |
The ability of automotive remote diagnostics solutions to monitor vehicles through a wireless network is set to drive the sales in the market. Also, rapid development of Wi-Fi, 4G, or 3G-based platforms for recording data associated with vehicle health in real-time is estimated to propel the market.
Further, many vehicle manufacturers are expected to adopt these solutions to prevent upcoming failures, minimize the service time, and assess the vehicle performance efficiently. In addition, surging production and sales of commercial vehicles and passenger cars is set to boost the growth as these solutions will be used for roadside assistance, automatic crash notification, vehicle health alert system, and vehicle location tracking purpose.
Don't pay for what you don't need
Customize your report by selecting specific countries or regions and save 30%!
Market Statistics | Details |
---|---|
H1,2021 (A) | 17.6% |
H1,2022 Projected (P) | 18.4% |
H1,2022 Outlook (O) | 18.9% |
BPS Change : H1,2022 (O) - H1,2022 (P) | (+) 48 ↑ |
BPS Change : H1,2022 (O) - H1,2021 (A) | (+) 129 ↑ |
Future Market Insights presents a comparison and insightful analysis for the market dynamics along with market trends impacting the growth outlook of the automotive remote diagnostics demand. The market is principally subjected to automotive remote diagnostics systems' ability to monitor automobiles through a wireless network, which is expected to enhance market sales.
In addition, the market is expected to be propelled by the rapid development of Wi-Fi, 4G, or 3G-based systems for capturing data related to vehicle health in real-time. Automotive manufacturers are expected to embrace these solutions in order to prevent future failures, reduce repair time, and accurately measure vehicle performance.
According to FMI analysis, the difference between the BPS values identified in the automotive remote diagnostics market in H1, 2022 - Outlook over H1, 2022 Projected shows a rise of 48 units. Notably, compared to first half 2021, the market is expected to spike by 129 BPS as per the recent estimation.
Key reasons for this change in growth rate is attributed to increased production and sales of commercial vehicles and passenger automobiles. These factors are expected to drive the growth, as these solutions will be used for roadside assistance, vehicle health warning, automatic crash notification system, and vehicle position monitoring.
The market is expected to grow as OEMs place a greater emphasis on collecting useful data and improving vehicle performance. The need for automotive remote diagnostics is expected to rise as they assist in accurately forecasting component problems and drastically minimizing service downtime. Rapid technical improvements, such as telematics integration and the Internet of Things (IoT), are expected to support market expansion.
The automotive remote diagnostics market is expected to register a stupendous 18.9% CAGR between 2022 and 2028, up from 17.1% CAGR recorded during 2013-2021.
The ongoing expansion of the automotive sector is likely to propel the growth in the market over the forthcoming years. According to the International Organization of Motor Vehicle Manufacturers, around 24,372,388 commercial vehicles were sold across the globe in 2020. This number is projected to surge in future, thereby driving the demand for automotive remote diagnostics solutions.
Moreover, rising focus of OEMs on the collection of relevant data and enhancement of vehicle performance is anticipated to boost the market. As automotive remote diagnostics help in effectively predicting component defects and significantly reducing service downtime, their demand is likely to increase.
Apart from that, the rapid technological advancements, such as the integration of telematics and the Internet of Things (IoT) are set to complement the growth in the market. These novel technologies are helping users to interact with connected car eco-systems to provide a comfortable and an improved driving experience.
Driven by the aforementioned factors, the demand for automotive remote diagnostics solutions is projected to surge at a considerable pace over the forecast period.
Rising demand for sports and luxury vehicles across the globe is estimated to augment the market in the near future. For instance, Rolls-Royce Motor Cars, a British luxury automobile maker, exhibited the highest-ever annual sales figures in 2021 in its 117-year history. The company delivered 5,586 vehicles to customers globally.
Further, the urgent need to improve the security and safety of passengers is also expected to propel the market as many car manufacturers are conducting extensive research and development activities. Most of these manufacturers are coming up with state-of-the-art solutions by collaborating with leading software companies.
In December 2021, for instance, Mojio, a leading connected mobility platform teamed up with Audi of America, Inc., which is a premium automotive manufacturer based in the U.S.. Through this collaboration, the company aims to offer Motion for Audi Connect, a dealer-installed connected vehicle solution to customers of Audi.
It would enable customers to use Audi’s telematics-based services, such as stolen vehicle locator, SOS emergency calls, automatic crash notification, and on-demand roadside assistance. Such innovations are expected to boost sales in the forthcoming years.
The ongoing digital transformation of the automotive industry is likely to propel the growth in the U.K. over the forecast period. As per FMI, Europe automotive remote diagnostics market is expected to account for 34.6% of the share in 2022.
The new ecosystem of the U.K. automotive sector contains various OEMs that are consistently striving to deploy the next-generation technologies, such as driver assistance, vehicle management, mobility management, and safety technologies in their vehicles. In addition to this, many new entrants are engaging in mergers and acquisitions to broaden their connected car data services.
In June 2021, Wejo, a connected car data company, merged with Virtuoso Acquisition in a US$ 1.1 billion deal. The company aims to source live data directly from the integrated vehicle sensors across numerous tier 1 auto part suppliers and OEMs, thereby enabling real-time data analysis and collection. Such developments are expected to accelerate the demand for automotive remote diagnostics in the U.K.
Rising development of new solutions by reputed companies in the U.S. to attract more customers through user-friendly policies is estimated to drive the market. North America automotive remote diagnostics market is projected to hold about 30.4% of the share in 2022, says FMI.
For instance, in January 2022, Hyundai Motor America, a wholly owned subsidiary of Hyundai Motor Company based in California, introduced a novel solution to make it easy for lessees and owners of Hyundai vehicles to control, understand, and check how data from their connected cars can be shared, used, and collected. The company aims to provide its customers with a better understanding of their data usage and privacy.
The emergence of Bluetooth technology is anticipated to fuel the market in India as it is set to be extensively used to enable in-car connectivity between electronic gadgets, such as tablets, laptops, and smartphones and a vehicle’s dashboard. South Asia automotive remote diagnostics market is anticipated to procure approximately 3.3% of the share in 2022, predicts FMI.
Besides this, high demand for unique smartphone-related features in vehicles, such as infotainment, diagnostics, and navigation from customers is another factor likely to bolster the market in India.
In January 2022, for instance, Bajaj Auto, multinational two-wheeler and three-wheeler manufacturing company based in Pune, used US-based Sibros’ cloud-based Deep Connected Platform in its Chetak electric scooter fleet.
It will offer safe OTA firmware and software updates, as well as vehicle-to-cloud data insights for battery diagnostics, analytics, and embedded sensors. The launch of such solutions by two-wheeler companies is projected to propel the market in India.
“Introduction of New Remote Car Diagnostics Software Solutions to Propel Sales”
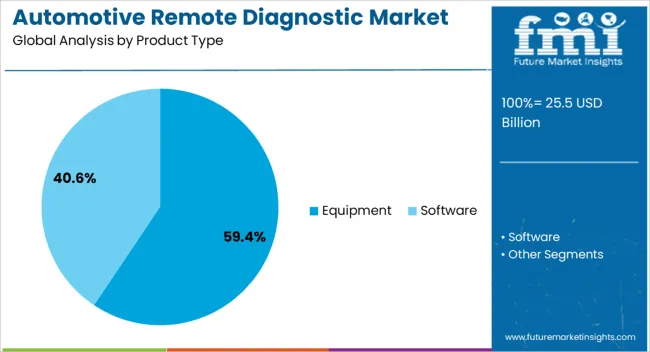
By product type, the software segment is projected to account for a lion’s share in the automotive remote diagnostics market owing to the rapid development of novel software solutions by car manufacturers.
In November 2021, Bosch, a multinational engineering and technology company headquartered in Germany, announced its plan to provide remote OEM diagnostic software capabilities in its diagnostic vehicle communication interface (DVCI) products.
Similarly, Certified Collision Group (CCG) joined hands with Elitek Vehicle Services in August 2021 to provide better service to independent collision repair affiliates. The company is aiming to deliver a mobile on-site diagnostic services solution through this new partnership.
Elitek Vehicle Services will provide the former with vehicle interfaces and OE diagnostic software solutions. These industry developments are anticipated to affect the segment’s growth positively.
“Innovations in the Field of Luxury Vehicles to Drive Demand for Remote Car Diagnostics”
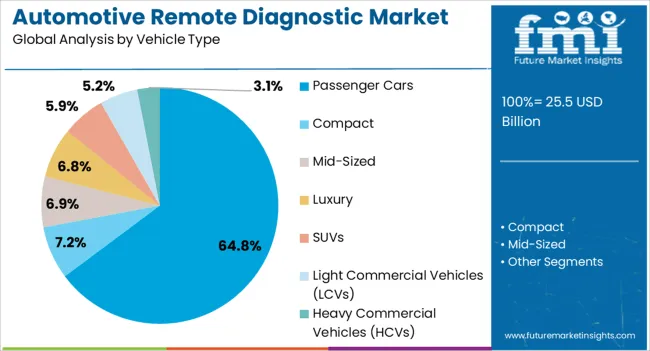
In terms of vehicle type, the luxury segment is anticipated to remain at the forefront in the automotive remote diagnostics market in the forthcoming years. The ongoing development of various innovative remote diagnostics tools by luxury car manufacturers to attract more customers globally is projected to drive the growth in this segment.
In October 2021, Mercedes-Benz Canada, for instance, introduced its latest Virtual Remote Support program, which is powered by Microsoft Dynamics 365 Remote Assist and Microsoft HoloLens 2. The company aims to redefine automotive service and maintenance technician training for more precise and quicker vehicle servicing activities across Canada.
Such innovations are likely to propel the demand for luxury vehicles in the near future.
“Need for Emergency Support to Boost Usage of Remote Diagnostics Tools in Service Assistance Application”
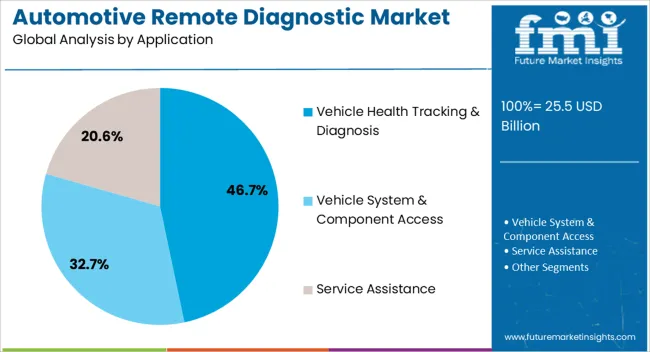
Based on application, the service assistance segment is expected to dominate the automotive remote diagnostics market in terms of share. Growth is attributable to the increasing demand for roadside service assistance as a standard feature in all vehicles worldwide.
In addition, these solutions provide various benefits, such as sending a mechanic in case of critical failure, emergency support, and assistance at the time of a vehicle breakdown. Governments of various countries are also implementing strict norms to compel automobile manufacturers to install service assistance solutions in cars, which is expected to boost the market.
Get the data you need at a Fraction of the cost
Personalize your report by choosing insights you need
and save 40%!
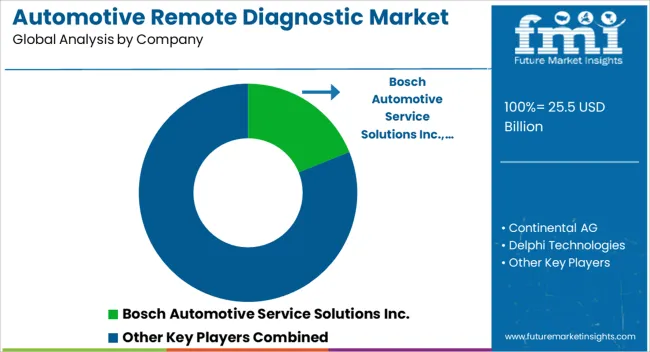
Key players operating in the automotive remote diagnostics market are strategizing to expand their reach across the globe. They are also investing in partnership programs to distribute aftermarket products and improve their supply chain processes. Meanwhile, some of the other players are aiming to enhance their cash flow and earnings in the near future by creating flexible and lean cost structures.
For instance :
Attribute | Details |
---|---|
Forecast Period | 2022 to 2028 |
Historical Data Available for | 2013 to 2021 |
Market Analysis | Units for Volume and US$ Billion for Value |
Key Regions Covered | North America, Latin America, Europe, Oceania, South Asia, East Asia, and the Middle East & Africa. |
Key Countries Covered | United States, Canada, Brazil, Mexico, Germany, UK, France, Italy, Spain, Nordic, Russia, Poland, China, India, Thailand, Indonesia, Australia and New Zealand, Japan, GCC countries, North Africa, South Africa, others. |
Key Market Segments Covered | Product Type, Application, Vehicle Type, and Region |
Key Companies Profiled |
|
Pricing | Available upon Request |
Product Type :
Vehicle Type :
Application :
Region :
1. Executive Summary 1.1. Global Market Outlook 1.2. Industry Overview 1.3. Supply Side Trends 1.4. Technology Roadmap 1.5. Analysis and Recommendations 2. Market Overview 2.1. Market Taxonomy 2.2. Market Definition 3. Key Market Trends 3.1. Key Trends Impacting the Market 4. Global Market Demand Analysis 2013-2021 and Forecast, 2022-2028 4.1. Historical Market Volume (Units) Analysis, 2013-2021 4.2. Current and Future Market Volume (Units) Projections, 2022-2028 4.3. Y-o-Y Growth Trend Analysis 5. Global Market - Pricing Analysis 6. Global Market Demand (in Value or Size in US$ Mn) Analysis 2013-2021 and Forecast, 2022-2028 6.1. Historical Market Value (US$ Mn) Analysis, 2013-2021 6.2. Current and Future Market Value (US$ Mn) Projections, 2022-2028 6.2.1. Y-o-Y Growth Trend Analysis 6.2.2. Absolute $ Opportunity Analysis 7. Market Background 7.1. Macro-Economic Factors 7.1.1. Global GDP Growth Outlook 7.1.2. Global Automotive Production Overview 7.1.3. Global Automotive Fleet Size Overview 7.1.4. Global ICT Spending 7.1.5. Global Technology Adoption Overview 7.2. Forecast Factors - Relevance & Impact 7.2.1. Global GDP Growth Forecast 7.2.2. Global Urbanization Growth Outlook 7.2.3. Automotive Production Rate 7.3. Supply Chain 7.4. Market Dynamics 7.4.1. Drivers 7.4.2. Restraints 7.4.3. Opportunity Analysis 7.5. Primary Survey Analysis 8. Global Market Analysis 2013-2021 and Forecast 2022-2028, by Product Type 8.1. Introduction / Key Findings 8.2. Historical Market Size (US$ Mn) and Volume Analysis By Product Type, 2013 - 2021 8.3. Current and Future Market Size (US$ Mn) and Volume Analysis and Forecast By Product Type, 2022 - 2028 8.3.1. Diagnostic equipment 8.3.2. Software 8.4. Market Attractiveness Analysis By Product Type 9. Global Market Analysis 2013-2021 and Forecast 2022-2028, by Vehicle Type 9.1. Introduction / Key Findings 9.2. Historical Market Size (US$ Mn) and Volume Analysis By Vehicle Type, 2013 - 2021 9.3. Current and Future Market Size (US$ Mn) and Volume Analysis and Forecast By Vehicle Type, 2022 - 2028 9.3.1. Passenger Car 9.3.1.1. Compact 9.3.1.2. Mid-Size 9.3.1.3. Luxury 9.3.1.4. SUV 9.3.2. Light Commercial Vehicle 9.3.3. Heavy Commercial Vehicle 9.4. Market Attractiveness Analysis By Vehicle Type 10. Global Market Analysis 2013-2021 and Forecast 2022-2028, by Application 10.1. Introduction / Key Findings 10.2. Historical Market Size (US$ Mn) and Volume Analysis By Application, 2013 - 2021 10.3. Current and Future Market Size (US$ Mn) and Volume Analysis and Forecast By Application, 2022 - 2028 10.3.1. Vehicle System and Component Access 10.3.2. Vehicle Health Tracking & Diagnosis 10.3.3. Service assistance 10.4. Market Attractiveness Analysis By Application 11. Global Market Analysis 2013-2021 and Forecast 2022-2028, by Region 11.1. Introduction 11.2. Historical Market Size (US$ Mn) and Volume Analysis By Region, 2013 - 2021 11.3. Current Market Size (US$ Mn) and Volume Analysis and Forecast By Region, 2022 - 2028 11.3.1. North America 11.3.2. Latin America 11.3.3. Europe 11.3.4. Middle East and Africa (MEA) 11.3.5. East Asia 11.3.6. South Asia 11.3.7. Oceania 11.4. Market Attractiveness Analysis By Region 12. North America Market Analysis 2013-2021 and Forecast 2022-2028 12.1. Introduction 12.2. Historical Market Size (US$ Mn) and Volume Trend Analysis By Market Taxonomy, 2013 - 2021 12.3. Market Size (US$ Mn) and Volume Forecast By Market Taxonomy, 2022 - 2028 12.3.1. By Country 12.3.1.1. U.S. 12.3.1.2. Canada 12.3.2. By Product Type 12.3.3. By Vehicle Type 12.3.4. By Application 12.4. Market Attractiveness Analysis 12.4.1. By Country 12.4.2. By Product Type 12.4.3. By Vehicle Type 12.4.4. By Application 12.5. Market Trends 12.6. Drivers and Restraints - Impact Analysis 13. Latin America Market Analysis 2013-2021 and Forecast 2022-2028 13.1. Introduction 13.2. Historical Market Size (US$ Mn) and Volume Trend Analysis By Market Taxonomy, 2013 - 2021 13.3. Market Size (US$ Mn) and Volume Forecast By Market Taxonomy, 2022 - 2028 13.3.1. By Country 13.3.1.1. Brazil 13.3.1.2. Mexico 13.3.1.3. Rest of Latin America 13.3.2. By Product Type 13.3.3. By Vehicle Type 13.3.4. By Application 13.4. Market Attractiveness Analysis 13.4.1. By Country 13.4.2. By Product Type 13.4.3. By Vehicle Type 13.4.4. By Application 13.5. Market Trends 13.6. Drivers and Restraints - Impact Analysis 14. Europe Market Analysis 2013-2021 and Forecast 2022-2028 14.1. Introduction 14.2. Historical Market Size (US$ Mn) and Volume Trend Analysis By Market Taxonomy, 2013 - 2021 14.3. Market Size (US$ Mn) and Volume Forecast By Market Taxonomy, 2022 - 2028 14.3.1. By Country 14.3.1.1. Germany 14.3.1.2. Italy 14.3.1.3. France 14.3.1.4. U.K. 14.3.1.5. Spain 14.3.1.6. BENELUX 14.3.1.7. Russia 14.3.1.8. Rest of Europe 14.3.2. By Product Type 14.3.3. By Vehicle Type 14.3.4. By Application 14.4. Market Attractiveness Analysis 14.4.1. By Country 14.4.2. By Product Type 14.4.3. By Vehicle Type 14.4.4. By Application 14.5. Market Trends 14.6. Drivers and Restraints - Impact Analysis 15. South Asia Market Analysis 2013-2021 and Forecast 2022-2028 15.1. Introduction 15.2. Historical Market Size (US$ Mn) and Volume Trend Analysis By Market Taxonomy, 2013 - 2021 15.3. Market Size (US$ Mn) and Volume Forecast By Market Taxonomy, 2022 - 2028 15.3.1. By Country 15.3.1.1. India 15.3.1.2. Thailand 15.3.1.3. Indonesia 15.3.1.4. Malaysia 15.3.1.5. Rest of South Asia 15.3.2. By Product Type 15.3.3. By Vehicle Type 15.3.4. By Application 15.4. Market Attractiveness Analysis 15.4.1. By Country 15.4.2. By Product Type 15.4.3. By Vehicle Type 15.4.4. By Application 15.5. Market Trends 15.6. Drivers and Restraints - Impact Analysis 16. East Asia Market Analysis 2013-2021 and Forecast 2022-2028 16.1. Introduction 16.2. Historical Market Size (US$ Mn) and Volume Trend Analysis By Market Taxonomy, 2013 - 2021 16.3. Market Size (US$ Mn) and Volume Forecast By Market Taxonomy, 2022 - 2028 16.3.1. By Country 16.3.1.1. China 16.3.1.2. Japan 16.3.1.3. South Korea 16.3.2. By Product Type 16.3.3. By Vehicle Type 16.3.4. By Application 16.4. Market Attractiveness Analysis 16.4.1. By Country 16.4.2. By Product Type 16.4.3. By Vehicle Type 16.4.4. By Application 16.5. Market Trends 16.6. Drivers and Restraints - Impact Analysis 17. Oceania Market Analysis 2013-2021 and Forecast 2022-2028 17.1. Introduction 17.2. Historical Market Size (US$ Mn) and Volume Trend Analysis By Market Taxonomy, 2013 - 2021 17.3. Market Size (US$ Mn) and Volume Forecast By Market Taxonomy, 2022 - 2028 17.3.1. By Country 17.3.1.1. Australia 17.3.1.2. New Zealand 17.3.2. By Product Type 17.3.3. By Vehicle Type 17.3.4. By Application 17.4. Market Attractiveness Analysis 17.4.1. By Country 17.4.2. By Product Type 17.4.3. By Vehicle Type 17.4.4. By Application 17.5. Market Trends 17.6. Drivers and Restraints - Impact Analysis 18. Middle East and Africa Market Analysis 2013-2021 and Forecast 2022-2028 18.1. Introduction 18.2. Historical Market Size (US$ Mn) and Volume Trend Analysis By Market Taxonomy, 2013 - 2021 18.3. Market Size (US$ Mn) and Volume Forecast By Market Taxonomy, 2022 - 2028 18.3.1. By Country 18.3.1.1. GCC Countries 18.3.1.2. Turkey 18.3.1.3. Northern Africa 18.3.1.4. South Africa 18.3.1.5. Rest of Middle East and Africa 18.3.2. By Product Type 18.3.3. By Vehicle Type 18.3.4. By Application 18.4. Market Attractiveness Analysis 18.4.1. By Country 18.4.2. By Product Type 18.4.3. By Vehicle Type 18.4.4. By Application 18.5. Market Trends 18.6. Drivers and Restraints - Impact Analysis 19. Emerging Countries Market Analysis 2013-2021 and Forecast 2022-2028 19.1. Introduction 19.1.1. Market Value Proportion Analysis, By Key Countries 19.1.2. Global Vs. Country Growth Comparison 19.2. China Market Analysis 19.2.1. Introduction 19.2.2. PEST Analysis 19.2.3. Market Volume (Units) and Value (US$ Mn) Analysis and Forecast by Market Taxonomy 19.2.3.1. By Product Type 19.2.3.2. By Vehicle Type 19.2.3.3. By Application 19.3. India Market Analysis 19.3.1. Introduction 19.3.2. PEST Analysis 19.3.3. Market Volume (Units) and Value (US$ Mn) Analysis and Forecast by Market Taxonomy 19.3.3.1. By Product Type 19.3.3.2. By Vehicle Type 19.3.3.3. By Application 19.4. Indonesia Market Analysis 19.4.1. Introduction 19.4.2. PEST Analysis 19.4.3. Market Volume (Units) and Value (US$ Mn) Analysis and Forecast by Market Taxonomy 19.4.3.1. By Product Type 19.4.3.2. By Vehicle Type 19.4.3.3. By Application 20. Market Structure Analysis 20.1. Market Analysis by Tier of Companies (Automotive Remote Diagnostic) 21. Competition Analysis 21.1. Competition Dashboard 21.2. Competition Benchmarking 21.3. Competition Deep Dive 21.3.1. Robert Bosch GmbH 21.3.1.1. Overview 21.3.1.2. Product Portfolio 21.3.1.3. Profitability by Market Segments (Product/Channel/Region) 21.3.1.4. Sales Footprint 21.3.1.5. Strategy Overview 21.3.1.5.1. Marketing Strategy 21.3.1.5.2. Product Strategy 21.3.1.5.3. Channel Strategy 21.3.2. Continental AG 21.3.3. Luxoft 21.3.4. ACTIA Group 21.3.5. Tech Mahindra Limited 21.3.6. Softing AG 21.3.7. HARMAN International 21.3.8. Infineon Technologies AG 21.3.9. Vector Informatik GmbH 21.3.10. OnStar 21.3.11. Transics 21.3.12. Verizon Communications 21.3.13. Eaton 21.3.14. IBM Corporation 21.4. Profile Snapshots (46 Leading Companies) 22. Assumptions and Acronyms Used 23. Research Methodology
Don't pay for what you don't need
Customize your report by selecting specific countries or regions and save 30%!
Table 01: Global Market Size (US$ Mn) and Volume (Units) Forecast by Product Type 2013 – 2028 Table 02: Global Market Volume (Units) Forecast by Vehicle Type (Equipment) 2013 – 2028 Table 03: Global Market Size (US$ Mn) Forecast by Vehicle Type 2013 – 2028 Table 04: Global Market Volume (Units) Forecast by Application, 2013 – 2028 Table 05: Global Market Value (US$ Mn) Forecast by Application, 2013 – 2028 Table 06: Global Market Volume (Units) Forecast by Region, 2013 – 2028 Table 07: Global Software Market Value (US$ Mn) Forecast by Region, 2013 – 2028 Table 08: North America Market Volume (Units) and Value (US$ Mn) Forecast by Country, 2013 – 2028 Table 09: North America Market Size (US$ Mn) and Volume (Units) Forecast by Product Type 2013 – 2028 Table 10: North America Market Volume (Units) Forecast by Vehicle Type 2013 – 2028 Table 11: North America Market Size (US$ Mn) Forecast by Vehicle Type 2013 – 2028 Table 12: North America Market Volume (Units) & Market Value (US$ Mn) Forecast by Application, 2013 – 2028 Table 13: Latin America Market Volume (Units) and Value (US$ Mn) Forecast by Country, 2013 – 2028 Table 14: Latin America Market Size (US$ Mn) and Volume (Units) Forecast by Product Type 2013 – 2028 Table 15: Latin America Market Volume (Units) Forecast by Vehicle Type 2013 – 2028 Table 16: Latin America Market Size (US$ Mn) Forecast by Vehicle Type 2013 – 2028 Table 17: Latin America Market Volume (Units) & Market Value (US$ Mn) Forecast by Application, 2013 – 2028 Table 18: Europe Market Volume (Units) and Value (US$ Mn) Forecast by Country, 2013 – 2028 Table 19: Europe Market Size (US$ Mn) and Volume (Units) Forecast by Product Type 2013 – 2028 Table 20: Europe Market Volume (Units) Forecast by Vehicle Type 2013 – 2028 Table 21: Europe Market Size (US$ Mn) Forecast by Vehicle Type 2013 – 2028 Table 22: Europe Market Volume (Units) & Market Value (US$ Mn) Forecast by Application, 2013 – 2028 Table 23: South Asia Market Volume (Units) and Value (US$ Mn) Forecast by Country, 2013 – 2028 Table 24: South Asia Market Size (US$ Mn) and Volume (Units) Forecast by Product Type 2013 – 2028 Table 25: South Asia Market Volume (Units) Forecast by Vehicle Type 2013 – 2028 Table 26: South Asia Market Size (US$ Mn) Forecast by Vehicle Type 2013 – 2028 Table 27: South Asia Market Volume (Units) & Market Value (US$ Mn) Forecast by Application, 2013 – 2028 Table 28: East Asia Market Volume (Units) and Value (US$ Mn) Forecast by Country, 2013 – 2028 Table 29: East Asia Market Size (US$ Mn) and Volume (Units) Forecast by Product Type 2013 – 2028 Table 30: East Asia Market Volume (Units) Forecast by Vehicle Type 2013 – 2028 Table 31: East Asia Market Size (US$ Mn) Forecast by Vehicle Type 2013 – 2028 Table 32: East Asia Market Volume (Units) & Market Value (US$ Mn) Forecast by Application, 2013 – 2028 Table 33: Oceania Market Volume (Units) and Value (US$ Mn) Forecast by Country, 2013 – 2028 Table 34: Oceania Market Size (US$ Mn) and Volume (Units) Forecast by Product Type 2013 – 2028 Table 35: Oceania Market Volume (Units) Forecast by Vehicle Type 2013 – 2028 Table 36: Oceania Market Size (US$ Mn) Forecast by Vehicle Type 2013 – 2028 Table 37: Oceania Market Volume (Units) & Market Value (US$ Mn) Forecast by Application, 2013 – 2028 Table 38: MEA Market Volume (Units) and Value (US$ Mn) Forecast by Country, 2013 – 2028 Table 39: MEA Market Size (US$ Mn) and Volume (Units) Forecast by Product Type 2013 – 2028 Table 40: MEA Market Volume (Units) Forecast by Vehicle Type 2013 – 2028 Table 41: MEA Market Size (US$ Mn) Forecast by Vehicle Type 2013 – 2028 Table 42: MEA Market Volume (Units) & Market Value (US$ Mn) Forecast by Application, 2013 – 2028 Table 43: China Market Size (US$ Mn) and Volume (Units) Forecast by Product Type 2013 – 2028 Table 44: China Market Volume (Units) Forecast by Vehicle Type 2013 – 2028 Table 45: China Market Size (US$ Mn) Forecast by Vehicle Type 2013 – 2028 Table 46: China Market Volume (Units) & Market Value (US$ Mn) Forecast by Application, 2013 – 2028 Table 47: India Market Size (US$ Mn) and Volume (Units) Forecast by Product Type 2013 – 2028 Table 48: India Market Volume (Units) Forecast by Vehicle Type 2013 – 2028 Table 49: India Market Size (US$ Mn) Forecast by Vehicle Type 2013 – 2028 Table 50: India Market Volume (Units) & Market Value (US$ Mn) Forecast by Application, 2013 – 2028 Table 51: Indonesia Market Size (US$ Mn) and Volume (Units) Forecast by Product Type 2013 – 2028 Table 52: Indonesia Market Volume (Units) Forecast by Vehicle Type 2013 – 2028 Table 53: Indonesia Market Size (US$ Mn) Forecast by Vehicle Type 2013 – 2028 Table 54: Indonesia Market Volume (Units) & Market Value (US$ Mn) Forecast by Application, 2013 – 2028xx
Figure 01: Global Equipment Market Volume (Units) Market Volume, 2013–2021 Figure 02: Global Equipment Market Volume Forecast, 2022–2028 Figure 03: Global Market (Equipment + Software) Value (US$ Mn) Forecast, 2013 – 2028 Figure 04: Global Market (Equipment + Software) Absolute US$ Opportunity, 2013 – 2028 Figure 05: Global Market Value Share and BPS Analysis by Product Type – 2022 & 2028 Figure 06: Global Market Value Y-o-Y (%) Growth Projections by Product Type, 2022 – 2028 Figure 07: Global Market Attractiveness Analysis by Product Type, 2022 – 2028 Figure 08: Market Absolute $ Opportunity by Equipment Segment, 2022 – 2028 Figure 09: Market Absolute $ Opportunity by Software Segment, 2022 – 2028 Figure 10: Global Market Value Share and BPS Analysis by Vehicle Type – 2022 & 2028 Figure 11: Global Market Value Y-o-Y (%) Growth Projections by Vehicle Type, 2022 – 2028 Figure 12: Global Market Attractiveness Analysis by Vehicle Type, 2022 – 2028 Figure 13: Global Market Value Share and BPS Analysis by Passenger Cars Type– 2022 & 2028 Figure 14: Global Market Value Y-o-Y (%) Growth Projections by Passenger Cars Type, 2022 – 2028 Figure 15: Global Market Attractiveness Analysis by Passenger Cars Type, 2022 – 2028 Figure 16: Market Absolute $ Opportunity by Passenger Cars Segment, 2022 – 2028 Figure 17: Market Absolute $ Opportunity by LCVs Segment, 2022 – 2028 Figure 18: Market Absolute $ Opportunity by HCVs Segment, 2022 – 2028 Figure 19: Global Market Share and BPS Analysis by Application – 2022 & 2028 Figure 20: Global Market, Y-o-Y Growth Projections by Application, 2022 – 2028 Figure 21: Global Market Attractiveness Analysis by Application, 2022 – 2028 Figure 22: Global Absolute $ Opportunity (US$ Mn) by Vehicle System & Component Access Segment, 2013 – 2028 Figure 23: Global Absolute $ Opportunity (US$ Mn) by Vehicle Health Tracking & Diagnosis Segment, 2013 – 2028 Figure 24: Global Absolute $ Opportunity (US$ Mn) by Service Assistance Segment, 2013–2028 Figure 25: Global Market Share and BPS Analysis by Region – 2022 & 2028 Figure 26: Global Market, Y-o-Y Growth Projections by Region, 2022 – 2028 Figure 27: Global Market Attractiveness Analysis by Region, 2022 – 2028 Figure 28: Global Absolute $ Opportunity (US$ Mn) by North America Region, 2013 – 2028 Figure 29: Global Absolute $ Opportunity (US$ Mn) by Latin America Region, 2013 – 2028 Figure 30: Global Absolute $ Opportunity (US$ Mn) by Europe Region, 2013 – 2028 Figure 31: Global Absolute $ Opportunity (US$ Mn) by South Asia Region, 2013 – 2028 Figure 32: Global Absolute $ Opportunity (US$ Mn) by East Asia Region, 2013 – 2028 Figure 33: Global Absolute $ Opportunity (US$ Mn) by Oceania Region, 2013 – 2028 Figure 34: Global Absolute $ Opportunity (US$ Mn) by MEA Region, 2013 – 2028 Figure 35: North America Market Share and BPS Analysis by Country – 2022 & 2028 Figure 36: North America Market, Y-o-Y Growth Projections by Country, 2022 – 2028 Figure 37: North America Market Attractiveness Analysis by Country, 2022 – 2028 Figure 38: U.S. Absolute $ Opportunity (US$ Mn) by North America Segment, 2013 – 2028 Figure 39: North America Absolute $ Opportunity (US$ Mn) by Canada Segment, 2013 – 2028 Figure 40: North America Market Value Share and BPS Analysis by Product Type – 2022 & 2028 Figure 41: North America Market Value Y-o-Y (%) Growth Projections by Product Type, 2022 – 2028 Figure 42: North America Market Attractiveness Analysis by Product Type, 2022 – 2028 Figure 43: North America Market Value Share and BPS Analysis by Vehicle Type – 2022 & 2028 Figure 44: North America Market Value Y-o-Y (%) Growth Projections by Vehicle Type, 2022 – 2028 Figure 45: North America Market Attractiveness Analysis by Vehicle Type, 2022 – 2028 Figure 46: North America Market Share and BPS Analysis by Application – 2022 & 2028 Figure 47: North America Market, Y-o-Y Growth Projections by Application, 2021 – 2028 Figure 48: North America Market Attractiveness Analysis by Application, 2022 – 2028 Figure 49: Latin America Market Share and BPS Analysis by Country – 2022 & 2028 Figure 50: Latin America Market, Y-o-Y Growth Projections by Country, 2022 – 2028 Figure 51: Latin America Market Attractiveness Analysis by Country, 2022 – 2028 Figure 52: Latin America Absolute $ Opportunity (US$ Mn) by Brazil Segment, 2022 – 2028 Figure 53: Latin America Absolute $ Opportunity (US$ Mn) by Mexico Segment, 2022 – 2028 Figure 54: Market Absolute $ Opportunity by Rest of LA Segment, 2022 – 2028 Figure 55: Latin America Market Value Share and BPS Analysis by Product Type – 2022 & 2028 Figure 56: Latin America Market Value Y-o-Y (%) Growth Projections by Product Type, 2022 – 2028 Figure 57: Latin America Market Attractiveness Analysis by Product Type, 2022 – 2028 Figure 58: Latin America Market Value Share and BPS Analysis by Vehicle Type – 2022 & 2028 Figure 59: Latin America Market Value Y-o-Y (%) Growth Projections by Vehicle Type, 2022 – 2028 Figure 60: Latin America Market Attractiveness Analysis by Vehicle Type, 2022 – 2028 Figure 61: Latin America Market Share and BPS Analysis by Application – 2022 & 2028 Figure 62: Latin America Market, Y-o-Y Growth Projections by Application, 2022 – 2028 Figure 63: Latin America Market Attractiveness Analysis by Application, 2022 – 2028 Figure 64: Europe Market Share and BPS Analysis by Country – 2022 & 2028 Figure 65: Europe Market, Y-o-Y Growth Projections by Country, 2022 – 2028 Figure 66: Europe Market Attractiveness Analysis by Country, 2022 – 2028 Figure 67: Europe Absolute $ Opportunity (US$ Mn) by Germany Region, 2022 – 2028 Figure 68: Europe Absolute $ Opportunity (US$ Mn) by Italy Region, 2022 – 2028 Figure 69: Europe Absolute $ Opportunity (US$ Mn) by France Region, 2022 – 2028 Figure 70: Europe Absolute $ Opportunity (US$ Mn) by U.K. Region, 2022 – 2028 Figure 71: Europe Absolute $ Opportunity (US$ Mn) by Spain Region, 2022 – 2028 Figure 72: Europe Absolute $ Opportunity (US$ Mn) by BENELUX Region, 2022 – 2028 Figure 73: Europe Absolute $ Opportunity (US$ Mn) by Russia Region, 2022 – 2028 Figure 74: Europe Absolute $ Opportunity (US$ Mn) by Rest of Europe Region, 2022 – 2028 Figure 75: Europe Market Value Share and BPS Analysis by Product Type – 2022 & 2028 Figure 76: Europe Market Value Y-o-Y (%) Growth Projections by Product Type, 2022 – 2028 Figure 77: Europe Market Attractiveness Analysis by Product Type, 2022 – 2028 Figure 78: Europe Market Value Share and BPS Analysis by Vehicle Type – 2022 & 2028 Figure 79: Europe Market Value Y-o-Y (%) Growth Projections by Vehicle Type, 2022 – 2028 Figure 80: Europe Market Attractiveness Analysis by Vehicle Type, 2022 – 2028 Figure 81: Europe Market Share and BPS Analysis by Application – 2022 & 2028 Figure 82: Europe Market, Y-o-Y Growth Projections by Application, 2022 – 2028 Figure 83: Europe Market Attractiveness Analysis by Application, 2022 – 2028 Figure 84: South Asia Market Share and BPS Analysis by Country – 2022 & 2028 Figure 85: South Asia Market, Y-o-Y Growth Projections by Country, 2022 – 2028 Figure 86: South Asia Market Attractiveness Analysis by Country, 2022 – 2028 Figure 87: South Asia Absolute $ Opportunity (US$ Mn) by India Region, 2022 – 2028 Figure 88: South Asia Absolute $ Opportunity (US$ Mn) by Thailand Region, 2022 – 2028 Figure 89: South Asia Absolute $ Opportunity (US$ Mn) by Indonesia Region, 2022 – 2028 Figure 90: South Asia Absolute $ Opportunity (US$ Mn) by Malaysia Region, 2022 – 2028 Figure 91: South Asia Absolute $ Opportunity (US$ Mn) by Rest of South Asia Region, 2022 – 2028 Figure 92: South Asia Market Value Share and BPS Analysis by Product Type – 2022 & 2028 Figure 93: South Asia Market Value Y-o-Y (%) Growth Projections by Product Type, 2022 – 2028 Figure 94: South Asia Market Attractiveness Analysis by Product Type, 2022 – 2028 Figure 95: South Asia Market Value Share and BPS Analysis by Vehicle Type – 2022 & 2028 Figure 96: South Asia Market Value Y-o-Y (%) Growth Projections by Vehicle Type, 2022 – 2028 Figure 97: South Asia Market Attractiveness Analysis by Vehicle Type, 2022 – 2028 Figure 98: South Asia Market Share and BPS Analysis by Application – 2022 & 2028 Figure 99: South Asia Market, Y-o-Y Growth Projections by Application, 2022 – 2028 Figure 100: South Asia Market Attractiveness Analysis by Application, 2022 – 2028 Figure 101: East Asia Market Share and BPS Analysis by Country – 2022 & 2028 Figure 102: East Asia Market, Y-o-Y Growth Projections by Country, 2022 – 2028 Figure 103: East Asia Market Attractiveness Analysis by Country, 2022 – 2028 Figure 104: East Asia Absolute $ Opportunity (US$ Mn) by China Segment, 2022 – 2028 Figure 105: East Asia Absolute $ Opportunity (US$ Mn) by Japan Segment, 2022 – 2028 Figure 106: Market Absolute $ Opportunity by South Korea Segment, 2022 – 2028 Figure 107: East Asia Market Value Share and BPS Analysis by Product Type – 2022 & 2028 Figure 108: East Asia Market Value Y-o-Y (%) Growth Projections by Product Type, 2022 – 2028 Figure 109: East Asia Market Attractiveness Analysis by Product Type, 2022 – 2028 Figure 110: East Asia Market Value Share and BPS Analysis by Vehicle Type – 2022 & 2028 Figure 111: East Asia Market Value Y-o-Y (%) Growth Projections by Vehicle Type, 2022 – 2028 Figure 112: East Asia Market Attractiveness Analysis by Vehicle Type, 2022 – 2028 Figure 113: East Asia Market Share and BPS Analysis by Application – 2022 & 2028 Figure 114: East Asia Market, Y-o-Y Growth Projections by Application, 2022 – 2028 Figure 115: East Asia Market Attractiveness Analysis by Application, 2022 – 2028 Figure 116: Oceania Market Share and BPS Analysis by Country – 2022 & 2028 Figure 117: Oceania Market, Y-o-Y Growth Projections by Country, 2022 – 2028 Figure 118: Oceania Market Attractiveness Analysis by Country, 2022 – 2028 Figure 119: Oceania Absolute $ Opportunity (US$ Mn) by Australia Region, 2013 – 2028 Figure 120: Oceania Absolute $ Opportunity (US$ Mn) by New Zealand Region, 2013 – 2028 Figure 121: Oceania Market Value Share and BPS Analysis by Product Type – 2022 & 2028 Figure 122: Oceania Market Value Y-o-Y (%) Growth Projections by Product Type, 2022 – 2028 Figure 123: Oceania Market Attractiveness Analysis by Product Type, 2022 – 2028 Figure 124: Oceania Market Value Share and BPS Analysis by Vehicle Type – 2022 & 2028 Figure 125: Oceania Market Value Y-o-Y (%) Growth Projections by Vehicle Type, 2022 – 2028 Figure 126: Oceania Market Attractiveness Analysis by Vehicle Type, 2022 – 2028 Figure 127: Oceania Market Share and BPS Analysis by Application – 2022 & 2028 Figure 128: Oceania Market, Y-o-Y Growth Projections by Application, 2022 – 2028 Figure 129: Oceania Market Attractiveness Analysis by Application, 2022 – 2028 Figure 130: MEA Market Share and BPS Analysis by Country – 2022 & 2028 Figure 131: MEA Market, Y-o-Y Growth Projections by Country, 2022 – 2028 Figure 132: MEA Market Attractiveness Analysis by Country, 2022 – 2028 Figure 133: MEA Absolute $ Opportunity (US$ Mn) by GCC Countries Region, 2022 – 2028 Figure 134: MEA Absolute $ Opportunity (US$ Mn) by Turkey Region, 2022 – 2028 Figure 135: MEA Absolute $ Opportunity (US$ Mn) by Northern Africa Region, 2022 – 2028 Figure 136: MEA Absolute $ Opportunity (US$ Mn) by South Africa Region, 2022 – 2028 Figure 137: MEA Absolute $ Opportunity (US$ Mn) by Rest of MEA Region, 2022 – 2028 Figure 138: MEA Market Value Share and BPS Analysis by Product Type – 2022 & 2028 Figure 139: MEA Market Value Y-o-Y (%) Growth Projections by Product Type, 2022 – 2028 Figure 140: MEA Market Attractiveness Analysis by Product Type, 2022 – 2028 Figure 141: MEA Market Value Share and BPS Analysis by Vehicle Type – 2022 & 2028 Figure 142: MEA Market Value Y-o-Y (%) Growth Projections by Vehicle Type, 2022 – 2028 Figure 143: MEA Market Attractiveness Analysis by Vehicle Type, 2022 – 2028 Figure 144: MEA Market Share and BPS Analysis by Application – 2022 & 2028 Figure 145: MEA Market, Y-o-Y Growth Projections by Application, 2022 – 2028 Figure 146: MEA Market Attractiveness Analysis by Application, 2022 – 2028 Figure 147: Global & Emerging Countries Market Share Analysis – 2022 & 2028 Figure 148: Emerging Markets Market Share by Country, 2022 Figure 149: Global Market Share by Region, 2022 Figure 150: Global & Emerging Countries Market Y-o-Y Growth Projections, 2022-2028
Recommendations
Explore Automotive Insights
View Reports