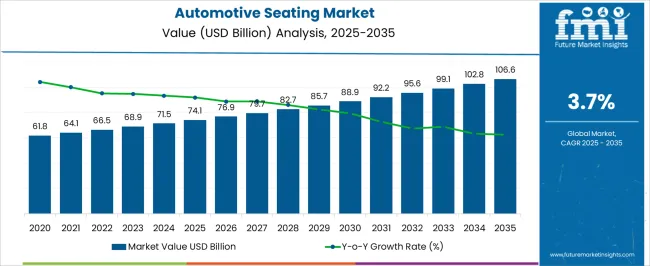
The automotive seating market is expected to be valued at USD 71.48 billion in 2024. The automotive seating is predicted to rise at a sluggish CAGR of 3.7% from 2024 to 2034. The global market is anticipated to reach USD 102.8 billion by 2034.
Attributes | Key Insights |
---|---|
Estimated Market Size in 2024 | USD 71.48 billion |
Projected Market Value in 2034 | USD 102.8 billion |
Value-based CAGR from 2024 to 2034 | 3.7% |
Between 2019 and 2023, the automotive seating market experienced a CAGR of 3.04%. This indicates moderate growth over this period.
Looking ahead to the forecasted period from 2024 to 2034, the market is expected to see an increase in growth rate, with a projected CAGR of 3.7%. This suggests a slightly faster expansion pace than the previous five years.
The historical analysis reflects a steady but relatively modest growth trajectory, while the forecasted projections indicate a slightly accelerated market growth pace over the coming decade.
Technological advancements could influence this, increasing demand for comfort and safety features, evolving consumer preferences, and the integration of seating innovations into emerging automotive trends like electric and autonomous vehicles.Top of Form
Historical CAGR from 2019 to 2023 | 3.04% |
---|---|
Forecast CAGR from 2024 to 2034 | 3.7% |
The table showcases the top five countries ranked by revenue, with China holding the top position.
China has the largest automotive industry globally, with a massive domestic market and significant export capabilities. The automotive sector benefits from robust manufacturing infrastructure, economies of scale, and extensive supply chains.
The automotive seating manufacturers can leverage these advantages to produce a wide range of seating systems efficiently and cost-effectively, meeting both domestic and international demand.
Countries | Forecast CAGRs from 2024 to 2034 |
---|---|
United States | 2.3% |
Canada | 3.1% |
South Korea | 3.8% |
China | 4.6% |
India | 4.2% |
The utilization of automotive seating in the United States is facilitated by the stringent safety regulations enforced by organizations like the National Highway Traffic Safety Administration (NHTSA).
These regulations mandate specific safety standards for automotive seating, including requirements for seat strength, occupant protection, and crashworthiness.
Manufacturers in the United States must comply with these regulations to ensure that their seating systems meet the necessary safety standards, driving the demand for advanced seating technologies and innovations in the market.
The cold climate conditions are a significant reason for using automotive seating in Canada. With long winters and low temperatures, there is a heightened demand for automotive seating equipped with features such as seat heaters and heated cushions to provide comfort and warmth to drivers and passengers.
Automotive seating manufacturers in Canada cater to this demand by producing seating systems with cold-weather features, driving the market forward.
The utilization of automotive seating in South Korea focuses on innovation and technological advancements. Automotive manufacturers are known for their cutting-edge research and development capabilities, leading to the integration of advanced features and technologies into automotive seating systems.
Innovations include smart seating controls, advanced air ventilation systems, and ergonomic designs tailored for enhanced comfort and support. The emphasis on innovation drives the demand for automotive seating in South Korea.
A key reason for using automotive seating in China is the rapid growth of the automotive industry. China is the largest automotive market globally, with a burgeoning demand for passenger and commercial vehicles.
As the automotive market continues to expand, there is a proportional increase in the demand for automotive seating to equip these vehicles. This vehicle production and sales growth drives the demand for automotive seating in China.
One major reason for using automotive seating in India is the increasing focus on comfort and convenience among consumers. With rising disposable income and evolving lifestyle preferences, Indian consumers increasingly prioritize comfort and convenience features in their vehicles, including seating systems.
The country has led to a growing demand for automotive seating with features such as adjustable lumbar support, ergonomic designs, and premium upholstery materials. The focus on comfort and convenience drives the demand for automotive seating in the market.
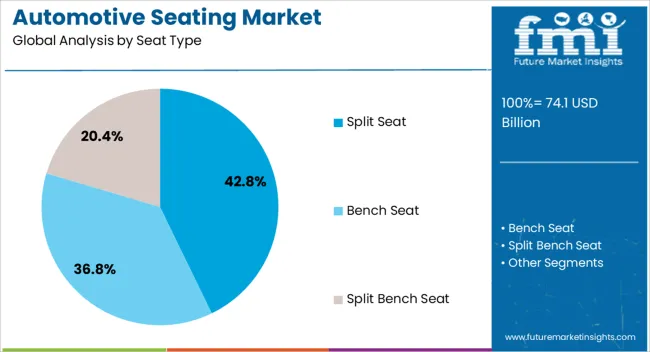
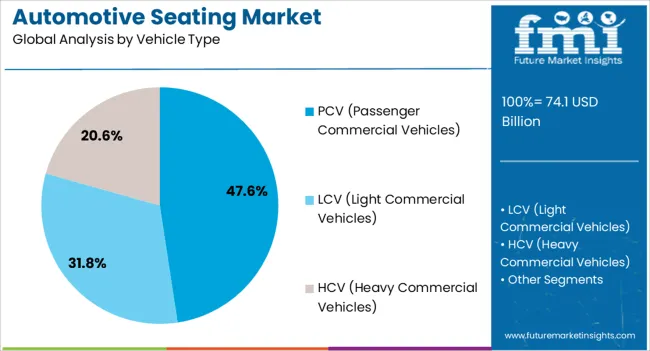
The below section shows the leading segment. Based on seat type, the spilt segment is accounted to hold a market share of 65.8% in 2024. Based on vehicle type, the passenger cars segment is anticipated to account for a market share of 77.2% in 2024.
Split seating configurations, such as bench seats or individually adjustable seats, allow passengers to customize their seating arrangement based on comfort preferences, passenger capacity, or cargo requirements.
With the rising expectations for a pleasant driving experience, automakers prioritize equipping passenger cars with ergonomic seating designs, adjustable features, and premium materials to enhance comfort levels for occupants.
Category | Market Share in 2024 |
---|---|
Split | 65.8% |
Passenger Cars | 77.2% |
The split segment, which includes different seating configurations such as bench seats, captain chairs, and individual seats, is expected to hold a significant market share of 65.8% in 2024. This indicates that most automotive seating sold in the market will belong to this category.
The split segment caters to diverse consumer preferences and vehicle designs, offering flexibility in seating arrangements to accommodate varying passenger capacities and cargo needs.
Consumers can choose various seating options based on their specific requirements, whether optimizing passenger space, enhancing comfort, or facilitating easy access to the interiors of the vehicle.
The passenger cars segment is projected to dominate, with a market share of 77.2% in 2024. This segment includes various types of passenger vehicles, such as sedans, hatchbacks, and SUVs, widely used for personal transportation.
Passenger cars typically require comfortable and ergonomic seating systems to provide a pleasant driving experience for occupants during daily commutes or long journeys.
The strong market share of passenger cars underscores their prominence in the automotive industry and highlights the significant demand for seating solutions tailored to meet the needs of individual vehicle owners and passengers.
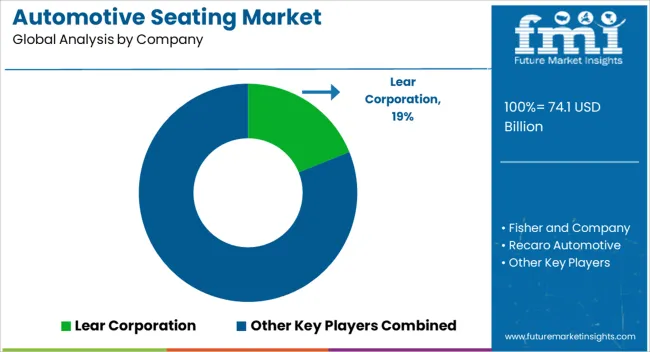
The competitive landscape of the automotive seating market is characterized by several key players vying for market share through product innovation, strategic partnerships, and geographic expansion.
Regional players and niche manufacturers contribute to the competitive dynamics, offering specialized seating solutions and catering to specific market segments. Continuous efforts to enhance product quality, safety, and comfort, focusing on sustainability and cost efficiency, drive competitiveness within the market.
Some of the key developments
Attributes | Details |
---|---|
Estimated Market Size in 2024 | USD 71.48 billion |
Projected Market Valuation in 2034 | USD 102.8 billion |
Value-based CAGR 2024 to 2034 | 3.7% |
Forecast Period | 2024 to 2034 |
Historical Data Available for | 2019 to 2023 |
Market Analysis | Value in USD billion |
Key Regions Covered | North America; Latin America; Western Europe; Eastern Europe; South Asia and Pacific; East Asia; Middle East and Africa |
Key Market Segments Covered | Seat Type, Vehicle Type, Distribution Channel, Region |
Key Countries Profiled | The United States, Canada, Brazil, Mexico, Germany, The United Kingdom, France, Spain, Italy, Russia, Poland, Czech Republic, Romania, India, Bangladesh, Australia, New Zealand, China, Japan, South Korea, GCC countries, South Africa, Israel |
Key Companies Profiled | Fisher and Company; Recaro Automotive; Faurecia; Grammar Seating Systems; Johnson Controls; TM Automotive Seating Systems Private Limited; Lear Corporation; Tata Autocomp Systems Limited; Toyota Boshoku Corporation; Marter Automotive Seating Systems; TS Tech Corporation Ltd. |
Table 1: Global Market Value (US$ Million) Forecast by Region, 2019 to 2034
Table 2: Global Market Volume (Units) Forecast by Region, 2019 to 2034
Table 3: Global Market Value (US$ Million) Forecast by Seat Type, 2019 to 2034
Table 4: Global Market Volume (Units) Forecast by Seat Type, 2019 to 2034
Table 5: Global Market Value (US$ Million) Forecast by Vehicle Type, 2019 to 2034
Table 6: Global Market Volume (Units) Forecast by Vehicle Type, 2019 to 2034
Table 7: Global Market Value (US$ Million) Forecast by Distribution Channel, 2019 to 2034
Table 8: Global Market Volume (Units) Forecast by Distribution Channel, 2019 to 2034
Table 9: North America Market Value (US$ Million) Forecast by Country, 2019 to 2034
Table 10: North America Market Volume (Units) Forecast by Country, 2019 to 2034
Table 11: North America Market Value (US$ Million) Forecast by Seat Type, 2019 to 2034
Table 12: North America Market Volume (Units) Forecast by Seat Type, 2019 to 2034
Table 13: North America Market Value (US$ Million) Forecast by Vehicle Type, 2019 to 2034
Table 14: North America Market Volume (Units) Forecast by Vehicle Type, 2019 to 2034
Table 15: North America Market Value (US$ Million) Forecast by Distribution Channel, 2019 to 2034
Table 16: North America Market Volume (Units) Forecast by Distribution Channel, 2019 to 2034
Table 17: Latin America Market Value (US$ Million) Forecast by Country, 2019 to 2034
Table 18: Latin America Market Volume (Units) Forecast by Country, 2019 to 2034
Table 19: Latin America Market Value (US$ Million) Forecast by Seat Type, 2019 to 2034
Table 20: Latin America Market Volume (Units) Forecast by Seat Type, 2019 to 2034
Table 21: Latin America Market Value (US$ Million) Forecast by Vehicle Type, 2019 to 2034
Table 22: Latin America Market Volume (Units) Forecast by Vehicle Type, 2019 to 2034
Table 23: Latin America Market Value (US$ Million) Forecast by Distribution Channel, 2019 to 2034
Table 24: Latin America Market Volume (Units) Forecast by Distribution Channel, 2019 to 2034
Table 25: Western Europe Market Value (US$ Million) Forecast by Country, 2019 to 2034
Table 26: Western Europe Market Volume (Units) Forecast by Country, 2019 to 2034
Table 27: Western Europe Market Value (US$ Million) Forecast by Seat Type, 2019 to 2034
Table 28: Western Europe Market Volume (Units) Forecast by Seat Type, 2019 to 2034
Table 29: Western Europe Market Value (US$ Million) Forecast by Vehicle Type, 2019 to 2034
Table 30: Western Europe Market Volume (Units) Forecast by Vehicle Type, 2019 to 2034
Table 31: Western Europe Market Value (US$ Million) Forecast by Distribution Channel, 2019 to 2034
Table 32: Western Europe Market Volume (Units) Forecast by Distribution Channel, 2019 to 2034
Table 33: Eastern Europe Market Value (US$ Million) Forecast by Country, 2019 to 2034
Table 34: Eastern Europe Market Volume (Units) Forecast by Country, 2019 to 2034
Table 35: Eastern Europe Market Value (US$ Million) Forecast by Seat Type, 2019 to 2034
Table 36: Eastern Europe Market Volume (Units) Forecast by Seat Type, 2019 to 2034
Table 37: Eastern Europe Market Value (US$ Million) Forecast by Vehicle Type, 2019 to 2034
Table 38: Eastern Europe Market Volume (Units) Forecast by Vehicle Type, 2019 to 2034
Table 39: Eastern Europe Market Value (US$ Million) Forecast by Distribution Channel, 2019 to 2034
Table 40: Eastern Europe Market Volume (Units) Forecast by Distribution Channel, 2019 to 2034
Table 41: South Asia and Pacific Market Value (US$ Million) Forecast by Country, 2019 to 2034
Table 42: South Asia and Pacific Market Volume (Units) Forecast by Country, 2019 to 2034
Table 43: South Asia and Pacific Market Value (US$ Million) Forecast by Seat Type, 2019 to 2034
Table 44: South Asia and Pacific Market Volume (Units) Forecast by Seat Type, 2019 to 2034
Table 45: South Asia and Pacific Market Value (US$ Million) Forecast by Vehicle Type, 2019 to 2034
Table 46: South Asia and Pacific Market Volume (Units) Forecast by Vehicle Type, 2019 to 2034
Table 47: South Asia and Pacific Market Value (US$ Million) Forecast by Distribution Channel, 2019 to 2034
Table 48: South Asia and Pacific Market Volume (Units) Forecast by Distribution Channel, 2019 to 2034
Table 49: East Asia Market Value (US$ Million) Forecast by Country, 2019 to 2034
Table 50: East Asia Market Volume (Units) Forecast by Country, 2019 to 2034
Table 51: East Asia Market Value (US$ Million) Forecast by Seat Type, 2019 to 2034
Table 52: East Asia Market Volume (Units) Forecast by Seat Type, 2019 to 2034
Table 53: East Asia Market Value (US$ Million) Forecast by Vehicle Type, 2019 to 2034
Table 54: East Asia Market Volume (Units) Forecast by Vehicle Type, 2019 to 2034
Table 55: East Asia Market Value (US$ Million) Forecast by Distribution Channel, 2019 to 2034
Table 56: East Asia Market Volume (Units) Forecast by Distribution Channel, 2019 to 2034
Table 57: Middle East and Africa Market Value (US$ Million) Forecast by Country, 2019 to 2034
Table 58: Middle East and Africa Market Volume (Units) Forecast by Country, 2019 to 2034
Table 59: Middle East and Africa Market Value (US$ Million) Forecast by Seat Type, 2019 to 2034
Table 60: Middle East and Africa Market Volume (Units) Forecast by Seat Type, 2019 to 2034
Table 61: Middle East and Africa Market Value (US$ Million) Forecast by Vehicle Type, 2019 to 2034
Table 62: Middle East and Africa Market Volume (Units) Forecast by Vehicle Type, 2019 to 2034
Table 63: Middle East and Africa Market Value (US$ Million) Forecast by Distribution Channel, 2019 to 2034
Table 64: Middle East and Africa Market Volume (Units) Forecast by Distribution Channel, 2019 to 2034
Figure 1: Global Market Value (US$ Million) by Seat Type, 2024 to 2034
Figure 2: Global Market Value (US$ Million) by Vehicle Type, 2024 to 2034
Figure 3: Global Market Value (US$ Million) by Distribution Channel, 2024 to 2034
Figure 4: Global Market Value (US$ Million) by Region, 2024 to 2034
Figure 5: Global Market Value (US$ Million) Analysis by Region, 2019 to 2034
Figure 6: Global Market Volume (Units) Analysis by Region, 2019 to 2034
Figure 7: Global Market Value Share (%) and BPS Analysis by Region, 2024 to 2034
Figure 8: Global Market Y-o-Y Growth (%) Projections by Region, 2024 to 2034
Figure 9: Global Market Value (US$ Million) Analysis by Seat Type, 2019 to 2034
Figure 10: Global Market Volume (Units) Analysis by Seat Type, 2019 to 2034
Figure 11: Global Market Value Share (%) and BPS Analysis by Seat Type, 2024 to 2034
Figure 12: Global Market Y-o-Y Growth (%) Projections by Seat Type, 2024 to 2034
Figure 13: Global Market Value (US$ Million) Analysis by Vehicle Type, 2019 to 2034
Figure 14: Global Market Volume (Units) Analysis by Vehicle Type, 2019 to 2034
Figure 15: Global Market Value Share (%) and BPS Analysis by Vehicle Type, 2024 to 2034
Figure 16: Global Market Y-o-Y Growth (%) Projections by Vehicle Type, 2024 to 2034
Figure 17: Global Market Value (US$ Million) Analysis by Distribution Channel, 2019 to 2034
Figure 18: Global Market Volume (Units) Analysis by Distribution Channel, 2019 to 2034
Figure 19: Global Market Value Share (%) and BPS Analysis by Distribution Channel, 2024 to 2034
Figure 20: Global Market Y-o-Y Growth (%) Projections by Distribution Channel, 2024 to 2034
Figure 21: Global Market Attractiveness by Seat Type, 2024 to 2034
Figure 22: Global Market Attractiveness by Vehicle Type, 2024 to 2034
Figure 23: Global Market Attractiveness by Distribution Channel, 2024 to 2034
Figure 24: Global Market Attractiveness by Region, 2024 to 2034
Figure 25: North America Market Value (US$ Million) by Seat Type, 2024 to 2034
Figure 26: North America Market Value (US$ Million) by Vehicle Type, 2024 to 2034
Figure 27: North America Market Value (US$ Million) by Distribution Channel, 2024 to 2034
Figure 28: North America Market Value (US$ Million) by Country, 2024 to 2034
Figure 29: North America Market Value (US$ Million) Analysis by Country, 2019 to 2034
Figure 30: North America Market Volume (Units) Analysis by Country, 2019 to 2034
Figure 31: North America Market Value Share (%) and BPS Analysis by Country, 2024 to 2034
Figure 32: North America Market Y-o-Y Growth (%) Projections by Country, 2024 to 2034
Figure 33: North America Market Value (US$ Million) Analysis by Seat Type, 2019 to 2034
Figure 34: North America Market Volume (Units) Analysis by Seat Type, 2019 to 2034
Figure 35: North America Market Value Share (%) and BPS Analysis by Seat Type, 2024 to 2034
Figure 36: North America Market Y-o-Y Growth (%) Projections by Seat Type, 2024 to 2034
Figure 37: North America Market Value (US$ Million) Analysis by Vehicle Type, 2019 to 2034
Figure 38: North America Market Volume (Units) Analysis by Vehicle Type, 2019 to 2034
Figure 39: North America Market Value Share (%) and BPS Analysis by Vehicle Type, 2024 to 2034
Figure 40: North America Market Y-o-Y Growth (%) Projections by Vehicle Type, 2024 to 2034
Figure 41: North America Market Value (US$ Million) Analysis by Distribution Channel, 2019 to 2034
Figure 42: North America Market Volume (Units) Analysis by Distribution Channel, 2019 to 2034
Figure 43: North America Market Value Share (%) and BPS Analysis by Distribution Channel, 2024 to 2034
Figure 44: North America Market Y-o-Y Growth (%) Projections by Distribution Channel, 2024 to 2034
Figure 45: North America Market Attractiveness by Seat Type, 2024 to 2034
Figure 46: North America Market Attractiveness by Vehicle Type, 2024 to 2034
Figure 47: North America Market Attractiveness by Distribution Channel, 2024 to 2034
Figure 48: North America Market Attractiveness by Country, 2024 to 2034
Figure 49: Latin America Market Value (US$ Million) by Seat Type, 2024 to 2034
Figure 50: Latin America Market Value (US$ Million) by Vehicle Type, 2024 to 2034
Figure 51: Latin America Market Value (US$ Million) by Distribution Channel, 2024 to 2034
Figure 52: Latin America Market Value (US$ Million) by Country, 2024 to 2034
Figure 53: Latin America Market Value (US$ Million) Analysis by Country, 2019 to 2034
Figure 54: Latin America Market Volume (Units) Analysis by Country, 2019 to 2034
Figure 55: Latin America Market Value Share (%) and BPS Analysis by Country, 2024 to 2034
Figure 56: Latin America Market Y-o-Y Growth (%) Projections by Country, 2024 to 2034
Figure 57: Latin America Market Value (US$ Million) Analysis by Seat Type, 2019 to 2034
Figure 58: Latin America Market Volume (Units) Analysis by Seat Type, 2019 to 2034
Figure 59: Latin America Market Value Share (%) and BPS Analysis by Seat Type, 2024 to 2034
Figure 60: Latin America Market Y-o-Y Growth (%) Projections by Seat Type, 2024 to 2034
Figure 61: Latin America Market Value (US$ Million) Analysis by Vehicle Type, 2019 to 2034
Figure 62: Latin America Market Volume (Units) Analysis by Vehicle Type, 2019 to 2034
Figure 63: Latin America Market Value Share (%) and BPS Analysis by Vehicle Type, 2024 to 2034
Figure 64: Latin America Market Y-o-Y Growth (%) Projections by Vehicle Type, 2024 to 2034
Figure 65: Latin America Market Value (US$ Million) Analysis by Distribution Channel, 2019 to 2034
Figure 66: Latin America Market Volume (Units) Analysis by Distribution Channel, 2019 to 2034
Figure 67: Latin America Market Value Share (%) and BPS Analysis by Distribution Channel, 2024 to 2034
Figure 68: Latin America Market Y-o-Y Growth (%) Projections by Distribution Channel, 2024 to 2034
Figure 69: Latin America Market Attractiveness by Seat Type, 2024 to 2034
Figure 70: Latin America Market Attractiveness by Vehicle Type, 2024 to 2034
Figure 71: Latin America Market Attractiveness by Distribution Channel, 2024 to 2034
Figure 72: Latin America Market Attractiveness by Country, 2024 to 2034
Figure 73: Western Europe Market Value (US$ Million) by Seat Type, 2024 to 2034
Figure 74: Western Europe Market Value (US$ Million) by Vehicle Type, 2024 to 2034
Figure 75: Western Europe Market Value (US$ Million) by Distribution Channel, 2024 to 2034
Figure 76: Western Europe Market Value (US$ Million) by Country, 2024 to 2034
Figure 77: Western Europe Market Value (US$ Million) Analysis by Country, 2019 to 2034
Figure 78: Western Europe Market Volume (Units) Analysis by Country, 2019 to 2034
Figure 79: Western Europe Market Value Share (%) and BPS Analysis by Country, 2024 to 2034
Figure 80: Western Europe Market Y-o-Y Growth (%) Projections by Country, 2024 to 2034
Figure 81: Western Europe Market Value (US$ Million) Analysis by Seat Type, 2019 to 2034
Figure 82: Western Europe Market Volume (Units) Analysis by Seat Type, 2019 to 2034
Figure 83: Western Europe Market Value Share (%) and BPS Analysis by Seat Type, 2024 to 2034
Figure 84: Western Europe Market Y-o-Y Growth (%) Projections by Seat Type, 2024 to 2034
Figure 85: Western Europe Market Value (US$ Million) Analysis by Vehicle Type, 2019 to 2034
Figure 86: Western Europe Market Volume (Units) Analysis by Vehicle Type, 2019 to 2034
Figure 87: Western Europe Market Value Share (%) and BPS Analysis by Vehicle Type, 2024 to 2034
Figure 88: Western Europe Market Y-o-Y Growth (%) Projections by Vehicle Type, 2024 to 2034
Figure 89: Western Europe Market Value (US$ Million) Analysis by Distribution Channel, 2019 to 2034
Figure 90: Western Europe Market Volume (Units) Analysis by Distribution Channel, 2019 to 2034
Figure 91: Western Europe Market Value Share (%) and BPS Analysis by Distribution Channel, 2024 to 2034
Figure 92: Western Europe Market Y-o-Y Growth (%) Projections by Distribution Channel, 2024 to 2034
Figure 93: Western Europe Market Attractiveness by Seat Type, 2024 to 2034
Figure 94: Western Europe Market Attractiveness by Vehicle Type, 2024 to 2034
Figure 95: Western Europe Market Attractiveness by Distribution Channel, 2024 to 2034
Figure 96: Western Europe Market Attractiveness by Country, 2024 to 2034
Figure 97: Eastern Europe Market Value (US$ Million) by Seat Type, 2024 to 2034
Figure 98: Eastern Europe Market Value (US$ Million) by Vehicle Type, 2024 to 2034
Figure 99: Eastern Europe Market Value (US$ Million) by Distribution Channel, 2024 to 2034
Figure 100: Eastern Europe Market Value (US$ Million) by Country, 2024 to 2034
Figure 101: Eastern Europe Market Value (US$ Million) Analysis by Country, 2019 to 2034
Figure 102: Eastern Europe Market Volume (Units) Analysis by Country, 2019 to 2034
Figure 103: Eastern Europe Market Value Share (%) and BPS Analysis by Country, 2024 to 2034
Figure 104: Eastern Europe Market Y-o-Y Growth (%) Projections by Country, 2024 to 2034
Figure 105: Eastern Europe Market Value (US$ Million) Analysis by Seat Type, 2019 to 2034
Figure 106: Eastern Europe Market Volume (Units) Analysis by Seat Type, 2019 to 2034
Figure 107: Eastern Europe Market Value Share (%) and BPS Analysis by Seat Type, 2024 to 2034
Figure 108: Eastern Europe Market Y-o-Y Growth (%) Projections by Seat Type, 2024 to 2034
Figure 109: Eastern Europe Market Value (US$ Million) Analysis by Vehicle Type, 2019 to 2034
Figure 110: Eastern Europe Market Volume (Units) Analysis by Vehicle Type, 2019 to 2034
Figure 111: Eastern Europe Market Value Share (%) and BPS Analysis by Vehicle Type, 2024 to 2034
Figure 112: Eastern Europe Market Y-o-Y Growth (%) Projections by Vehicle Type, 2024 to 2034
Figure 113: Eastern Europe Market Value (US$ Million) Analysis by Distribution Channel, 2019 to 2034
Figure 114: Eastern Europe Market Volume (Units) Analysis by Distribution Channel, 2019 to 2034
Figure 115: Eastern Europe Market Value Share (%) and BPS Analysis by Distribution Channel, 2024 to 2034
Figure 116: Eastern Europe Market Y-o-Y Growth (%) Projections by Distribution Channel, 2024 to 2034
Figure 117: Eastern Europe Market Attractiveness by Seat Type, 2024 to 2034
Figure 118: Eastern Europe Market Attractiveness by Vehicle Type, 2024 to 2034
Figure 119: Eastern Europe Market Attractiveness by Distribution Channel, 2024 to 2034
Figure 120: Eastern Europe Market Attractiveness by Country, 2024 to 2034
Figure 121: South Asia and Pacific Market Value (US$ Million) by Seat Type, 2024 to 2034
Figure 122: South Asia and Pacific Market Value (US$ Million) by Vehicle Type, 2024 to 2034
Figure 123: South Asia and Pacific Market Value (US$ Million) by Distribution Channel, 2024 to 2034
Figure 124: South Asia and Pacific Market Value (US$ Million) by Country, 2024 to 2034
Figure 125: South Asia and Pacific Market Value (US$ Million) Analysis by Country, 2019 to 2034
Figure 126: South Asia and Pacific Market Volume (Units) Analysis by Country, 2019 to 2034
Figure 127: South Asia and Pacific Market Value Share (%) and BPS Analysis by Country, 2024 to 2034
Figure 128: South Asia and Pacific Market Y-o-Y Growth (%) Projections by Country, 2024 to 2034
Figure 129: South Asia and Pacific Market Value (US$ Million) Analysis by Seat Type, 2019 to 2034
Figure 130: South Asia and Pacific Market Volume (Units) Analysis by Seat Type, 2019 to 2034
Figure 131: South Asia and Pacific Market Value Share (%) and BPS Analysis by Seat Type, 2024 to 2034
Figure 132: South Asia and Pacific Market Y-o-Y Growth (%) Projections by Seat Type, 2024 to 2034
Figure 133: South Asia and Pacific Market Value (US$ Million) Analysis by Vehicle Type, 2019 to 2034
Figure 134: South Asia and Pacific Market Volume (Units) Analysis by Vehicle Type, 2019 to 2034
Figure 135: South Asia and Pacific Market Value Share (%) and BPS Analysis by Vehicle Type, 2024 to 2034
Figure 136: South Asia and Pacific Market Y-o-Y Growth (%) Projections by Vehicle Type, 2024 to 2034
Figure 137: South Asia and Pacific Market Value (US$ Million) Analysis by Distribution Channel, 2019 to 2034
Figure 138: South Asia and Pacific Market Volume (Units) Analysis by Distribution Channel, 2019 to 2034
Figure 139: South Asia and Pacific Market Value Share (%) and BPS Analysis by Distribution Channel, 2024 to 2034
Figure 140: South Asia and Pacific Market Y-o-Y Growth (%) Projections by Distribution Channel, 2024 to 2034
Figure 141: South Asia and Pacific Market Attractiveness by Seat Type, 2024 to 2034
Figure 142: South Asia and Pacific Market Attractiveness by Vehicle Type, 2024 to 2034
Figure 143: South Asia and Pacific Market Attractiveness by Distribution Channel, 2024 to 2034
Figure 144: South Asia and Pacific Market Attractiveness by Country, 2024 to 2034
Figure 145: East Asia Market Value (US$ Million) by Seat Type, 2024 to 2034
Figure 146: East Asia Market Value (US$ Million) by Vehicle Type, 2024 to 2034
Figure 147: East Asia Market Value (US$ Million) by Distribution Channel, 2024 to 2034
Figure 148: East Asia Market Value (US$ Million) by Country, 2024 to 2034
Figure 149: East Asia Market Value (US$ Million) Analysis by Country, 2019 to 2034
Figure 150: East Asia Market Volume (Units) Analysis by Country, 2019 to 2034
Figure 151: East Asia Market Value Share (%) and BPS Analysis by Country, 2024 to 2034
Figure 152: East Asia Market Y-o-Y Growth (%) Projections by Country, 2024 to 2034
Figure 153: East Asia Market Value (US$ Million) Analysis by Seat Type, 2019 to 2034
Figure 154: East Asia Market Volume (Units) Analysis by Seat Type, 2019 to 2034
Figure 155: East Asia Market Value Share (%) and BPS Analysis by Seat Type, 2024 to 2034
Figure 156: East Asia Market Y-o-Y Growth (%) Projections by Seat Type, 2024 to 2034
Figure 157: East Asia Market Value (US$ Million) Analysis by Vehicle Type, 2019 to 2034
Figure 158: East Asia Market Volume (Units) Analysis by Vehicle Type, 2019 to 2034
Figure 159: East Asia Market Value Share (%) and BPS Analysis by Vehicle Type, 2024 to 2034
Figure 160: East Asia Market Y-o-Y Growth (%) Projections by Vehicle Type, 2024 to 2034
Figure 161: East Asia Market Value (US$ Million) Analysis by Distribution Channel, 2019 to 2034
Figure 162: East Asia Market Volume (Units) Analysis by Distribution Channel, 2019 to 2034
Figure 163: East Asia Market Value Share (%) and BPS Analysis by Distribution Channel, 2024 to 2034
Figure 164: East Asia Market Y-o-Y Growth (%) Projections by Distribution Channel, 2024 to 2034
Figure 165: East Asia Market Attractiveness by Seat Type, 2024 to 2034
Figure 166: East Asia Market Attractiveness by Vehicle Type, 2024 to 2034
Figure 167: East Asia Market Attractiveness by Distribution Channel, 2024 to 2034
Figure 168: East Asia Market Attractiveness by Country, 2024 to 2034
Figure 169: Middle East and Africa Market Value (US$ Million) by Seat Type, 2024 to 2034
Figure 170: Middle East and Africa Market Value (US$ Million) by Vehicle Type, 2024 to 2034
Figure 171: Middle East and Africa Market Value (US$ Million) by Distribution Channel, 2024 to 2034
Figure 172: Middle East and Africa Market Value (US$ Million) by Country, 2024 to 2034
Figure 173: Middle East and Africa Market Value (US$ Million) Analysis by Country, 2019 to 2034
Figure 174: Middle East and Africa Market Volume (Units) Analysis by Country, 2019 to 2034
Figure 175: Middle East and Africa Market Value Share (%) and BPS Analysis by Country, 2024 to 2034
Figure 176: Middle East and Africa Market Y-o-Y Growth (%) Projections by Country, 2024 to 2034
Figure 177: Middle East and Africa Market Value (US$ Million) Analysis by Seat Type, 2019 to 2034
Figure 178: Middle East and Africa Market Volume (Units) Analysis by Seat Type, 2019 to 2034
Figure 179: Middle East and Africa Market Value Share (%) and BPS Analysis by Seat Type, 2024 to 2034
Figure 180: Middle East and Africa Market Y-o-Y Growth (%) Projections by Seat Type, 2024 to 2034
Figure 181: Middle East and Africa Market Value (US$ Million) Analysis by Vehicle Type, 2019 to 2034
Figure 182: Middle East and Africa Market Volume (Units) Analysis by Vehicle Type, 2019 to 2034
Figure 183: Middle East and Africa Market Value Share (%) and BPS Analysis by Vehicle Type, 2024 to 2034
Figure 184: Middle East and Africa Market Y-o-Y Growth (%) Projections by Vehicle Type, 2024 to 2034
Figure 185: Middle East and Africa Market Value (US$ Million) Analysis by Distribution Channel, 2019 to 2034
Figure 186: Middle East and Africa Market Volume (Units) Analysis by Distribution Channel, 2019 to 2034
Figure 187: Middle East and Africa Market Value Share (%) and BPS Analysis by Distribution Channel, 2024 to 2034
Figure 188: Middle East and Africa Market Y-o-Y Growth (%) Projections by Distribution Channel, 2024 to 2034
Figure 189: Middle East and Africa Market Attractiveness by Seat Type, 2024 to 2034
Figure 190: Middle East and Africa Market Attractiveness by Vehicle Type, 2024 to 2034
Figure 191: Middle East and Africa Market Attractiveness by Distribution Channel, 2024 to 2034
Figure 192: Middle East and Africa Market Attractiveness by Country, 2024 to 2034
As of 2024, the market for automotive seating is expected to be valued at USD 71.48 billion.
By 2034, the market value of automotive seating is expected to reach USD 102.8 billion.
From 2024 to 2034, the automotive seating market is expected to flourish at a CAGR of 3.7%.
The passenger cars segment is accounted to hold a market share of 77.2% in 2024.
China is likely the top-performing market, with a CAGR of 4.6%.
Explore Similar Insights
Thank you!
You will receive an email from our Business Development Manager. Please be sure to check your SPAM/JUNK folder too.