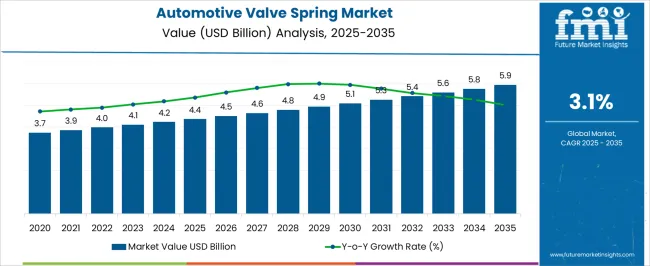
The automotive valve spring market size is projected to be worth USD 4093.6 million in 2023. The market is likely to surpass USD 5663.8 million by 2033 at a CAGR of 3.30% during the forecast period.
The market growth is being propelled by notable industrialization in emerging and established nations and an increased focus on engine performance management. Unfortunately, engine performance is deteriorating every day due to the high pressures and temperatures generated by various engines, such as automotive, industrial manufacturing, and power generation.
Valve springs have emerged as the best solution for many end-use industries to control the valves' movement and keep the engine performance above environmental limits.
Automotive Valve Spring have emerged as the best solution for Increasing demand for high-performance engine and Rising fuel efficiency standards and keep the amount of particulate matter below environmental limits.
Drivers Propelling the Demand for Automotive Valve Spring include:
Challenges for Companies /Manufacturers in the Automotive Valve Spring Market:
Opportunities in the Automotive Valve Spring Industry:
Latest Trends in the Automotive Valve Spring Market:
Attributes | Details |
---|---|
Automotive Valve Spring Market Size (2023) | USD 4093.6 million |
Automotive Valve Spring Market Projected Size (2033) | USD 5663.8 million |
Value CAGR (2023 to 2033) | 3.30% |
From 2018 to 2022, the global automotive valve spring market experienced steady growth, with a CAGR of 1.60%. By 2022, the market reached a value of USD 3781.3 million.
From 2018 to 2022, the demand for automotive valve springs increased due to several factors. The expanding automotive industry, technological advancements in engine technologies and the need for improved performance and efficiency further boosted the demand for high-quality valve springs.
From 2023 to 2033, the forecast for the automotive valve spring market indicates a positive outlook. It is projected to witness a CAGR of 3.30 % during this period, surpassing USD 5663.8 million by 2033.
The forecasted growth can be attributed to several factors. The continued expansion of the automotive industry, particularly in emerging economies, will drive the demand for vehicles and subsequently increase the need for automotive valve springs.
Moreover, the ongoing advancements in engine technologies and the increasing focus on environmental sustainability and regulatory compliance will necessitate the development and adoption of advanced valve spring solutions.
Overall, the automotive valve spring market is poised for significant growth in the forecast period, presenting opportunities for manufacturers, suppliers, and investors to capitalize on the expanding automotive industry and meet the evolving demands of the market.
Country | The United States |
---|---|
Market Size (USD billion) by End of Forecast Period (2033) | USD 623 million |
CAGR % 2023 to End of Forecast (2033) | 3.30% |
The automotive valve spring market in the United States is projected to reach a market size of USD 623 million by 2033, with a CAGR of 3.30%. The market is poised for significant growth driven by the increasing production of vehicles in the country. Several factors are expected to contribute to the demand for automotive valve springs in the United States:
Country | The United Kingdom |
---|---|
Market Size (USD billion) by End of Forecast Period (2033) | USD 556.4 million |
CAGR % 2023 to End of Forecast (2033) | 2.20% |
The automotive valve spring market in the United Kingdom is expected to reach a market size of USD 556.4 billion, with a CAGR of 2.20 % during the forecast period. The market is poised for growth due to the increasing demand for automotive valve springs in the powertrain and construction sectors. The market growth is further driven by the rising awareness of the importance of reliable and durable valve springs in optimizing engine performance and fuel efficiency.
Country | Japan |
---|---|
Market Size (USD billion) by End of Forecast Period (2033) | USD 480.9 million |
CAGR % 2023 to End of Forecast (2033) | 2.70% |
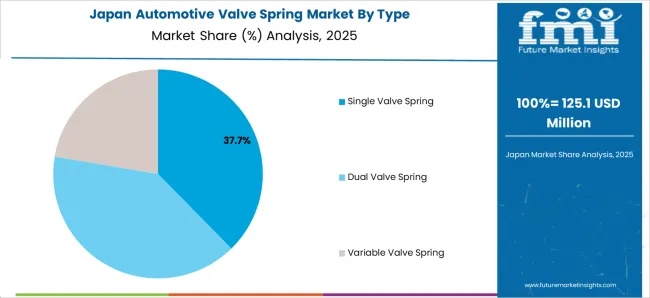
The automotive valve spring market in Japan is projected to achieve a market size of USD 480.9 million, with a CAGR of 2.70 % during the forecast period. The market is poised for significant growth fueled by the adoption of automotive valve springs across diverse industries, including power generation, automotive manufacturing, and chemical production.
The government's initiatives to enhance industrial efficiency and emission control, coupled with growing awareness about the crucial role of high-performance valve springs in engine optimization, are expected to drive market expansion in Japan.
The market is expected to witness notable growth fueled by the powertrain and manufacturing sectors in China. The powertrain sector demands high-quality valve springs for efficient engine performance and durability, while the expanding manufacturing industry relies on valve springs for various machinery and equipment applications. The market growth is further supported by the government's emphasis on reducing emissions and implementing stringent regulations to enhance air quality.
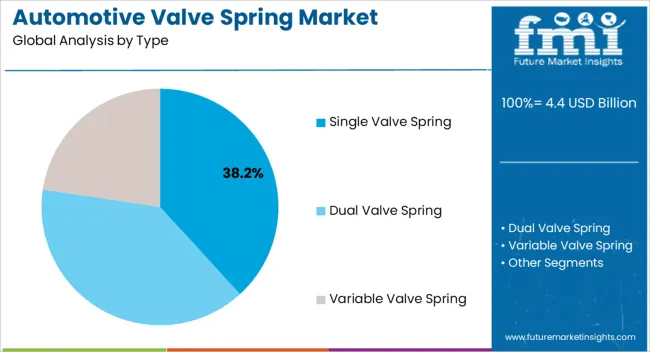
With its cost-effectiveness, high efficiency, and low maintenance requirements, the single valve spring segment is expected to capture a significant market share in 2023.
Single valve springs play a crucial role in ensuring optimal engine performance, offering precise control and reliable operation. Their excellent durability and stability make them an ideal choice for automotive engines across various vehicle types. Whether its compact cars, SUVs, or heavy-duty trucks, the demand for single valve springs remains steady.
This segment captures a significant market share in 2023 due to the increasing demand for fuel-efficient and high-performance vehicles.
Automotive valve springs are essential components in internal combustion engines, and they are responsible for controlling the opening and closing of the valves. The automotive industry is constantly evolving, and the demand for more fuel-efficient and high-performance vehicles is increasing. This is driving the demand for automotive valve springs that can withstand higher temperatures and pressures.
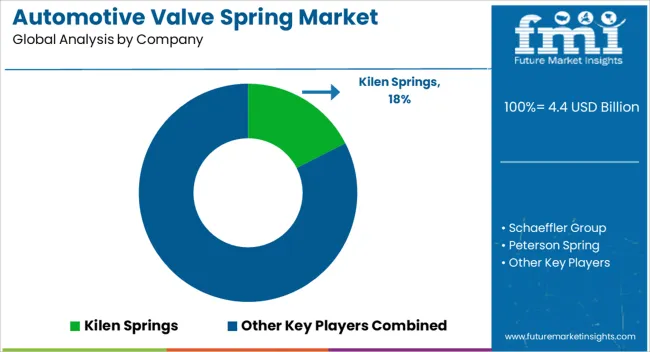
The automotive valve spring industry is highly competitive, with numerous players striving to maintain their market position. To stay competitive, key players employ various strategies and tactics.
Key Strategies Adopted by the Players
Product Innovation
Key players focus on continuous product innovation to develop advanced and high-performance automotive valve springs. They invest in research and development to enhance the durability, efficiency, and reliability of their products.
Quality Assurance
Maintaining high product quality is crucial for key players in the automotive valve spring industry. They implement stringent quality control measures at every stage of the manufacturing process to ensure that their valve springs meet or exceed industry standards.
Strong Supply Chain Management
Key players in the automotive valve spring industry focus on establishing robust supply chain networks. They collaborate closely with suppliers to ensure a steady and reliable supply of raw materials. Efficient supply chain management helps them maintain competitive pricing, timely delivery, and flexibility to meet customer demands.
Sustainability and Compliance
With increasing emphasis on sustainability and environmental regulations, key players in the automotive valve spring industry prioritize eco-friendly manufacturing processes and materials. They strive to minimize their environmental footprint and ensure compliance with relevant regulations.
Key Players in the Automotive Valve Spring Industry
Key Developments in the Automotive Valve Spring Market:
Table 1: Global Market Value (US$ Million) Forecast by Region, 2017 & 2032
Table 2: Global Market Volume (Units) Forecast by Region, 2017 & 2032
Table 3: Global Market Value (US$ Million) Forecast by Type, 2017 & 2032
Table 4: Global Market Volume (Units) Forecast by Type, 2017 & 2032
Table 5: Global Market Value (US$ Million) Forecast by Material, 2017 & 2032
Table 6: Global Market Volume (Units) Forecast by Material, 2017 & 2032
Table 7: Global Market Value (US$ Million) Forecast by Vehicle Type, 2017 & 2032
Table 8: Global Market Volume (Units) Forecast by Vehicle Type, 2017 & 2032
Table 9: Global Market Value (US$ Million) Forecast by Application, 2017 & 2032
Table 10: Global Market Volume (Units) Forecast by Application, 2017 & 2032
Table 11: North America Market Value (US$ Million) Forecast by Country, 2017 & 2032
Table 12: North America Market Volume (Units) Forecast by Country, 2017 & 2032
Table 13: North America Market Value (US$ Million) Forecast by Type, 2017 & 2032
Table 14: North America Market Volume (Units) Forecast by Type, 2017 & 2032
Table 15: North America Market Value (US$ Million) Forecast by Material, 2017 & 2032
Table 16: North America Market Volume (Units) Forecast by Material, 2017 & 2032
Table 17: North America Market Value (US$ Million) Forecast by Vehicle Type, 2017 & 2032
Table 18: North America Market Volume (Units) Forecast by Vehicle Type, 2017 & 2032
Table 19: North America Market Value (US$ Million) Forecast by Application, 2017 & 2032
Table 20: North America Market Volume (Units) Forecast by Application, 2017 & 2032
Table 21: Latin America Market Value (US$ Million) Forecast by Country, 2017 & 2032
Table 22: Latin America Market Volume (Units) Forecast by Country, 2017 & 2032
Table 23: Latin America Market Value (US$ Million) Forecast by Type, 2017 & 2032
Table 24: Latin America Market Volume (Units) Forecast by Type, 2017 & 2032
Table 25: Latin America Market Value (US$ Million) Forecast by Material, 2017 & 2032
Table 26: Latin America Market Volume (Units) Forecast by Material, 2017 & 2032
Table 27: Latin America Market Value (US$ Million) Forecast by Vehicle Type, 2017 & 2032
Table 28: Latin America Market Volume (Units) Forecast by Vehicle Type, 2017 & 2032
Table 29: Latin America Market Value (US$ Million) Forecast by Application, 2017 & 2032
Table 30: Latin America Market Volume (Units) Forecast by Application, 2017 & 2032
Table 31: Western Europe Market Value (US$ Million) Forecast by Country, 2017 & 2032
Table 32: Western Europe Market Volume (Units) Forecast by Country, 2017 & 2032
Table 33: Western Europe Market Value (US$ Million) Forecast by Type, 2017 & 2032
Table 34: Western Europe Market Volume (Units) Forecast by Type, 2017 & 2032
Table 35: Western Europe Market Value (US$ Million) Forecast by Material, 2017 & 2032
Table 36: Western Europe Market Volume (Units) Forecast by Material, 2017 & 2032
Table 37: Western Europe Market Value (US$ Million) Forecast by Vehicle Type, 2017 & 2032
Table 38: Western Europe Market Volume (Units) Forecast by Vehicle Type, 2017 & 2032
Table 39: Western Europe Market Value (US$ Million) Forecast by Application, 2017 & 2032
Table 40: Western Europe Market Volume (Units) Forecast by Application, 2017 & 2032
Table 41: Eastern Europe Market Value (US$ Million) Forecast by Country, 2017 & 2032
Table 42: Eastern Europe Market Volume (Units) Forecast by Country, 2017 & 2032
Table 43: Eastern Europe Market Value (US$ Million) Forecast by Type, 2017 & 2032
Table 44: Eastern Europe Market Volume (Units) Forecast by Type, 2017 & 2032
Table 45: Eastern Europe Market Value (US$ Million) Forecast by Material, 2017 & 2032
Table 46: Eastern Europe Market Volume (Units) Forecast by Material, 2017 & 2032
Table 47: Eastern Europe Market Value (US$ Million) Forecast by Vehicle Type, 2017 & 2032
Table 48: Eastern Europe Market Volume (Units) Forecast by Vehicle Type, 2017 & 2032
Table 49: Eastern Europe Market Value (US$ Million) Forecast by Application, 2017 & 2032
Table 50: Eastern Europe Market Volume (Units) Forecast by Application, 2017 & 2032
Table 51: East Asia Market Value (US$ Million) Forecast by Country, 2017 & 2032
Table 52: East Asia Market Volume (Units) Forecast by Country, 2017 & 2032
Table 53: East Asia Market Value (US$ Million) Forecast by Type, 2017 & 2032
Table 54: East Asia Market Volume (Units) Forecast by Type, 2017 & 2032
Table 55: East Asia Market Value (US$ Million) Forecast by Material, 2017 & 2032
Table 56: East Asia Market Volume (Units) Forecast by Material, 2017 & 2032
Table 57: East Asia Market Value (US$ Million) Forecast by Vehicle Type, 2017 & 2032
Table 58: East Asia Market Volume (Units) Forecast by Vehicle Type, 2017 & 2032
Table 59: East Asia Market Value (US$ Million) Forecast by Application, 2017 & 2032
Table 60: East Asia Market Volume (Units) Forecast by Application, 2017 & 2032
Table 61: South Asia Market Value (US$ Million) Forecast by Country, 2017 & 2032
Table 62: South Asia Market Volume (Units) Forecast by Country, 2017 & 2032
Table 63: South Asia Market Value (US$ Million) Forecast by Type, 2017 & 2032
Table 64: South Asia Market Volume (Units) Forecast by Type, 2017 & 2032
Table 65: South Asia Market Value (US$ Million) Forecast by Material, 2017 & 2032
Table 66: South Asia Market Volume (Units) Forecast by Material, 2017 & 2032
Table 67: South Asia Market Value (US$ Million) Forecast by Vehicle Type, 2017 & 2032
Table 68: South Asia Market Volume (Units) Forecast by Vehicle Type, 2017 & 2032
Table 69: South Asia Market Value (US$ Million) Forecast by Application, 2017 & 2032
Table 70: South Asia Market Volume (Units) Forecast by Application, 2017 & 2032
Table 71: MEA Market Value (US$ Million) Forecast by Country, 2017 & 2032
Table 72: MEA Market Volume (Units) Forecast by Country, 2017 & 2032
Table 73: MEA Market Value (US$ Million) Forecast by Type, 2017 & 2032
Table 74: MEA Market Volume (Units) Forecast by Type, 2017 & 2032
Table 75: MEA Market Value (US$ Million) Forecast by Material, 2017 & 2032
Table 76: MEA Market Volume (Units) Forecast by Material, 2017 & 2032
Table 77: MEA Market Value (US$ Million) Forecast by Vehicle Type, 2017 & 2032
Table 78: MEA Market Volume (Units) Forecast by Vehicle Type, 2017 & 2032
Table 79: MEA Market Value (US$ Million) Forecast by Application, 2017 & 2032
Table 80: MEA Market Volume (Units) Forecast by Application, 2017 & 2032
Figure 1: Global Market Value (US$ Million) by Type, 2022 & 2032
Figure 2: Global Market Value (US$ Million) by Material, 2022 & 2032
Figure 3: Global Market Value (US$ Million) by Vehicle Type, 2022 & 2032
Figure 4: Global Market Value (US$ Million) by Application, 2022 & 2032
Figure 5: Global Market Value (US$ Million) by Region, 2022 & 2032
Figure 6: Global Market Value (US$ Million) Analysis by Region, 2017 & 2032
Figure 7: Global Market Volume (Units) Analysis by Region, 2017 & 2032
Figure 8: Global Market Value Share (%) and BPS Analysis by Region, 2022 & 2032
Figure 9: Global Market Y-o-Y Growth (%) Projections by Region, 2022 to 2032
Figure 10: Global Market Value (US$ Million) Analysis by Type, 2017 & 2032
Figure 11: Global Market Volume (Units) Analysis by Type, 2017 & 2032
Figure 12: Global Market Value Share (%) and BPS Analysis by Type, 2022 & 2032
Figure 13: Global Market Y-o-Y Growth (%) Projections by Type, 2022 to 2032
Figure 14: Global Market Value (US$ Million) Analysis by Material, 2017 & 2032
Figure 15: Global Market Volume (Units) Analysis by Material, 2017 & 2032
Figure 16: Global Market Value Share (%) and BPS Analysis by Material, 2022 & 2032
Figure 17: Global Market Y-o-Y Growth (%) Projections by Material, 2022 to 2032
Figure 18: Global Market Value (US$ Million) Analysis by Vehicle Type, 2017 & 2032
Figure 19: Global Market Volume (Units) Analysis by Vehicle Type, 2017 & 2032
Figure 20: Global Market Value Share (%) and BPS Analysis by Vehicle Type, 2022 & 2032
Figure 21: Global Market Y-o-Y Growth (%) Projections by Vehicle Type, 2022 to 2032
Figure 22: Global Market Value (US$ Million) Analysis by Application, 2017 & 2032
Figure 23: Global Market Volume (Units) Analysis by Application, 2017 & 2032
Figure 24: Global Market Value Share (%) and BPS Analysis by Application, 2022 & 2032
Figure 25: Global Market Y-o-Y Growth (%) Projections by Application, 2022 to 2032
Figure 26: Global Market Attractiveness by Type, 2022 to 2032
Figure 27: Global Market Attractiveness by Material, 2022 to 2032
Figure 28: Global Market Attractiveness by Vehicle Type, 2022 to 2032
Figure 29: Global Market Attractiveness by Application, 2022 to 2032
Figure 30: Global Market Attractiveness by Region, 2022 to 2032
Figure 31: North America Market Value (US$ Million) by Type, 2022 & 2032
Figure 32: North America Market Value (US$ Million) by Material, 2022 & 2032
Figure 33: North America Market Value (US$ Million) by Vehicle Type, 2022 & 2032
Figure 34: North America Market Value (US$ Million) by Application, 2022 & 2032
Figure 35: North America Market Value (US$ Million) by Country, 2022 & 2032
Figure 36: North America Market Value (US$ Million) Analysis by Country, 2017 & 2032
Figure 37: North America Market Volume (Units) Analysis by Country, 2017 & 2032
Figure 38: North America Market Value Share (%) and BPS Analysis by Country, 2022 & 2032
Figure 39: North America Market Y-o-Y Growth (%) Projections by Country, 2022 to 2032
Figure 40: North America Market Value (US$ Million) Analysis by Type, 2017 & 2032
Figure 41: North America Market Volume (Units) Analysis by Type, 2017 & 2032
Figure 42: North America Market Value Share (%) and BPS Analysis by Type, 2022 & 2032
Figure 43: North America Market Y-o-Y Growth (%) Projections by Type, 2022 to 2032
Figure 44: North America Market Value (US$ Million) Analysis by Material, 2017 & 2032
Figure 45: North America Market Volume (Units) Analysis by Material, 2017 & 2032
Figure 46: North America Market Value Share (%) and BPS Analysis by Material, 2022 & 2032
Figure 47: North America Market Y-o-Y Growth (%) Projections by Material, 2022 to 2032
Figure 48: North America Market Value (US$ Million) Analysis by Vehicle Type, 2017 & 2032
Figure 49: North America Market Volume (Units) Analysis by Vehicle Type, 2017 & 2032
Figure 50: North America Market Value Share (%) and BPS Analysis by Vehicle Type, 2022 & 2032
Figure 51: North America Market Y-o-Y Growth (%) Projections by Vehicle Type, 2022 to 2032
Figure 52: North America Market Value (US$ Million) Analysis by Application, 2017 & 2032
Figure 53: North America Market Volume (Units) Analysis by Application, 2017 & 2032
Figure 54: North America Market Value Share (%) and BPS Analysis by Application, 2022 & 2032
Figure 55: North America Market Y-o-Y Growth (%) Projections by Application, 2022 to 2032
Figure 56: North America Market Attractiveness by Type, 2022 to 2032
Figure 57: North America Market Attractiveness by Material, 2022 to 2032
Figure 58: North America Market Attractiveness by Vehicle Type, 2022 to 2032
Figure 59: North America Market Attractiveness by Application, 2022 to 2032
Figure 60: North America Market Attractiveness by Country, 2022 to 2032
Figure 61: Latin America Market Value (US$ Million) by Type, 2022 & 2032
Figure 62: Latin America Market Value (US$ Million) by Material, 2022 & 2032
Figure 63: Latin America Market Value (US$ Million) by Vehicle Type, 2022 & 2032
Figure 64: Latin America Market Value (US$ Million) by Application, 2022 & 2032
Figure 65: Latin America Market Value (US$ Million) by Country, 2022 & 2032
Figure 66: Latin America Market Value (US$ Million) Analysis by Country, 2017 & 2032
Figure 67: Latin America Market Volume (Units) Analysis by Country, 2017 & 2032
Figure 68: Latin America Market Value Share (%) and BPS Analysis by Country, 2022 & 2032
Figure 69: Latin America Market Y-o-Y Growth (%) Projections by Country, 2022 to 2032
Figure 70: Latin America Market Value (US$ Million) Analysis by Type, 2017 & 2032
Figure 71: Latin America Market Volume (Units) Analysis by Type, 2017 & 2032
Figure 72: Latin America Market Value Share (%) and BPS Analysis by Type, 2022 & 2032
Figure 73: Latin America Market Y-o-Y Growth (%) Projections by Type, 2022 to 2032
Figure 74: Latin America Market Value (US$ Million) Analysis by Material, 2017 & 2032
Figure 75: Latin America Market Volume (Units) Analysis by Material, 2017 & 2032
Figure 76: Latin America Market Value Share (%) and BPS Analysis by Material, 2022 & 2032
Figure 77: Latin America Market Y-o-Y Growth (%) Projections by Material, 2022 to 2032
Figure 78: Latin America Market Value (US$ Million) Analysis by Vehicle Type, 2017 & 2032
Figure 79: Latin America Market Volume (Units) Analysis by Vehicle Type, 2017 & 2032
Figure 80: Latin America Market Value Share (%) and BPS Analysis by Vehicle Type, 2022 & 2032
Figure 81: Latin America Market Y-o-Y Growth (%) Projections by Vehicle Type, 2022 to 2032
Figure 82: Latin America Market Value (US$ Million) Analysis by Application, 2017 & 2032
Figure 83: Latin America Market Volume (Units) Analysis by Application, 2017 & 2032
Figure 84: Latin America Market Value Share (%) and BPS Analysis by Application, 2022 & 2032
Figure 85: Latin America Market Y-o-Y Growth (%) Projections by Application, 2022 to 2032
Figure 86: Latin America Market Attractiveness by Type, 2022 to 2032
Figure 87: Latin America Market Attractiveness by Material, 2022 to 2032
Figure 88: Latin America Market Attractiveness by Vehicle Type, 2022 to 2032
Figure 89: Latin America Market Attractiveness by Application, 2022 to 2032
Figure 90: Latin America Market Attractiveness by Country, 2022 to 2032
Figure 91: Western Europe Market Value (US$ Million) by Type, 2022 & 2032
Figure 92: Western Europe Market Value (US$ Million) by Material, 2022 & 2032
Figure 93: Western Europe Market Value (US$ Million) by Vehicle Type, 2022 & 2032
Figure 94: Western Europe Market Value (US$ Million) by Application, 2022 & 2032
Figure 95: Western Europe Market Value (US$ Million) by Country, 2022 & 2032
Figure 96: Western Europe Market Value (US$ Million) Analysis by Country, 2017 & 2032
Figure 97: Western Europe Market Volume (Units) Analysis by Country, 2017 & 2032
Figure 98: Western Europe Market Value Share (%) and BPS Analysis by Country, 2022 & 2032
Figure 99: Western Europe Market Y-o-Y Growth (%) Projections by Country, 2022 to 2032
Figure 100: Western Europe Market Value (US$ Million) Analysis by Type, 2017 & 2032
Figure 101: Western Europe Market Volume (Units) Analysis by Type, 2017 & 2032
Figure 102: Western Europe Market Value Share (%) and BPS Analysis by Type, 2022 & 2032
Figure 103: Western Europe Market Y-o-Y Growth (%) Projections by Type, 2022 to 2032
Figure 104: Western Europe Market Value (US$ Million) Analysis by Material, 2017 & 2032
Figure 105: Western Europe Market Volume (Units) Analysis by Material, 2017 & 2032
Figure 106: Western Europe Market Value Share (%) and BPS Analysis by Material, 2022 & 2032
Figure 107: Western Europe Market Y-o-Y Growth (%) Projections by Material, 2022 to 2032
Figure 108: Western Europe Market Value (US$ Million) Analysis by Vehicle Type, 2017 & 2032
Figure 109: Western Europe Market Volume (Units) Analysis by Vehicle Type, 2017 & 2032
Figure 110: Western Europe Market Value Share (%) and BPS Analysis by Vehicle Type, 2022 & 2032
Figure 111: Western Europe Market Y-o-Y Growth (%) Projections by Vehicle Type, 2022 to 2032
Figure 112: Western Europe Market Value (US$ Million) Analysis by Application, 2017 & 2032
Figure 113: Western Europe Market Volume (Units) Analysis by Application, 2017 & 2032
Figure 114: Western Europe Market Value Share (%) and BPS Analysis by Application, 2022 & 2032
Figure 115: Western Europe Market Y-o-Y Growth (%) Projections by Application, 2022 to 2032
Figure 116: Western Europe Market Attractiveness by Type, 2022 to 2032
Figure 117: Western Europe Market Attractiveness by Material, 2022 to 2032
Figure 118: Western Europe Market Attractiveness by Vehicle Type, 2022 to 2032
Figure 119: Western Europe Market Attractiveness by Application, 2022 to 2032
Figure 120: Western Europe Market Attractiveness by Country, 2022 to 2032
Figure 121: Eastern Europe Market Value (US$ Million) by Type, 2022 & 2032
Figure 122: Eastern Europe Market Value (US$ Million) by Material, 2022 & 2032
Figure 123: Eastern Europe Market Value (US$ Million) by Vehicle Type, 2022 & 2032
Figure 124: Eastern Europe Market Value (US$ Million) by Application, 2022 & 2032
Figure 125: Eastern Europe Market Value (US$ Million) by Country, 2022 & 2032
Figure 126: Eastern Europe Market Value (US$ Million) Analysis by Country, 2017 & 2032
Figure 127: Eastern Europe Market Volume (Units) Analysis by Country, 2017 & 2032
Figure 128: Eastern Europe Market Value Share (%) and BPS Analysis by Country, 2022 & 2032
Figure 129: Eastern Europe Market Y-o-Y Growth (%) Projections by Country, 2022 to 2032
Figure 130: Eastern Europe Market Value (US$ Million) Analysis by Type, 2017 & 2032
Figure 131: Eastern Europe Market Volume (Units) Analysis by Type, 2017 & 2032
Figure 132: Eastern Europe Market Value Share (%) and BPS Analysis by Type, 2022 & 2032
Figure 133: Eastern Europe Market Y-o-Y Growth (%) Projections by Type, 2022 to 2032
Figure 134: Eastern Europe Market Value (US$ Million) Analysis by Material, 2017 & 2032
Figure 135: Eastern Europe Market Volume (Units) Analysis by Material, 2017 & 2032
Figure 136: Eastern Europe Market Value Share (%) and BPS Analysis by Material, 2022 & 2032
Figure 137: Eastern Europe Market Y-o-Y Growth (%) Projections by Material, 2022 to 2032
Figure 138: Eastern Europe Market Value (US$ Million) Analysis by Vehicle Type, 2017 & 2032
Figure 139: Eastern Europe Market Volume (Units) Analysis by Vehicle Type, 2017 & 2032
Figure 140: Eastern Europe Market Value Share (%) and BPS Analysis by Vehicle Type, 2022 & 2032
Figure 141: Eastern Europe Market Y-o-Y Growth (%) Projections by Vehicle Type, 2022 to 2032
Figure 142: Eastern Europe Market Value (US$ Million) Analysis by Application, 2017 & 2032
Figure 143: Eastern Europe Market Volume (Units) Analysis by Application, 2017 & 2032
Figure 144: Eastern Europe Market Value Share (%) and BPS Analysis by Application, 2022 & 2032
Figure 145: Eastern Europe Market Y-o-Y Growth (%) Projections by Application, 2022 to 2032
Figure 146: Eastern Europe Market Attractiveness by Type, 2022 to 2032
Figure 147: Eastern Europe Market Attractiveness by Material, 2022 to 2032
Figure 148: Eastern Europe Market Attractiveness by Vehicle Type, 2022 to 2032
Figure 149: Eastern Europe Market Attractiveness by Application, 2022 to 2032
Figure 150: Eastern Europe Market Attractiveness by Country, 2022 to 2032
Figure 151: East Asia Market Value (US$ Million) by Type, 2022 & 2032
Figure 152: East Asia Market Value (US$ Million) by Material, 2022 & 2032
Figure 153: East Asia Market Value (US$ Million) by Vehicle Type, 2022 & 2032
Figure 154: East Asia Market Value (US$ Million) by Application, 2022 & 2032
Figure 155: East Asia Market Value (US$ Million) by Country, 2022 & 2032
Figure 156: East Asia Market Value (US$ Million) Analysis by Country, 2017 & 2032
Figure 157: East Asia Market Volume (Units) Analysis by Country, 2017 & 2032
Figure 158: East Asia Market Value Share (%) and BPS Analysis by Country, 2022 & 2032
Figure 159: East Asia Market Y-o-Y Growth (%) Projections by Country, 2022 to 2032
Figure 160: East Asia Market Value (US$ Million) Analysis by Type, 2017 & 2032
Figure 161: East Asia Market Volume (Units) Analysis by Type, 2017 & 2032
Figure 162: East Asia Market Value Share (%) and BPS Analysis by Type, 2022 & 2032
Figure 163: East Asia Market Y-o-Y Growth (%) Projections by Type, 2022 to 2032
Figure 164: East Asia Market Value (US$ Million) Analysis by Material, 2017 & 2032
Figure 165: East Asia Market Volume (Units) Analysis by Material, 2017 & 2032
Figure 166: East Asia Market Value Share (%) and BPS Analysis by Material, 2022 & 2032
Figure 167: East Asia Market Y-o-Y Growth (%) Projections by Material, 2022 to 2032
Figure 168: East Asia Market Value (US$ Million) Analysis by Vehicle Type, 2017 & 2032
Figure 169: East Asia Market Volume (Units) Analysis by Vehicle Type, 2017 & 2032
Figure 170: East Asia Market Value Share (%) and BPS Analysis by Vehicle Type, 2022 & 2032
Figure 171: East Asia Market Y-o-Y Growth (%) Projections by Vehicle Type, 2022 to 2032
Figure 172: East Asia Market Value (US$ Million) Analysis by Application, 2017 & 2032
Figure 173: East Asia Market Volume (Units) Analysis by Application, 2017 & 2032
Figure 174: East Asia Market Value Share (%) and BPS Analysis by Application, 2022 & 2032
Figure 175: East Asia Market Y-o-Y Growth (%) Projections by Application, 2022 to 2032
Figure 176: East Asia Market Attractiveness by Type, 2022 to 2032
Figure 177: East Asia Market Attractiveness by Material, 2022 to 2032
Figure 178: East Asia Market Attractiveness by Vehicle Type, 2022 to 2032
Figure 179: East Asia Market Attractiveness by Application, 2022 to 2032
Figure 180: East Asia Market Attractiveness by Country, 2022 to 2032
Figure 181: South Asia Market Value (US$ Million) by Type, 2022 & 2032
Figure 182: South Asia Market Value (US$ Million) by Material, 2022 & 2032
Figure 183: South Asia Market Value (US$ Million) by Vehicle Type, 2022 & 2032
Figure 184: South Asia Market Value (US$ Million) by Application, 2022 & 2032
Figure 185: South Asia Market Value (US$ Million) by Country, 2022 & 2032
Figure 186: South Asia Market Value (US$ Million) Analysis by Country, 2017 & 2032
Figure 187: South Asia Market Volume (Units) Analysis by Country, 2017 & 2032
Figure 188: South Asia Market Value Share (%) and BPS Analysis by Country, 2022 & 2032
Figure 189: South Asia Market Y-o-Y Growth (%) Projections by Country, 2022 to 2032
Figure 190: South Asia Market Value (US$ Million) Analysis by Type, 2017 & 2032
Figure 191: South Asia Market Volume (Units) Analysis by Type, 2017 & 2032
Figure 192: South Asia Market Value Share (%) and BPS Analysis by Type, 2022 & 2032
Figure 193: South Asia Market Y-o-Y Growth (%) Projections by Type, 2022 to 2032
Figure 194: South Asia Market Value (US$ Million) Analysis by Material, 2017 & 2032
Figure 195: South Asia Market Volume (Units) Analysis by Material, 2017 & 2032
Figure 196: South Asia Market Value Share (%) and BPS Analysis by Material, 2022 & 2032
Figure 197: South Asia Market Y-o-Y Growth (%) Projections by Material, 2022 to 2032
Figure 198: South Asia Market Value (US$ Million) Analysis by Vehicle Type, 2017 & 2032
Figure 199: South Asia Market Volume (Units) Analysis by Vehicle Type, 2017 & 2032
Figure 200: South Asia Market Value Share (%) and BPS Analysis by Vehicle Type, 2022 & 2032
Figure 201: South Asia Market Y-o-Y Growth (%) Projections by Vehicle Type, 2022 to 2032
Figure 202: South Asia Market Value (US$ Million) Analysis by Application, 2017 & 2032
Figure 203: South Asia Market Volume (Units) Analysis by Application, 2017 & 2032
Figure 204: South Asia Market Value Share (%) and BPS Analysis by Application, 2022 & 2032
Figure 205: South Asia Market Y-o-Y Growth (%) Projections by Application, 2022 to 2032
Figure 206: South Asia Market Attractiveness by Type, 2022 to 2032
Figure 207: South Asia Market Attractiveness by Material, 2022 to 2032
Figure 208: South Asia Market Attractiveness by Vehicle Type, 2022 to 2032
Figure 209: South Asia Market Attractiveness by Application, 2022 to 2032
Figure 210: South Asia Market Attractiveness by Country, 2022 to 2032
Figure 211: MEA Market Value (US$ Million) by Type, 2022 & 2032
Figure 212: MEA Market Value (US$ Million) by Material, 2022 & 2032
Figure 213: MEA Market Value (US$ Million) by Vehicle Type, 2022 & 2032
Figure 214: MEA Market Value (US$ Million) by Application, 2022 & 2032
Figure 215: MEA Market Value (US$ Million) by Country, 2022 & 2032
Figure 216: MEA Market Value (US$ Million) Analysis by Country, 2017 & 2032
Figure 217: MEA Market Volume (Units) Analysis by Country, 2017 & 2032
Figure 218: MEA Market Value Share (%) and BPS Analysis by Country, 2022 & 2032
Figure 219: MEA Market Y-o-Y Growth (%) Projections by Country, 2022 to 2032
Figure 220: MEA Market Value (US$ Million) Analysis by Type, 2017 & 2032
Figure 221: MEA Market Volume (Units) Analysis by Type, 2017 & 2032
Figure 222: MEA Market Value Share (%) and BPS Analysis by Type, 2022 & 2032
Figure 223: MEA Market Y-o-Y Growth (%) Projections by Type, 2022 to 2032
Figure 224: MEA Market Value (US$ Million) Analysis by Material, 2017 & 2032
Figure 225: MEA Market Volume (Units) Analysis by Material, 2017 & 2032
Figure 226: MEA Market Value Share (%) and BPS Analysis by Material, 2022 & 2032
Figure 227: MEA Market Y-o-Y Growth (%) Projections by Material, 2022 to 2032
Figure 228: MEA Market Value (US$ Million) Analysis by Vehicle Type, 2017 & 2032
Figure 229: MEA Market Volume (Units) Analysis by Vehicle Type, 2017 & 2032
Figure 230: MEA Market Value Share (%) and BPS Analysis by Vehicle Type, 2022 & 2032
Figure 231: MEA Market Y-o-Y Growth (%) Projections by Vehicle Type, 2022 to 2032
Figure 232: MEA Market Value (US$ Million) Analysis by Application, 2017 & 2032
Figure 233: MEA Market Volume (Units) Analysis by Application, 2017 & 2032
Figure 234: MEA Market Value Share (%) and BPS Analysis by Application, 2022 & 2032
Figure 235: MEA Market Y-o-Y Growth (%) Projections by Application, 2022 to 2032
Figure 236: MEA Market Attractiveness by Type, 2022 to 2032
Figure 237: MEA Market Attractiveness by Material, 2022 to 2032
Figure 238: MEA Market Attractiveness by Vehicle Type, 2022 to 2032
Figure 239: MEA Market Attractiveness by Application, 2022 to 2032
Figure 240: MEA Market Attractiveness by Country, 2022 to 2032
Demand for Aflatoxicosis treatment in India is poised to expand at a 3.5% CAGR till 2033.
The value of the total market in 2023 could sum up to USD 4,093.6 million.
Demand for automotive valve springs might expand at a 3.3% CAGR through 2033.
Single-valve segment makes the leading segment due to cost-effectiveness.
The regional market is projected to witness a 3.3% CAGR through 2033.
Explore Automotive Auxiliaries Insights
Thank you!
You will receive an email from our Business Development Manager. Please be sure to check your SPAM/JUNK folder too.