Reports

- Global Locations -

Headquarters

Future Market Insights, Inc.

Christiana Corporate, 200
Continental Drive, Suite 401,
Newark, Delaware - 19713,
United States

T: +1-845-579-5705

Americas

Future Market Insights, Inc.

616 Corporate Way, Suite 2-9018,
Valley Cottage, NY 10989, United States

T: +1-347-918-3531

MEA

Future Market Insights

1602-6 Jumeirah Bay X2 Tower, Plot No: JLT-PH2-X2A,
Jumeirah Lakes Towers, Dubai,
United Arab Emirates

Europe

Future Market Insights

3rd Floor, 207 Regent Street,
W1B 3HH London
United Kingdom

T: + 44 (0) 20 8123 9659
D: +44 (0) 20 3287 4268

Asia Pacific

Future Market Insights

IndiaLand Global Tech Park, Unit UG-1, Behind Grand HighStreet, Phase 1, Hinjawadi, MH, Pune – 411057, India

Automotive Tire Accessories Market Outlook (2023 to 2033)

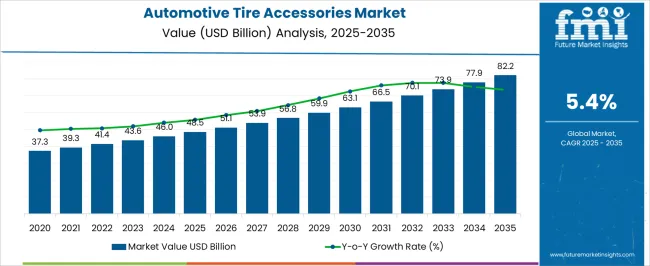
The automotive tire accessories market is poised to witness substantial growth in the coming years. By 2023, the market is projected to reach a value of US$ 43.4 billion, and it is expected to surpass US$ 75.5 billion by 2033, with a CAGR of 5.7 % during the forecast period. The increasing demand for automotive tire accessories can be attributed to various factors, including the rising number of vehicles on the road and the growing awareness of vehicle safety and maintenance.

One of the key drivers for the growth of the automotive tire accessories market is the expanding automotive industry worldwide. With the steady increase in vehicle production, there is a parallel demand for accessories that enhance the performance and safety of tires. Automotive tire accessories such as tire pressure gauges, tire inflators, tire repair kits, tire chains, wheel covers, and valve caps play a crucial role in maintaining optimal tire conditions, improving fuel efficiency, and ensuring a smooth driving experience.

Other Drivers Propelling the Demand for Automotive Tire Accessories include:

  • The rising popularity of autonomous vehicles and the need for advanced tire sensors and monitoring technologies are also driving the demand for tire accessories.
  • The growing popularity of off-road and recreational vehicles is fueling the demand for automotive tire accessories like tire chains, which provide improved traction and control in challenging terrain.
  • The increasing focus on road safety and accident prevention is boosting the demand for accessories such as tire pressure gauges and tire repair kits.

Challenges for Companies /Manufacturers in the Automotive tire Market:

  • The diverse range of vehicle makes and models, each with different tire specifications and sizes, presents a challenge for companies in terms of producing and stocking a wide variety of tire accessories to cater to the market demand.
  • Adapting to evolving technology and changing customer preferences, such as the increasing demand for smart tire accessories or eco-friendly options.
  • Keeping up with regulations and standards related to automotive safety and environmental impact.

Opportunities in the Automotive tire Accessories Industry:

  • The increasing demand for automotive tire accessories in emerging economies presents significant opportunities for manufacturers.
  • The automotive tire accessories industry is constantly evolving, and new technologies such as smart sensors, wireless connectivity. The rise of e-commerce and 3D printing technology has made it possible to offer customized and personalized tire accessories, allowing consumers to express their individual style and preferences.
  • IoT-enabled tires can collect data on tire performance and provide drivers with insights on how to improve fuel efficiency and extend tire life. AI-powered tire design tools can help companies develop tires that are more tailored to specific needs.

Latest Trends in the Automotive Tire Accessories Market:

  • The development of smart tire accessories that can collect data on tire performance and provide drivers with insights on how to improve fuel efficiency and extend tire life is a growing trend.
  • The use of 3D printing technology to create custom-made tire accessories is a growing trend. This technology allows for the creation of lightweight, durable, and high-performance tire accessories that are tailored to specific needs.
  • The development of self-repairing tire accessories is a growing trend. This technology allows for the repair of minor damage to tires, such as cuts and tears, without the need for replacement.
Attributes Details
Automotive tire Accessories Market Size (2023) US$ 43.4 billion
Automotive tire Accessories Market Projected Size (2033) US$ 75.5 billion
Value CAGR (2023 to 2033) 5.7%

Don't pay for what you don't need

Customize your report by selecting specific countries or regions and save 30%!

2018 to 2022 Automotive Tire Accessories Demand Outlook Compared to 2023 to 2033 Forecast

From 2018 to 2022, the global automotive tire accessory market experienced a CAGR of 5.7 %, reaching a market size of US$ 41.4 billion in 2022.

During this period, the automotive tire accessory industry witnessed steady growth driven by several factors. Firstly, the increasing production and sales of automobiles worldwide contributed to the demand for tire accessories such as tire pressure monitoring systems, tire inflators, and tire repair kits. As the automotive industry continued to expand, the need for efficient and reliable tire accessories grew as well.

Future Forecast for Automotive Tire Accessories Industry

Looking ahead, the global automotive tire accessory market is expected to continue its upward trajectory from 2023 to 2033, with a forecasted CAGR of 5.7 %. Factors such as the ongoing expansion of the automotive industry, advancements in tire technology, and the increasing focus on vehicle safety and performance will drive the demand for tire accessories. Additionally, the emergence of electric vehicles and autonomous vehicles is likely to create new opportunities for tire accessory manufacturers to cater to the specific requirements of these vehicles.

Nikhil Kaitwade
Nikhil Kaitwade

Principal Consultant

Talk to Analyst

Find your sweet spots for generating winning opportunities in this market.

Comparative View of the Automotive Tire Accessories

Automotive Tire Accessories:

Attributes Automotive Tire Accessories
CAGR (2023 to 2033) 5.7%
Market Value (2033) US$ 43.4 billion
Opportunity IoT-enabled tires can collect data on tire performance and provide drivers with insights on how to improve fuel efficiency and extend tire life. AI-powered tire design tools can help companies develop tires that are more tailored to specific needs.
Key Trends The use of 3D printing technology to create custom-made tire accessories is a growing trend. This technology allows for the creation of lightweight, durable, and high-performance tire accessories that are tailored to specific needs.

Tire & Wheel Cleaners Market:

Attributes Tire & Wheel Cleaners Market
CAGR (2023 to 2033) 2.5%
Market Value (2033) US$ 2.03 billion
Opportunity Consumers are increasingly concerned about the environmental impact of products they use. This has led to a demand for eco-friendly tire and wheel cleaners that are biodegradable, non-toxic, and free from harmful chemicals.
Key Trends Advancements in technology are shaping the tire and wheel cleaners market. For instance, the development of Nano-coatings and protective sealants provides additional benefits like long-lasting shine and protection against dirt, UV rays, and brake dust.

Tire Pressure Monitoring System market:

Attributes Tire Pressure Monitoring System market
CAGR (2023 to 2033) 10.3%
Market Value (2033) US$ 7.7 billion
Opportunity The growing usage of sensor Technology in vehicles , as well as the rapid development of integrated sensor system , are anticipated top drive sales of the pressure monitoring system in the automotive sector
Key Trends The automotive industry is introducing features that reduce collision impact, decreased fatalities, and improve overall vehicle safety, thereby fueling growth in the automotive TPMS market.

Country-Wise Insights

Automotive Tire Accessories Market to Surge in the United States amid Growing Concerns over Road Safety

Country The United States
Market Size (US$ billion) by End of Forecast Period (2033) US$ 8.33 billion
CAGR % 2023 to End of Forecast (2033) 5.2%

By 2033, the United States market for vehicle tire accessories is projected to be worth US $8.33 billion, growing at a CAGR of 5.2%. Due to the increased emphasis on road safety, the automobile tire accessories market in the United States is anticipated to expand. Other elements that are anticipated to influence the demand for automobile tire accessories in the nation include:

  • A growing number of vehicles on the road.
  • The increasing recognition of the significance of road safety
  • The strict guidelines the government has put in place for road safety

Notable Growth Expected in China's Automotive Tire Accessories Market as Government Focuses on Road Safety

Country China
Market Size (US$ billion) by End of Forecast Period (2033) US$ 6.79 billion
CAGR % 2023 to End of Forecast (2033) 6.0 %

During the projected period, it is expected that the automotive tire accessories market in China will grow at a CAGR of 6.0 % and reach a market share of US$ 6.79 billion. Due to the rising demand for automobiles, the automotive tire accessories market in China is anticipated to rise significantly. In addition, the government's emphasis on traffic safety and the adoption of strict laws to reduce traffic accidents are anticipated to fuel market expansion.
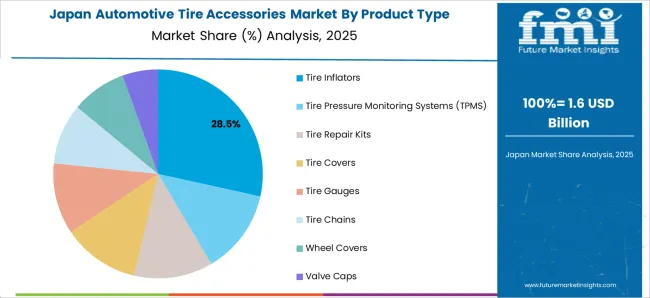
Automotive Tire Accessories Market in Japan to Witness Robust Growth

Country Japan
Market Size (US$ billion) by End of Forecast Period (2033) US$ 781.2 million
CAGR % 2023 to End of Forecast (2033) 5.9 %

By 2033, it is anticipated that the Japanese market for vehicle tire accessories will be worth US$ 781.2 million, growing at a CAGR of 5.9 %. The increasing use of automotive tire accessories in a variety of Vehicles, including passenger cars, commercial vehicles, and two-wheelers, is credited with driving the market's expansion. In addition, the government's programmers to encourage the adoption of environmentally friendly tire accessories and the rising demand for fuel-efficient cars are anticipated to spur market expansion.

Get the data you need at a Fraction of the cost

Personalize your report by choosing insights you need
and save 40%!

Category-Wise Insights

What are the key factors driving the increasing popularity of personalized and customized vehicle wheel covers?

A variety of factors, including changing consumer preferences, advancements in technology, and the rise of e-commerce, are driving the popularity of personalized and customized vehicle wheel covers. Consumers are seeking unique styles and personal expression, staying current with the latest trends, and reducing their environmental impact. The growth of e-commerce has made it easier for customers to find and purchase personalized and customized wheel covers. Advances in technology, such as 3D printing, have made it more accessible and cost-effective for customers to design their own customized wheel covers.
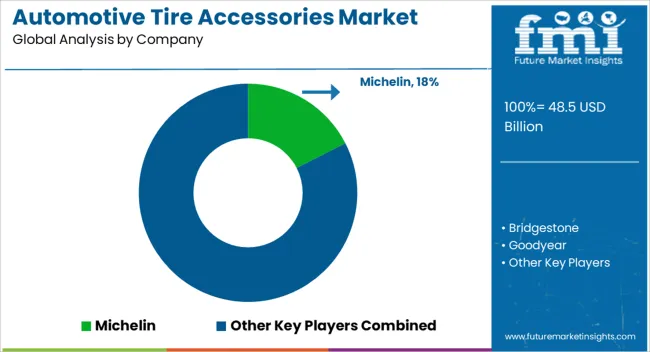
How Key Players Stay Competitive in the Automotive Tire Accessories Industry?

The automotive tire accessories industry is highly competitive, with numerous players vying for market share. In such a scenario, key players must adopt effective strategies to stay ahead of the competition.

Key Strategies Adopted by the Players

  • Product Innovation

Product Innovation: Businesses in the automobile tire accessories industry spend a lot of money on Research & Development to create new products that improve use, performance, and durability. Product innovation enables businesses to stand out from rivals and satisfy changing consumer wants.

  • Strategic Partnerships and Collaborations

Key players in the sector collaborate and develop strategic alliances with other businesses to benefit from their knowledge, broaden their market reach, and gain access to fresh technology or distribution channels. Manufacturers of tires, vehicles, or other parties with an interest in the automotive sector may collaborate.

  • Expansion into Emerging Markets

In developing nations like China, India, and Southeast Asia, the automobile sector is expanding significantly. Key players in the tire accessory market are creating local production facilities, distribution networks, and partnerships with regional distributors to increase their presence in these areas.

  • Sustainable and eco-friendly solutions

Sustainable and eco-friendly solutions are being prioritized by major participants in the automotive tire accessories market due to rising environmental awareness. This entails creating environmentally friendly materials, starting recycling programmers, and using energy-efficient production techniques. Businesses satisfy the interests of consumers who care about the environment by providing sustainable solutions.

Key Players in the Automotive Tire Accessories Industry

  • Michelin
  • Bridgestone
  • Goodyear
  • Continental
  • Pirelli
  • Slime
  • Black Jack Tire Repair
  • Gorilla Automotive
  • Viair Corporation
  • Stop & Go International

Key Developments in the Automotive Tire Accessories Market:

  • In 2023, Pirelli has been awarded the 'Supplier of Excellence' award by Jaguar Land Rover, recognizing the company's outstanding performance and contributions to the automotive manufacturer. The award is a testament to Pirelli's commitment to quality and innovation, and its ability to deliver high-quality products and services to its customers. Pirelli's strong partnership with Jaguar Land Rover and its position as a leading supplier in the automotive industry.
  • In 2022, Bridgestone, a prominent player in the automotive tire accessories market, has embarked on a strategic collaboration with Microsoft to accelerate the integration of advanced tire analytics across its global portfolio of connected tires and mobility solutions. This collaboration represents a significant key development in the industry, highlighting the importance of data-driven insights and digital connectivity in the tire accessories sector.
  • Continental, a global automotive supplier, has commenced the production of tire pressure monitoring systems (TPMS) at its plant in Bangalore. This development signifies Continental's commitment to expanding its tire accessories portfolio and meeting the growing demand for TPMS in the automotive industry.

Segmentation Analysis of the Automotive Tire Accessories Market

By Product Type:

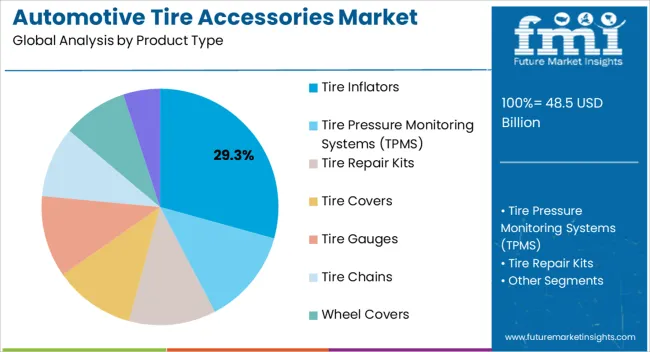
  • Tire Inflators
  • Tire Pressure Monitoring Systems (TPMS)
  • Tire Repair Kits
  • Tire Covers
  • Tire Gauges
  • Tire Chains
  • Wheel Covers
  • Valve Caps

By Vehicle Type:

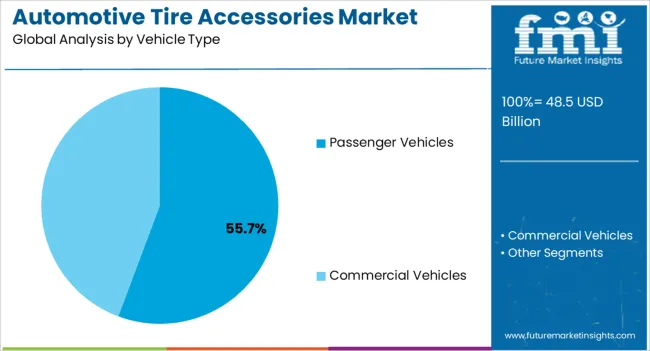
  • Passenger Vehicles
  • Commercial Vehicles

By Distribution Channel:

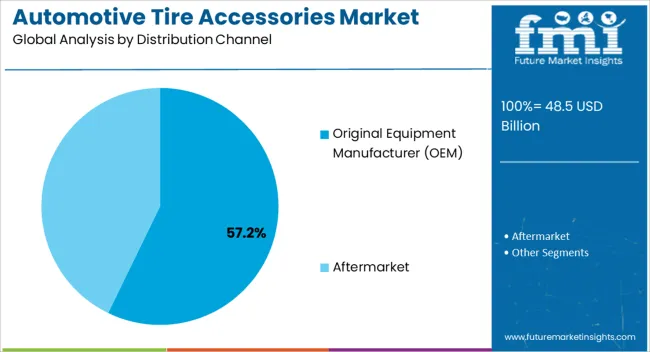
  • Original Equipment Manufacturer (OEM)
  • Aftermarket

By Region:

  • North America
  • Latin America
  • Western Europe
  • Eastern Europe
  • East Asia
  • South Asia
  • The Middle East & Africa

Frequently Asked Questions

What is the Market Outlook for Automotive Tire Accessories?

The market is anticipated to exhibit a CAGR of 5.7% through 2033.

What was the Global Automotive Tire Accessories Market Size in 2022?

The automotive tire accessories market reached US$ 41.4 billion in 2022.

Which Country is the Prime Automotive Tire Accessories Market?

The United States commands the global automotive tire accessories market.

What are the Prevailing Trends Shaping the Market Landscape?

Dominant trends molding the market include digitization and customization.

Which Leading Businesses Command a Large Portion of the Market?

Michelin, Bridgestone, and Slime dominate the automotive tire accessories market.

Table of Content

1. Executive Summary

    1.1. Global Market Outlook

    1.2. Demand Side Trends

    1.3. Supply Side Trends

    1.4. Technology Roadmap

    1.5. Analysis and Recommendations

2. Market Overview

    2.1. Market Coverage / Taxonomy

    2.2. Market Definition / Scope / Limitations

3. Key Market Trends

    3.1. Key Trends Impacting the Market

    3.2. Product Innovation / Development Trends

4. Key Success Factors

    4.1. Product Adoption / Usage Analysis

    4.2. Product USPs / Features

    4.3. Strategic Promotional Strategies

5. Global Market Demand Analysis 2018 to 2022 and Forecast, 2023 to 2033

    5.1. Historical Market Volume (Units) Analysis, 2018 to 2022

    5.2. Current and Future Market Volume (Units) Projections, 2023 to 2033

    5.3. Y-o-Y Growth Trend Analysis

6. Global Market - Pricing Analysis

    6.1. Regional Pricing Analysis By Product

    6.2. Global Average Pricing Analysis Benchmark

7. Global Market Demand (in Value or Size in US$ Million) Analysis 2018 to 2022 and Forecast, 2023 to 2033

    7.1. Historical Market Value (US$ Million) Analysis, 2018 to 2022

    7.2. Current and Future Market Value (US$ Million) Projections, 2023 to 2033

        7.2.1. Y-o-Y Growth Trend Analysis

        7.2.2. Absolute $ Opportunity Analysis

8. Market Background

    8.1. Macro-Economic Factors

        8.1.1. Global GDP Growth Outlook

        8.1.2. Global Automotive industry Overview

        8.1.3. Manufacturing Value-Added

        8.1.4. Industry Value Added

        8.1.5. Parent Market Outlook

        8.1.6. Other Macro-Economic Factors

    8.2. Forecast Factors - Relevance & Impact

        8.2.1. Top Companies Historical Growth

        8.2.2. GDP Growth forecast

        8.2.3. Manufacturing Industry forecast

        8.2.4. Global Urbanization Growth Outlook

        8.2.5. Business Climate

        8.2.6. Covid-19 Impact Assessment

        8.2.7. End-use Industry Growth Outlook

    8.3. Value Chain

        8.3.1. Product Manufacturers

        8.3.2. End Users

        8.3.3. Avg. Profitability Margins

    8.4. COVID-19 Crisis – Impact Assessment

        8.4.1. Current Statistics

        8.4.2. Short-Mid-Long Term Outlook

        8.4.3. Likely Rebound

    8.5. Market Dynamics

        8.5.1. Drivers

        8.5.2. Restraints

        8.5.3. Opportunity Analysis

    8.6. Global Supply Demand Analysis

    8.7. Key Regulations & Certifications

    8.8. Production Process Overview

    8.9. Trade Scenario

9. Global Market Analysis 2018 to 2022 and Forecast 2023 to 2033, By Product

    9.1. Introduction / Key Findings

    9.2. Historical Market Size (US$ Million) and Volume Analysis By Product, 2018 to 2022

    9.3. Current and Future Market Size (US$ Million) and Volume Analysis and Forecast By Product, 2023 to 2033

        9.3.1. Tire Inflators

        9.3.2. Tire Pressure Monitoring System

        9.3.3. Tire Repair Kits

        9.3.4. Tire Covers

        9.3.5. Tire Gauge

        9.3.6. Tire Chairs

        9.3.7. Wheel Covers

        9.3.8. Valve Caps

    9.4. Market Attractiveness Analysis By Product

10. Global Market Analysis 2018 to 2022 and Forecast 2023 to 2033, By Vehicle

    10.1. Introduction / Key Findings

    10.2. Historical Market Size (US$ Million) and Volume Analysis By Vehicle, 2018 to 2022

    10.3. Current and Future Market Size (US$ Million) and Volume Analysis and Forecast By Vehicle, 2023 to 2033

        10.3.1. Passenger Vehicles

        10.3.2. Commercial Vehicles

    10.4. Market Attractiveness Analysis By Vehicle

11. Global Market Analysis 2018 to 2022 and Forecast 2023 to 2033, By Distribution Channel

    11.1. Introduction / Key Findings

    11.2. Historical Market Size (US$ Million) and Volume Analysis By Distribution Channel , 2018 to 2022

    11.3. Current and Future Market Size (US$ Million) and Volume Analysis and Forecast By Distribution Channel , 2023 to 2033

        11.3.1. OEM

        11.3.2. Aftermarket

    11.4. Market Attractiveness Analysis By Distribution Channel

12. Global Market Analysis 2018 to 2022 and Forecast 2023 to 2033, by Region

    12.1. Introduction

    12.2. Historical Market Size (US$ Million) and Volume Analysis By Region, 2018 to 2022

    12.3. Current Market Size (US$ Million) and Volume Analysis and Forecast By Region, 2023 to 2033

        12.3.1. North America

        12.3.2. Latin America

        12.3.3. Western Europe

        12.3.4. Eastern Europe

        12.3.5. Central Asia

        12.3.6. Russia & Belarus

        12.3.7. Balkan & Baltic Countries

        12.3.8. Middle East and Africa (MEA)

        12.3.9. East Asia

        12.3.10. South Asia and Pacific

    12.4. Market Attractiveness Analysis By Region

13. North America Market Analysis 2018 to 2022 and Forecast 2023 to 2033

    13.1. Introduction

    13.2. Pricing Analysis

    13.3. Historical Market Size (US$ Million) and Volume Trend Analysis By Market Taxonomy, 2018 to 2022

    13.4. Market Size (US$ Million) and Volume Forecast By Market Taxonomy, 2023 to 2033

        13.4.1. By Country

            13.4.1.1. U.S.

            13.4.1.2. Canada

        13.4.2. By Product

        13.4.3. By Vehicle

        13.4.4. By Distribution Channel

    13.5. Market Attractiveness Analysis

        13.5.1. By Country

        13.5.2. By Product

        13.5.3. By Vehicle

        13.5.4. By Distribution Channel

    13.6. Market Trends

    13.7. Key Market Participants - Intensity Mapping

    13.8. Drivers and Restraints - Impact Analysis

14. Latin America Market Analysis 2018 to 2022 and Forecast 2023 to 2033

    14.1. Introduction

    14.2. Pricing Analysis

    14.3. Historical Market Size (US$ Million) and Volume Trend Analysis By Market Taxonomy, 2018 to 2022

    14.4. Market Size (US$ Million) and Volume Forecast By Market Taxonomy, 2023 to 2033

        14.4.1. By Country

            14.4.1.1. Brazil

            14.4.1.2. Mexico

            14.4.1.3. Argentina

            14.4.1.4. Rest of Latin America

        14.4.2. By Product

        14.4.3. By Vehicle

        14.4.4. By Distribution Channel

    14.5. Market Attractiveness Analysis

        14.5.1. By Country

        14.5.2. By Product

        14.5.3. By Vehicle

        14.5.4. By Distribution Channel

    14.6. Market Trends

    14.7. Key Market Participants - Intensity Mapping

    14.8. Drivers and Restraints - Impact Analysis

15. Western Europe Market Analysis 2018 to 2022 and Forecast 2023 to 2033

    15.1. Introduction

    15.2. Pricing Analysis

    15.3. Historical Market Size (US$ Million) and Volume Trend Analysis By Market Taxonomy, 2018 to 2022

    15.4. Market Size (US$ Million) and Volume Forecast By Market Taxonomy, 2023 to 2033

        15.4.1. By Country

            15.4.1.1. Germany

            15.4.1.2. Italy

            15.4.1.3. France

            15.4.1.4. U.K.

            15.4.1.5. Spain

            15.4.1.6. BENELUX

            15.4.1.7. NORDICS

            15.4.1.8. Rest of Western Europe

        15.4.2. By Product

        15.4.3. By Vehicle

        15.4.4. By Distribution Channel

    15.5. Market Attractiveness Analysis

        15.5.1. By Country

        15.5.2. By Product

        15.5.3. By Vehicle

        15.5.4. By Distribution Channel

    15.6. Market Trends

    15.7. Key Market Participants - Intensity Mapping

    15.8. Drivers and Restraints - Impact Analysis

16. Eastern Europe Market Analysis 2018 to 2022 and Forecast 2023 to 2033

    16.1. Introduction

    16.2. Pricing Analysis

    16.3. Historical Market Size (US$ Million) and Volume Trend Analysis By Market Taxonomy, 2018 to 2022

    16.4. Market Size (US$ Million) and Volume Forecast By Market Taxonomy, 2023 to 2033

        16.4.1. By Country

            16.4.1.1. Poland

            16.4.1.2. Hungary

            16.4.1.3. Romania

            16.4.1.4. Czech Republic

            16.4.1.5. Rest of Eastern Europe

        16.4.2. By Product

        16.4.3. By Vehicle

        16.4.4. By Distribution Channel

    16.5. Market Attractiveness Analysis

        16.5.1. By Country

        16.5.2. By Product

        16.5.3. By Vehicle

        16.5.4. By Distribution Channel

    16.6. Market Trends

    16.7. Key Market Participants - Intensity Mapping

    16.8. Drivers and Restraints - Impact Analysis

17. Central Asia Market Analysis 2018 to 2022 and Forecast 2023 to 2033

    17.1. Introduction

    17.2. Pricing Analysis

    17.3. Historical Market Size (US$ Million) and Volume Trend Analysis By Market Taxonomy, 2018 to 2022

    17.4. Market Size (US$ Million) and Volume Forecast By Market Taxonomy, 2023 to 2033

        17.4.1. By Product

        17.4.2. By Vehicle

        17.4.3. By Distribution Channel

    17.5. Market Attractiveness Analysis

        17.5.1. By Product

        17.5.2. By Vehicle

        17.5.3. By Distribution Channel

    17.6. Market Trends

    17.7. Key Market Participants - Intensity Mapping

    17.8. Drivers and Restraints - Impact Analysis

18. Russia & Belarus Market Analysis 2018 to 2022 and Forecast 2023 to 2033

    18.1. Introduction

    18.2. Pricing Analysis

    18.3. Historical Market Size (US$ Million) and Volume Trend Analysis By Market Taxonomy, 2018 to 2022

    18.4. Market Size (US$ Million) and Volume Forecast By Market Taxonomy, 2023 to 2033

        18.4.1. By Product

        18.4.2. By Vehicle

        18.4.3. By Distribution Channel

    18.5. Market Attractiveness Analysis

        18.5.1. By Product

        18.5.2. By Vehicle

        18.5.3. By Distribution Channel

    18.6. Market Trends

    18.7. Key Market Participants - Intensity Mapping

    18.8. Drivers and Restraints - Impact Analysis

19. Balkan & Baltic Countries Market Analysis 2018 to 2022 and Forecast 2023 to 2033

    19.1. Introduction

    19.2. Pricing Analysis

    19.3. Historical Market Size (US$ Million) and Volume Trend Analysis By Market Taxonomy, 2018 to 2022

    19.4. Market Size (US$ Million) and Volume Forecast By Market Taxonomy, 2023 to 2033

        19.4.1. By Product

        19.4.2. By Vehicle

        19.4.3. By Distribution Channel

    19.5. Market Attractiveness Analysis

        19.5.1. By Product

        19.5.2. By Vehicle

        19.5.3. By Distribution Channel

    19.6. Market Trends

    19.7. Key Market Participants - Intensity Mapping

    19.8. Drivers and Restraints - Impact Analysis

20. South Asia and Pacific Market Analysis 2018 to 2022 and Forecast 2023 to 2033

    20.1. Introduction

    20.2. Pricing Analysis

    20.3. Historical Market Size (US$ Million) and Volume Trend Analysis By Market Taxonomy, 2018 to 2022

    20.4. Market Size (US$ Million) and Volume Forecast By Market Taxonomy, 2023 to 2033

        20.4.1. By Country

            20.4.1.1. India

            20.4.1.2. ASEAN

            20.4.1.3. Oceania

            20.4.1.4. Rest of South Asia & Pacific

        20.4.2. By Product

        20.4.3. By Vehicle

        20.4.4. By Distribution Channel

    20.5. Market Attractiveness Analysis

        20.5.1. By Country

        20.5.2. By Product

        20.5.3. By Vehicle

        20.5.4. By Distribution Channel

    20.6. Market Trends

    20.7. Key Market Participants - Intensity Mapping

    20.8. Drivers and Restraints - Impact Analysis

21. East Asia Market Analysis 2018 to 2022 and Forecast 2023 to 2033

    21.1. Introduction

    21.2. Pricing Analysis

    21.3. Historical Market Size (US$ Million) and Volume Trend Analysis By Market Taxonomy, 2018 to 2022

    21.4. Market Size (US$ Million) and Volume Forecast By Market Taxonomy, 2023 to 2033

        21.4.1. By Country

            21.4.1.1. China

            21.4.1.2. Japan

            21.4.1.3. South Korea

        21.4.2. By Product

        21.4.3. By Vehicle

        21.4.4. By Distribution Channel

    21.5. Market Attractiveness Analysis

        21.5.1. By Country

        21.5.2. By Product

        21.5.3. By Vehicle

        21.5.4. By Distribution Channel

    21.6. Market Trends

    21.7. Key Market Participants - Intensity Mapping

    21.8. Drivers and Restraints - Impact Analysis

22. Middle East and Africa Market Analysis 2018 to 2022 and Forecast 2023 to 2033

    22.1. Introduction

    22.2. Pricing Analysis

    22.3. Historical Market Size (US$ Million) and Volume Trend Analysis By Market Taxonomy, 2018 to 2022

    22.4. Market Size (US$ Million) and Volume Forecast By Market Taxonomy, 2023 to 2033

        22.4.1. By Country

            22.4.1.1. GCC Countries

            22.4.1.2. Türkiye

            22.4.1.3. Northern Africa

            22.4.1.4. South Africa

            22.4.1.5. Rest of Middle East and Africa

        22.4.2. By Product

        22.4.3. By Vehicle

        22.4.4. By Distribution Channel

    22.5. Market Attractiveness Analysis

        22.5.1. By Country

        22.5.2. By Product

        22.5.3. By Vehicle

        22.5.4. By Distribution Channel

    22.6. Market Trends

    22.7. Key Market Participants - Intensity Mapping

    22.8. Drivers and Restraints - Impact Analysis

23. Country-wise Market Analysis

    23.1. Introduction

        23.1.1. Market Value Proportion Analysis, By Key Countries

        23.1.2. Global Vs. Country Growth Comparison

    23.2. U.S. Market Analysis

        23.2.1. By Product

        23.2.2. By Vehicle

        23.2.3. By Distribution Channel

    23.3. Canada Market Analysis

        23.3.1. By Product

        23.3.2. By Vehicle

        23.3.3. By Distribution Channel

    23.4. Mexico Market Analysis

        23.4.1. By Product

        23.4.2. By Vehicle

        23.4.3. By Distribution Channel

    23.5. Brazil Market Analysis

        23.5.1. By Product

        23.5.2. By Vehicle

        23.5.3. By Distribution Channel

    23.6. Argentina Market Analysis

        23.6.1. By Product

        23.6.2. By Vehicle

        23.6.3. By Distribution Channel

    23.7. Germany Market Analysis

        23.7.1. By Product

        23.7.2. By Vehicle

        23.7.3. By Distribution Channel

    23.8. Italy Market Analysis

        23.8.1. By Product

        23.8.2. By Vehicle

        23.8.3. By Distribution Channel

    23.9. France Market Analysis

        23.9.1. By Product

        23.9.2. By Vehicle

        23.9.3. By Distribution Channel

    23.10. U.K. Market Analysis

        23.10.1. By Product

        23.10.2. By Vehicle

        23.10.3. By Distribution Channel

    23.11. Spain Market Analysis

        23.11.1. By Product

        23.11.2. By Vehicle

        23.11.3. By Distribution Channel

    23.12. NORDICS Market Analysis

        23.12.1. By Product

        23.12.2. By Vehicle

        23.12.3. By Distribution Channel

    23.13. Poland Market Analysis

        23.13.1. By Product

        23.13.2. By Vehicle

        23.13.3. By Distribution Channel

    23.14. Hungary Market Analysis

        23.14.1. By Product

        23.14.2. By Vehicle

        23.14.3. By Distribution Channel

    23.15. Romania Market Analysis

        23.15.1. By Product

        23.15.2. By Vehicle

        23.15.3. By Distribution Channel

    23.16. Czech Republic Market Analysis

        23.16.1. By Product

        23.16.2. By Vehicle

        23.16.3. By Distribution Channel

    23.17. China Market Analysis

        23.17.1. By Product

        23.17.2. By Vehicle

        23.17.3. By Distribution Channel

    23.18. Japan Market Analysis

        23.18.1. By Product

        23.18.2. By Vehicle

        23.18.3. By Distribution Channel

    23.19. S. Korea Market Analysis

        23.19.1. By Product

        23.19.2. By Vehicle

        23.19.3. By Distribution Channel

    23.20. India Market Analysis

        23.20.1. By Product

        23.20.2. By Vehicle

        23.20.3. By Distribution Channel

    23.21. ASEAN Market Analysis

        23.21.1. By Product

        23.21.2. By Vehicle

        23.21.3. By Distribution Channel

    23.22. Australia and New Zealand Market Analysis

        23.22.1. By Product

        23.22.2. By Vehicle

        23.22.3. By Distribution Channel

    23.23. KSA Market Analysis

        23.23.1. By Product

        23.23.2. By Vehicle

        23.23.3. By Distribution Channel

    23.24. UAE Market Analysis

        23.24.1. By Product

        23.24.2. By Vehicle

        23.24.3. By Distribution Channel

    23.25. Northern Africa Market Analysis

        23.25.1. By Product

        23.25.2. By Vehicle

        23.25.3. By Distribution Channel

    23.26. Türkiye Market Analysis

        23.26.1. By Product

        23.26.2. By Vehicle

        23.26.3. By Distribution Channel

    23.27. South Africa Market Analysis

        23.27.1. By Product

        23.27.2. By Vehicle

        23.27.3. By Distribution Channel

    23.28. Israel Market Analysis

        23.28.1. By Product

        23.28.2. By Vehicle

        23.28.3. By Distribution Channel

24. Market Structure Analysis

    24.1. Market Analysis by Tier of Companies ()

    24.2. Market Concentration

    24.3. Market Share Analysis of Top Players

    24.4. Production Capacity Analysis

    24.5. Market Presence Analysis

        24.5.1. By Distribution Channel Footprint of Players

        24.5.2. By Regional Footprint of Players

        24.5.3. By Channel Footprint of Players

25. Competition Analysis

    25.1. Competition Dashboard

    25.2. Competition Benchmarking

    25.3. Competition Deep Dive

        25.3.1. Michelin

            25.3.1.1. Overview

            25.3.1.2. Product Portfolio

            25.3.1.3. Profitability by Market Segments (Product/Channel/Region)

            25.3.1.4. Sales Footprint

            25.3.1.5. Strategy Overview

        25.3.2. Bridgestone

            25.3.2.1. Overview

            25.3.2.2. Product Portfolio

            25.3.2.3. Profitability by Market Segments (Product/Channel/Region)

            25.3.2.4. Sales Footprint

            25.3.2.5. Strategy Overview

        25.3.3. Goodyear

            25.3.3.1. Overview

            25.3.3.2. Product Portfolio

            25.3.3.3. Profitability by Market Segments (Product/Channel/Region)

            25.3.3.4. Sales Footprint

            25.3.3.5. Strategy Overview

        25.3.4. Continental

            25.3.4.1. Overview

            25.3.4.2. Product Portfolio

            25.3.4.3. Profitability by Market Segments (Product/Channel/Region)

            25.3.4.4. Sales Footprint

            25.3.4.5. Strategy Overview

        25.3.5. Pirelli

            25.3.5.1. Overview

            25.3.5.2. Product Portfolio

            25.3.5.3. Profitability by Market Segments (Product/Channel/Region)

            25.3.5.4. Sales Footprint

            25.3.5.5. Strategy Overview

        25.3.6. Slime

            25.3.6.1. Overview

            25.3.6.2. Product Portfolio

            25.3.6.3. Profitability by Market Segments (Product/Channel/Region)

            25.3.6.4. Sales Footprint

            25.3.6.5. Strategy Overview

        25.3.7. Black Jack Tire Repair

            25.3.7.1. Overview

            25.3.7.2. Product Portfolio

            25.3.7.3. Profitability by Market Segments (Product/Channel/Region)

            25.3.7.4. Sales Footprint

            25.3.7.5. Strategy Overview

        25.3.8. Gorilla Automotive

            25.3.8.1. Overview

            25.3.8.2. Product Portfolio

            25.3.8.3. Profitability by Market Segments (Product/Channel/Region)

            25.3.8.4. Sales Footprint

            25.3.8.5. Strategy Overview

        25.3.9. Viair Corporation

            25.3.9.1. Overview

            25.3.9.2. Product Portfolio

            25.3.9.3. Profitability by Market Segments (Product/Channel/Region)

            25.3.9.4. Sales Footprint

            25.3.9.5. Strategy Overview

        25.3.10. Stop & Go International

            25.3.10.1. Overview

            25.3.10.2. Product Portfolio

            25.3.10.3. Profitability by Market Segments (Product/Channel/Region)

            25.3.10.4. Sales Footprint

            25.3.10.5. Strategy Overview

26. Primary Insights

27. Assumptions and Acronyms Used

28. Research Methodology

List of Tables

Table 1: Global Value (US$ Million) Forecast by Region, 2018 & 2033

Table 2: Global Volume (Units) Forecast by Region, 2018 & 2033

Table 3: Global Value (US$ Million) Forecast by Product , 2018 & 2033

Table 4: Global Volume (Units) Forecast by Product , 2018 & 2033

Table 5: Global Value (US$ Million) Forecast by Vehicles, 2018 & 2033

Table 6: Global Volume (Units) Forecast by Vehicles, 2018 & 2033

Table 7: Global Value (US$ Million) Forecast by Distribution Channel, 2018 & 2033

Table 8: Global Volume (Units) Forecast by Distribution Channel, 2018 & 2033

Table 9: North America Value (US$ Million) Forecast by Country, 2018 & 2033

Table 10: North America Volume (Units) Forecast by Country, 2018 & 2033

Table 11: North America Value (US$ Million) Forecast by Product , 2018 & 2033

Table 12: North America Volume (Units) Forecast by Product , 2018 & 2033

Table 13: North America Value (US$ Million) Forecast by Vehicles, 2018 & 2033

Table 14: North America Volume (Units) Forecast by Vehicles, 2018 & 2033

Table 15: North America Value (US$ Million) Forecast by Distribution Channel, 2018 & 2033

Table 16: North America Volume (Units) Forecast by Distribution Channel, 2018 & 2033

Table 17: Latin America Value (US$ Million) Forecast by Country, 2018 & 2033

Table 18: Latin America Volume (Units) Forecast by Country, 2018 & 2033

Table 19: Latin America Value (US$ Million) Forecast by Product , 2018 & 2033

Table 20: Latin America Volume (Units) Forecast by Product , 2018 & 2033

Table 21: Latin America Value (US$ Million) Forecast by Vehicles, 2018 & 2033

Table 22: Latin America Volume (Units) Forecast by Vehicles, 2018 & 2033

Table 23: Latin America Value (US$ Million) Forecast by Distribution Channel, 2018 & 2033

Table 24: Latin America Volume (Units) Forecast by Distribution Channel, 2018 & 2033

Table 25: Western Europe Value (US$ Million) Forecast by Country, 2018 & 2033

Table 26: Western Europe Volume (Units) Forecast by Country, 2018 & 2033

Table 27: Western Europe Value (US$ Million) Forecast by Product , 2018 & 2033

Table 28: Western Europe Volume (Units) Forecast by Product , 2018 & 2033

Table 29: Western Europe Value (US$ Million) Forecast by Vehicles, 2018 & 2033

Table 30: Western Europe Volume (Units) Forecast by Vehicles, 2018 & 2033

Table 31: Western Europe Value (US$ Million) Forecast by Distribution Channel, 2018 & 2033

Table 32: Western Europe Volume (Units) Forecast by Distribution Channel, 2018 & 2033

Table 33: Eastern Europe Value (US$ Million) Forecast by Country, 2018 & 2033

Table 34: Eastern Europe Volume (Units) Forecast by Country, 2018 & 2033

Table 35: Eastern Europe Value (US$ Million) Forecast by Product , 2018 & 2033

Table 36: Eastern Europe Volume (Units) Forecast by Product , 2018 & 2033

Table 37: Eastern Europe Value (US$ Million) Forecast by Vehicles, 2018 & 2033

Table 38: Eastern Europe Volume (Units) Forecast by Vehicles, 2018 & 2033

Table 39: Eastern Europe Value (US$ Million) Forecast by Distribution Channel, 2018 & 2033

Table 40: Eastern Europe Volume (Units) Forecast by Distribution Channel, 2018 & 2033

Table 41: East Asia Value (US$ Million) Forecast by Country, 2018 & 2033

Table 42: East Asia Volume (Units) Forecast by Country, 2018 & 2033

Table 43: East Asia Value (US$ Million) Forecast by Product , 2018 & 2033

Table 44: East Asia Volume (Units) Forecast by Product , 2018 & 2033

Table 45: East Asia Value (US$ Million) Forecast by Vehicles, 2018 & 2033

Table 46: East Asia Volume (Units) Forecast by Vehicles, 2018 & 2033

Table 47: East Asia Value (US$ Million) Forecast by Distribution Channel, 2018 & 2033

Table 48: East Asia Volume (Units) Forecast by Distribution Channel, 2018 & 2033

Table 49: South Asia Value (US$ Million) Forecast by Country, 2018 & 2033

Table 50: South Asia Volume (Units) Forecast by Country, 2018 & 2033

Table 51: South Asia Value (US$ Million) Forecast by Product , 2018 & 2033

Table 52: South Asia Volume (Units) Forecast by Product , 2018 & 2033

Table 53: South Asia Value (US$ Million) Forecast by Vehicles, 2018 & 2033

Table 54: South Asia Volume (Units) Forecast by Vehicles, 2018 & 2033

Table 55: South Asia Value (US$ Million) Forecast by Distribution Channel, 2018 & 2033

Table 56: South Asia Volume (Units) Forecast by Distribution Channel, 2018 & 2033

Table 57: MEA Value (US$ Million) Forecast by Country, 2018 & 2033

Table 58: MEA Volume (Units) Forecast by Country, 2018 & 2033

Table 59: MEA Value (US$ Million) Forecast by Product , 2018 & 2033

Table 60: MEA Volume (Units) Forecast by Product , 2018 & 2033

Table 61: MEA Value (US$ Million) Forecast by Vehicles, 2018 & 2033

Table 62: MEA Volume (Units) Forecast by Vehicles, 2018 & 2033

Table 63: MEA Value (US$ Million) Forecast by Distribution Channel, 2018 & 2033

Table 64: MEA Volume (Units) Forecast by Distribution Channel, 2018 & 2033

List of Charts

Figure 1: Global Value (US$ Million) by Product , 2023 & 2033

Figure 2: Global Value (US$ Million) by Vehicles, 2023 & 2033

Figure 3: Global Value (US$ Million) by Distribution Channel, 2023 & 2033

Figure 4: Global Value (US$ Million) by Region, 2023 & 2033

Figure 5: Global Value (US$ Million) Analysis by Region, 2018 & 2033

Figure 6: Global Volume (Units) Analysis by Region, 2018 & 2033

Figure 7: Global Value Share (%) and BPS Analysis by Region, 2023 & 2033

Figure 8: Global Y-o-Y Growth (%) Projections by Region, 2022 to 2032

Figure 9: Global Value (US$ Million) Analysis by Product , 2018 & 2033

Figure 10: Global Volume (Units) Analysis by Product , 2018 & 2033

Figure 11: Global Value Share (%) and BPS Analysis by Product , 2023 & 2033

Figure 12: Global Y-o-Y Growth (%) Projections by Product , 2022 to 2032

Figure 13: Global Value (US$ Million) Analysis by Vehicles, 2018 & 2033

Figure 14: Global Volume (Units) Analysis by Vehicles, 2018 & 2033

Figure 15: Global Value Share (%) and BPS Analysis by Vehicles, 2023 & 2033

Figure 16: Global Y-o-Y Growth (%) Projections by Vehicles, 2022 to 2032

Figure 17: Global Value (US$ Million) Analysis by Distribution Channel, 2018 & 2033

Figure 18: Global Volume (Units) Analysis by Distribution Channel, 2018 & 2033

Figure 19: Global Value Share (%) and BPS Analysis by Distribution Channel, 2023 & 2033

Figure 20: Global Y-o-Y Growth (%) Projections by Distribution Channel, 2022 to 2032

Figure 21: Global Attractiveness by Product , 2022 to 2032

Figure 22: Global Attractiveness by Vehicles, 2022 to 2032

Figure 23: Global Attractiveness by Distribution Channel, 2022 to 2032

Figure 24: Global Attractiveness by Region, 2022 to 2032

Figure 25: North America Value (US$ Million) by Product , 2023 & 2033

Figure 26: North America Value (US$ Million) by Vehicles, 2023 & 2033

Figure 27: North America Value (US$ Million) by Distribution Channel, 2023 & 2033

Figure 28: North America Value (US$ Million) by Country, 2023 & 2033

Figure 29: North America Value (US$ Million) Analysis by Country, 2018 & 2033

Figure 30: North America Volume (Units) Analysis by Country, 2018 & 2033

Figure 31: North America Value Share (%) and BPS Analysis by Country, 2023 & 2033

Figure 32: North America Y-o-Y Growth (%) Projections by Country, 2022 to 2032

Figure 33: North America Value (US$ Million) Analysis by Product , 2018 & 2033

Figure 34: North America Volume (Units) Analysis by Product , 2018 & 2033

Figure 35: North America Value Share (%) and BPS Analysis by Product , 2023 & 2033

Figure 36: North America Y-o-Y Growth (%) Projections by Product , 2022 to 2032

Figure 37: North America Value (US$ Million) Analysis by Vehicles, 2018 & 2033

Figure 38: North America Volume (Units) Analysis by Vehicles, 2018 & 2033

Figure 39: North America Value Share (%) and BPS Analysis by Vehicles, 2023 & 2033

Figure 40: North America Y-o-Y Growth (%) Projections by Vehicles, 2022 to 2032

Figure 41: North America Value (US$ Million) Analysis by Distribution Channel, 2018 & 2033

Figure 42: North America Volume (Units) Analysis by Distribution Channel, 2018 & 2033

Figure 43: North America Value Share (%) and BPS Analysis by Distribution Channel, 2023 & 2033

Figure 44: North America Y-o-Y Growth (%) Projections by Distribution Channel, 2022 to 2032

Figure 45: North America Attractiveness by Product , 2022 to 2032

Figure 46: North America Attractiveness by Vehicles, 2022 to 2032

Figure 47: North America Attractiveness by Distribution Channel, 2022 to 2032

Figure 48: North America Attractiveness by Country, 2022 to 2032

Figure 49: Latin America Value (US$ Million) by Product , 2023 & 2033

Figure 50: Latin America Value (US$ Million) by Vehicles, 2023 & 2033

Figure 51: Latin America Value (US$ Million) by Distribution Channel, 2023 & 2033

Figure 52: Latin America Value (US$ Million) by Country, 2023 & 2033

Figure 53: Latin America Value (US$ Million) Analysis by Country, 2018 & 2033

Figure 54: Latin America Volume (Units) Analysis by Country, 2018 & 2033

Figure 55: Latin America Value Share (%) and BPS Analysis by Country, 2023 & 2033

Figure 56: Latin America Y-o-Y Growth (%) Projections by Country, 2022 to 2032

Figure 57: Latin America Value (US$ Million) Analysis by Product , 2018 & 2033

Figure 58: Latin America Volume (Units) Analysis by Product , 2018 & 2033

Figure 59: Latin America Value Share (%) and BPS Analysis by Product , 2023 & 2033

Figure 60: Latin America Y-o-Y Growth (%) Projections by Product , 2022 to 2032

Figure 61: Latin America Value (US$ Million) Analysis by Vehicles, 2018 & 2033

Figure 62: Latin America Volume (Units) Analysis by Vehicles, 2018 & 2033

Figure 63: Latin America Value Share (%) and BPS Analysis by Vehicles, 2023 & 2033

Figure 64: Latin America Y-o-Y Growth (%) Projections by Vehicles, 2022 to 2032

Figure 65: Latin America Value (US$ Million) Analysis by Distribution Channel, 2018 & 2033

Figure 66: Latin America Volume (Units) Analysis by Distribution Channel, 2018 & 2033

Figure 67: Latin America Value Share (%) and BPS Analysis by Distribution Channel, 2023 & 2033

Figure 68: Latin America Y-o-Y Growth (%) Projections by Distribution Channel, 2022 to 2032

Figure 69: Latin America Attractiveness by Product , 2022 to 2032

Figure 70: Latin America Attractiveness by Vehicles, 2022 to 2032

Figure 71: Latin America Attractiveness by Distribution Channel, 2022 to 2032

Figure 72: Latin America Attractiveness by Country, 2022 to 2032

Figure 73: Western Europe Value (US$ Million) by Product , 2023 & 2033

Figure 74: Western Europe Value (US$ Million) by Vehicles, 2023 & 2033

Figure 75: Western Europe Value (US$ Million) by Distrubution Channel, 2023 & 2033

Figure 76: Western Europe Value (US$ Million) by Country, 2023 & 2033

Figure 77: Western Europe Value (US$ Million) Analysis by Country, 2018 & 2033

Figure 78: Western Europe Volume (Units) Analysis by Country, 2018 & 2033

Figure 79: Western Europe Value Share (%) and BPS Analysis by Country, 2023 & 2033

Figure 80: Western Europe Y-o-Y Growth (%) Projections by Country, 2022 to 2032

Figure 81: Western Europe Value (US$ Million) Analysis by Product , 2018 & 2033

Figure 82: Western Europe Volume (Units) Analysis by Product , 2018 & 2033

Figure 83: Western Europe Value Share (%) and BPS Analysis by Product , 2023 & 2033

Figure 84: Western Europe Y-o-Y Growth (%) Projections by Product , 2022 to 2032

Figure 85: Western Europe Value (US$ Million) Analysis by Vehicles, 2018 & 2033

Figure 86: Western Europe Volume (Units) Analysis by Vehicles, 2018 & 2033

Figure 87: Western Europe Value Share (%) and BPS Analysis by Vehicles, 2023 & 2033

Figure 88: Western Europe Y-o-Y Growth (%) Projections by Vehicles, 2022 to 2032

Figure 89: Western Europe Value (US$ Million) Analysis by Distrubution Channel, 2018 & 2033

Figure 90: Western Europe Volume (Units) Analysis by Distrubution Channel, 2018 & 2033

Figure 91: Western Europe Value Share (%) and BPS Analysis by Distrubution Channel, 2023 & 2033

Figure 92: Western Europe Y-o-Y Growth (%) Projections by Distribution Channel, 2022 to 2032

Figure 93: Western Europe Attractiveness by Product , 2022 to 2032

Figure 94: Western Europe Attractiveness by Vehicles, 2022 to 2032

Figure 95: Western Europe Attractiveness by Distribution Channel, 2022 to 2032

Figure 96: Western Europe Attractiveness by Country, 2022 to 2032

Figure 97: Eastern Europe Value (US$ Million) by Product , 2023 & 2033

Figure 98: Eastern Europe Value (US$ Million) by Vehicles, 2023 & 2033

Figure 99: Eastern Europe Value (US$ Million) by Distribution Channel, 2023 & 2033

Figure 100: Eastern Europe Value (US$ Million) by Country, 2023 & 2033

Figure 101: Eastern Europe Value (US$ Million) Analysis by Country, 2018 & 2033

Figure 102: Eastern Europe Volume (Units) Analysis by Country, 2018 & 2033

Figure 103: Eastern Europe Value Share (%) and BPS Analysis by Country, 2023 & 2033

Figure 104: Eastern Europe Y-o-Y Growth (%) Projections by Country, 2022 to 2032

Figure 105: Eastern Europe Value (US$ Million) Analysis by Product , 2018 & 2033

Figure 106: Eastern Europe Volume (Units) Analysis by Product , 2018 & 2033

Figure 107: Eastern Europe Value Share (%) and BPS Analysis by Product , 2023 & 2033

Figure 108: Eastern Europe Y-o-Y Growth (%) Projections by Product , 2022 to 2032

Figure 109: Eastern Europe Value (US$ Million) Analysis by Vehicles, 2018 & 2033

Figure 110: Eastern Europe Volume (Units) Analysis by Vehicles, 2018 & 2033

Figure 111: Eastern Europe Value Share (%) and BPS Analysis by Vehicles, 2023 & 2033

Figure 112: Eastern Europe Y-o-Y Growth (%) Projections by Vehicles, 2022 to 2032

Figure 113: Eastern Europe Value (US$ Million) Analysis by Distribution Channel, 2018 & 2033

Figure 114: Eastern Europe Volume (Units) Analysis by Distribution Channel, 2018 & 2033

Figure 115: Eastern Europe Value Share (%) and BPS Analysis by Distribution Channel, 2023 & 2033

Figure 116: Eastern Europe Y-o-Y Growth (%) Projections by Distribution Channel, 2022 to 2032

Figure 117: Eastern Europe Attractiveness by Product , 2022 to 2032

Figure 118: Eastern Europe Attractiveness by Vehicles, 2022 to 2032

Figure 119: Eastern Europe Attractiveness by Distribution Channel, 2022 to 2032

Figure 120: Eastern Europe Attractiveness by Country, 2022 to 2032

Figure 121: East Asia Value (US$ Million) by Product , 2023 & 2033

Figure 122: East Asia Value (US$ Million) by Vehicles, 2023 & 2033

Figure 123: East Asia Value (US$ Million) by Distribution Channel, 2023 & 2033

Figure 124: East Asia Value (US$ Million) by Country, 2023 & 2033

Figure 125: East Asia Value (US$ Million) Analysis by Country, 2018 & 2033

Figure 126: East Asia Volume (Units) Analysis by Country, 2018 & 2033

Figure 127: East Asia Value Share (%) and BPS Analysis by Country, 2023 & 2033

Figure 128: East Asia Y-o-Y Growth (%) Projections by Country, 2022 to 2032

Figure 129: East Asia Value (US$ Million) Analysis by Product , 2018 & 2033

Figure 130: East Asia Volume (Units) Analysis by Product , 2018 & 2033

Figure 131: East Asia Value Share (%) and BPS Analysis by Product , 2023 & 2033

Figure 132: East Asia Y-o-Y Growth (%) Projections by Product , 2022 to 2032

Figure 133: East Asia Value (US$ Million) Analysis by Vehicles, 2018 & 2033

Figure 134: East Asia Volume (Units) Analysis by Vehicles, 2018 & 2033

Figure 135: East Asia Value Share (%) and BPS Analysis by Vehicles, 2023 & 2033

Figure 136: East Asia Y-o-Y Growth (%) Projections by Vehicles, 2022 to 2032

Figure 137: East Asia Value (US$ Million) Analysis by Distribution Channel, 2018 & 2033

Figure 138: East Asia Volume (Units) Analysis by Distribution Channel, 2018 & 2033

Figure 139: East Asia Value Share (%) and BPS Analysis by Distribution Channel, 2023 & 2033

Figure 140: East Asia Y-o-Y Growth (%) Projections by Distribution Channel, 2022 to 2032

Figure 141: East Asia Attractiveness by Product , 2022 to 2032

Figure 142: East Asia Attractiveness by Vehicles, 2022 to 2032

Figure 143: East Asia Attractiveness by Distribution Channel, 2022 to 2032

Figure 144: East Asia Attractiveness by Country, 2022 to 2032

Figure 145: South Asia Value (US$ Million) by Product , 2023 & 2033

Figure 146: South Asia Value (US$ Million) by Vehicles, 2023 & 2033

Figure 147: South Asia Value (US$ Million) by Distribution Channel, 2023 & 2033

Figure 148: South Asia Value (US$ Million) by Country, 2023 & 2033

Figure 149: South Asia Value (US$ Million) Analysis by Country, 2018 & 2033

Figure 150: South Asia Volume (Units) Analysis by Country, 2018 & 2033

Figure 151: South Asia Value Share (%) and BPS Analysis by Country, 2023 & 2033

Figure 152: South Asia Y-o-Y Growth (%) Projections by Country, 2022 to 2032

Figure 153: South Asia Value (US$ Million) Analysis by Product , 2018 & 2033

Figure 154: South Asia Volume (Units) Analysis by Product , 2018 & 2033

Figure 155: South Asia Value Share (%) and BPS Analysis by Product , 2023 & 2033

Figure 156: South Asia Y-o-Y Growth (%) Projections by Product , 2022 to 2032

Figure 157: South Asia Value (US$ Million) Analysis by Vehicles, 2018 & 2033

Figure 158: South Asia Volume (Units) Analysis by Vehicles, 2018 & 2033

Figure 159: South Asia Value Share (%) and BPS Analysis by Vehicles, 2023 & 2033

Figure 160: South Asia Y-o-Y Growth (%) Projections by Vehicles, 2022 to 2032

Figure 161: South Asia Value (US$ Million) Analysis by Distribution Channel, 2018 & 2033

Figure 162: South Asia Volume (Units) Analysis by Distribution Channel, 2018 & 2033

Figure 163: South Asia Value Share (%) and BPS Analysis by Distribution Channel, 2023 & 2033

Figure 164: South Asia Y-o-Y Growth (%) Projections by Distribution Channel, 2022 to 2032

Figure 165: South Asia Attractiveness by Product , 2022 to 2032

Figure 166: South Asia Attractiveness by Vehicles, 2022 to 2032

Figure 167: South Asia Attractiveness by Distribution Channel, 2022 to 2032

Figure 168: South Asia Attractiveness by Country, 2022 to 2032

Figure 169: MEA Value (US$ Million) by Product , 2023 & 2033

Figure 170: MEA Value (US$ Million) by Vehicles, 2023 & 2033

Figure 171: MEA Value (US$ Million) by Distribution Channel, 2023 & 2033

Figure 172: MEA Value (US$ Million) by Country, 2023 & 2033

Figure 173: MEA Value (US$ Million) Analysis by Country, 2018 & 2033

Figure 174: MEA Volume (Units) Analysis by Country, 2018 & 2033

Figure 175: MEA Value Share (%) and BPS Analysis by Country, 2023 & 2033

Figure 176: MEA Y-o-Y Growth (%) Projections by Country, 2022 to 2032

Figure 177: MEA Value (US$ Million) Analysis by Product , 2018 & 2033

Figure 178: MEA Volume (Units) Analysis by Product , 2018 & 2033

Figure 179: MEA Value Share (%) and BPS Analysis by Product , 2023 & 2033

Figure 180: MEA Y-o-Y Growth (%) Projections by Product , 2022 to 2032

Figure 181: MEA Value (US$ Million) Analysis by Vehicles, 2018 & 2033

Figure 182: MEA Volume (Units) Analysis by Vehicles, 2018 & 2033

Figure 183: MEA Value Share (%) and BPS Analysis by Vehicles, 2023 & 2033

Figure 184: MEA Y-o-Y Growth (%) Projections by Vehicles, 2022 to 2032

Figure 185: MEA Value (US$ Million) Analysis by Distribution Channel, 2018 & 2033

Figure 186: MEA Volume (Units) Analysis by Distribution Channel, 2018 & 2033

Figure 187: MEA Value Share (%) and BPS Analysis by Distribution Channel, 2023 & 2033

Figure 188: MEA Y-o-Y Growth (%) Projections by Distribution Channel, 2022 to 2032

Figure 189: MEA Attractiveness by Product , 2022 to 2032

Figure 190: MEA Attractiveness by Vehicles, 2022 to 2032

Figure 191: MEA Attractiveness by Distribution Channel, 2022 to 2032

Figure 192: MEA Attractiveness by Country, 2022 to 2032

Explore Automotive Insights

View Reports

Automotive Tire Accessories Market