The low rolling resistance tire market is anticipated to expand from USD 22.9 billion in 2025 to USD 69.2 billion in 2035, reflecting a CAGR of 11.7%. The acceleration and deceleration pattern of this market is characterized by rapid early growth driven by strong demand for fuel-efficient vehicles and rising focus on emission reduction. Between 2025 and 2030, the market is expected to experience a sharp acceleration as automotive manufacturers integrate advanced tire technologies to enhance vehicle performance and comply with energy efficiency regulations. This period will also see increased adoption across passenger cars, electric vehicles, and commercial fleets, boosting production and sales momentum.
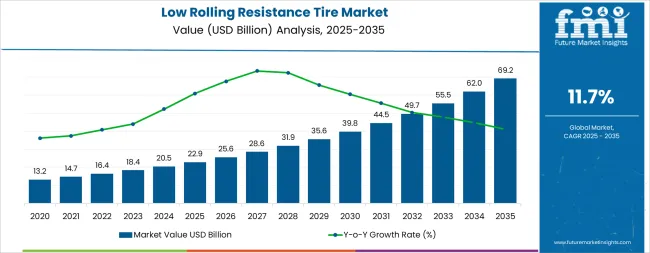
From 2030 to 2035, the market may experience a mild deceleration phase as the adoption rate stabilizes in developed regions and replacement demand becomes the dominant revenue source. The continued expansion in emerging economies and advancements in material composition, such as silica-based compounds and smart tire systems, will sustain positive growth. The curve exhibits a strong acceleration in the first half, followed by gradual stabilization, resulting in a smooth growth transition rather than a peak-and-drop pattern.
| Metric | Value |
|---|---|
| Market Value (2025) | USD 22.9 billion |
| Market Forecast Value (2035) | USD 69.2 billion |
| Forecast CAGR (2025–2035) | 11.7% |
LRR tires are split mainly between OEM (Original Equipment Manufacturer) and aftermarket channels. In 2024, the OEM segment claimed about 60-61% of global revenue for LRR tires. This large share comes from automakers fitting LRR tires as standard on new vehicles, especially hybrids and EVs, to meet fuel efficiency and emissions rules. The aftermarket holds the remaining 39-40%, driven by vehicle owners replacing tires and seeking efficiency gains through upgrades.
Innovation in tire compounds is accelerating: silica-rich blends, bio-polymers, and advanced polymers are helping reduce energy loss without compromising grip. Tire geometry is being optimized using simulation tools to minimize deformation and heat build-up. Regulatory pressure is tightening globally, pushing automakers to include LRR tires as standard, especially in Europe, North America, and Asia. EVs are major growth drivers because every incremental drop in rolling resistance improves range. Smart tires with sensors and connected features are beginning to appear, and markets sensitive to fuel cost or environmental policy are adopting LRR more rapidly.
The low rolling resistance tire market grows by enabling vehicle owners, fleet operators, and automotive manufacturers to optimize fuel efficiency and reduce carbon emissions while accessing advanced tire technologies that ensure reliable performance across diverse driving conditions. Automotive consumers and commercial fleet operators face mounting pressure to comply with emissions regulations and minimize operational costs, with low rolling resistance tires typically providing 10-15% fuel savings and 3-5% extended vehicle range for electric vehicles compared to conventional alternatives, making advanced tire technologies essential for sustainable mobility positioning. The automotive industry's need for reduced energy consumption and application-specific performance creates demand for comprehensive tire solutions that can provide superior fuel economy, maintain consistent safety standards, and ensure optimal operation without compromising vehicle handling or environmental compliance.
Government initiatives promoting emissions reduction and fuel efficiency standards drive adoption in passenger vehicles, commercial fleets, and electric vehicle applications, where tire rolling resistance has a direct impact on energy consumption and operational costs. The increasing prevalence of electric vehicles in modern automotive markets necessitates ultra-low rolling resistance technologies that maximize battery range and reduce charging frequency requirements. The higher upfront costs for premium tire technologies and limited consumer awareness in developing regions may limit market penetration among price-sensitive segments and areas with insufficient environmental regulation enforcement.
The market is segmented by vehicle type, sales channel, tire construction, and region. By vehicle type, the market is divided into passenger vehicle tires, commercial vehicle tires, and others. Based on the sales channel, the market is categorized into aftermarket and original equipment manufacturer (OEM). By tire construction, the market encompasses radial construction and bias construction. Regionally, the market is divided into Asia Pacific, Europe, North America, Latin America, and Middle East & Africa.
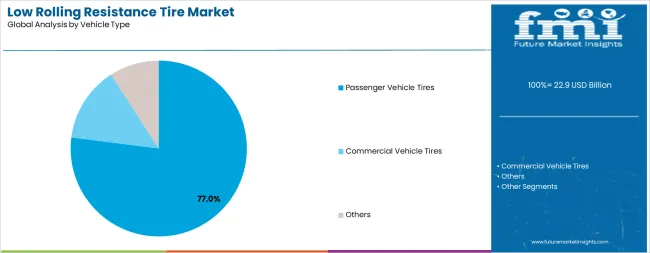
The passenger vehicle tire segment represents the dominant force in the low rolling resistance tire market, capturing approximately 77.0% of total market share in 2025. This established vehicle category encompasses tires featuring sophisticated silica-enhanced compounds and optimized tread designs, including advanced polymer technologies and aerodynamic sidewall profiles that enable superior fuel efficiency and enhanced safety performance across all driving conditions. The passenger vehicle tire segment's market leadership stems from its massive addressable market, with tires serving the largest automotive segment while benefiting from stringent fuel economy regulations and growing consumer environmental awareness across all geographic regions.
The commercial vehicle tire segment maintains a substantial 15.0% market share, serving customers who require heavy-duty low rolling resistance tires with reinforced construction and extended durability for long-haul transportation and logistics applications. These tires offer significant fuel savings for fleet operations while providing sufficient load-carrying capacity to meet commercial transportation requirements and total cost of ownership optimization. The others segment, including two-wheeler tires, off-road vehicle tires, and specialty applications, accounts for approximately 8.0% of the market, serving niche applications requiring specific performance characteristics or specialized rolling resistance parameters.
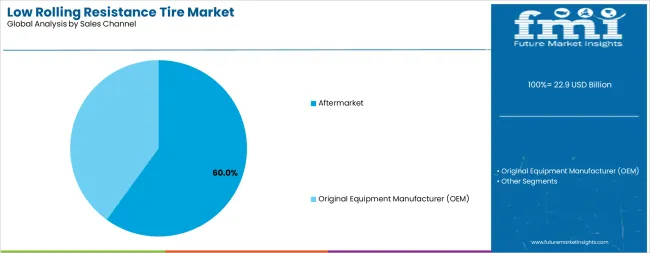
Aftermarket sales channel dominates the low rolling resistance tire market with approximately 60.0% market share in 2025, reflecting the critical role of replacement tire demand in supporting global tire consumption and expanding consumer adoption of fuel-efficient technologies. The aftermarket segment's market leadership is reinforced by consistent replacement cycles driven by tire wear, growing consumer awareness of fuel-saving benefits, and rising environmental consciousness expanding market penetration of low rolling resistance technologies across developed and emerging markets.
The OEM sales channel represents the secondary distribution category, capturing 40.0% market share through direct supply relationships with automotive manufacturers for new vehicle production across passenger car, commercial vehicle, and electric vehicle applications. This segment benefits from mandatory fuel economy regulations requiring vehicle manufacturers to install low rolling resistance tires as original equipment, meeting specific corporate average fuel economy (CAFE) standards and emissions compliance requirements in competitive automotive markets.
The market is driven by three concrete demand factors tied to environmental and economic outcomes. First, stringent government fuel efficiency regulations and emissions standards create increasing demand for low rolling resistance tire technologies, with regulatory requirements tightening by 15-20% in major automotive markets worldwide, requiring comprehensive tire performance upgrades. Second, rising fuel costs and operational expense pressures drive fleet operator adoption of fuel-efficient tire solutions, with commercial vehicle operators achieving 5-8% fuel cost reductions through low rolling resistance tire implementation by 2030. Third, technological advancements in silica compounds and nanomaterial formulations enable more effective and cost-competitive fuel-saving solutions that maintain safety performance while improving environmental benefits and total cost of ownership.
Market restraints include higher manufacturing costs for advanced tire compounds that can deter price-sensitive consumers from purchasing premium low rolling resistance technologies, particularly in developing regions where budget tire alternatives remain attractive despite inferior fuel efficiency characteristics. Performance perception challenges pose another significant barrier, as some consumers associate low rolling resistance with compromised wet grip or handling performance, requiring ongoing consumer education and third-party testing validation. Raw material supply constraints for specialized silica grades and sustainable materials create additional operational challenges for tire manufacturers, demanding ongoing investment in supply chain diversification and alternative material development.
Key trends indicate accelerated adoption in Asia-Pacific markets, particularly India and China, where rapid vehicle electrification and government clean air initiatives drive comprehensive low rolling resistance tire market growth. Technology integration trends toward smart tire monitoring systems with real-time pressure optimization, temperature sensing capabilities, and predictive wear analysis enable proactive performance management that maximizes fuel efficiency and extends tire life. The market thesis could face disruption if breakthrough vehicle technologies significantly reduce tire energy loss importance or if alternative mobility models reduce private vehicle ownership and tire replacement demand.
| Country | CAGR (2025–2035) |
|---|---|
| India | 14.4% |
| China | 14.1% |
| France | 13.6% |
| Brazil | 13.2% |
| Germany | 13.0% |
| USA | 12.1% |
| UK | 11.7 |
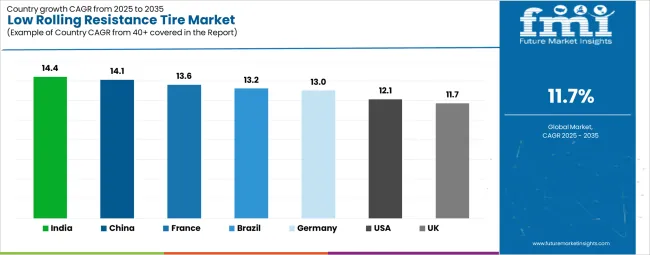
The low rolling resistance tire market is accelerating globally, with India leading at a 14.4% CAGR, supported by ambitious vehicle electrification targets, government-backed emissions reduction programs, and rapid adoption of energy-efficient automotive technologies. China, close behind at 14.1% CAGR, leverages its position as the world’s largest electric vehicle market, strict fuel efficiency regulations, and expanding domestic tire manufacturing capacity to remain a key growth hub in Asia-Pacific.
France demonstrates strong momentum at 13.6% CAGR, with integration of advanced tire technologies and sustainability initiatives reinforcing its leadership in the European green mobility transition. Brazil follows with 13.2% CAGR, driven by biofuel optimization, fleet modernization, and increasing focus on sustainable transportation. Germany, at 13.0% CAGR, continues to capitalize on its premium automotive base and advanced R&D capabilities in tire innovation. Meanwhile, the USA (12.1% CAGR) and the UK (11.7% CAGR) advance steadily, supported by corporate sustainability commitments, regulatory compliance, and adoption of premium low rolling resistance technologies.
The report covers an in-depth analysis of 40+ countries, Top-performing countries are highlighted below.
India demonstrates the strongest growth potential in the Low Rolling Resistance Tire Market with a CAGR of 14.4% through 2035. The country's leadership position stems from aggressive vehicle electrification plans targeting 30% electric vehicle penetration by 2030, government-backed fuel efficiency standards, and rising consumer environmental awareness driving the adoption of advanced tire solutions. Growth is concentrated in major metropolitan areas, including Delhi NCR, Mumbai, Bangalore, and Chennai, where electric vehicle infrastructure and premium automotive segments are implementing low rolling resistance tire solutions for enhanced efficiency performance and regulatory compliance. Distribution channels through automotive retail chains, e-commerce platforms, and authorized tire dealers expand deployment across passenger vehicle applications and emerging electric mobility initiatives. The country's National Electric Mobility Mission Plan provides policy support for clean transportation technologies, including fuel-efficient tire adoption.
In Beijing, Shanghai, Shenzhen, and Guangzhou, the adoption of comprehensive low rolling resistance tire solutions is accelerating across electric vehicle platforms and passenger car segments, driven by world-leading EV production and government clean air quality initiatives. The market demonstrates strong growth momentum with a CAGR of 14.1% through 2035, linked to comprehensive automotive electrification and increasing focus on energy efficiency optimization. Chinese automakers are implementing advanced low rolling resistance tire technologies and integrated monitoring platforms to enhance vehicle range while meeting growing demand in expanding electric mobility and autonomous vehicle sectors. The country's New Energy Vehicle (NEV) policy and dual-credit system create sustained demand for fuel-efficient tire solutions, while increasing emphasis on carbon neutrality goals drives adoption of advanced environmental control systems.
France's automotive sector demonstrates sophisticated implementation of low rolling resistance tire technologies, with documented case studies showing 40% adoption of fuel-efficient tires through environmental labeling programs and consumer incentive schemes. The country's automotive infrastructure in major cities, including Paris, Lyon, Marseille, and Toulouse, showcases integration of advanced tire technologies with vehicle efficiency systems, leveraging expertise in sustainable mobility and environmental innovation. French consumers emphasize environmental responsibility and fuel economy, creating demand for premium low rolling resistance tire solutions that support CO2 reduction initiatives and operational cost optimization requirements. The market maintains robust growth through focus on sustainability integration and regulatory compliance, with a CAGR of 13.6% through 2035.
Brazil's market expansion is driven by diverse automotive demand, including flex-fuel vehicle optimization in São Paulo and commercial fleet modernization in other major cities, and comprehensive aftermarket infrastructure across multiple states. The country demonstrates promising growth potential with a CAGR of 13.2% through 2035, supported by federal government vehicle efficiency programs and state-level emissions reduction initiatives. Brazilian fleet operators face implementation opportunities related to fuel cost savings and environmental compliance, creating compelling adoption cases for low rolling resistance tire technologies. The economic volatility and import tariff considerations require localized production capabilities and competitive pricing strategies from international suppliers. Growing fuel price concerns and environmental awareness create business momentum for tire market expansion, particularly in urban areas where fleet operations have a direct impact on air quality and operational economics.
The German market leads in premium low rolling resistance tire innovation based on integration with advanced vehicle systems and electric mobility platforms for enhanced efficiency. The country shows strong potential with a CAGR of 13.0% through 2035, driven by the transition to electric mobility and expanding premium vehicle production in major automotive centers, including Stuttgart, Munich, Wolfsburg, and Ingolstadt. German automakers are adopting ultra-low rolling resistance tire systems for efficiency optimization and regulatory compliance, particularly in premium and luxury vehicle segments demanding comprehensive performance upgrades. Technology deployment channels through established OEM partnerships and premium aftermarket retailers expand coverage across production facilities and high-end consumer segments.
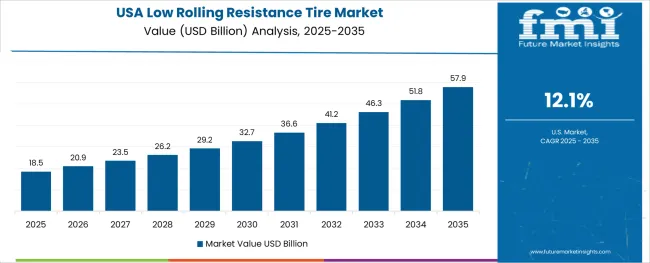
In major metropolitan areas including Los Angeles, New York, Houston, and Chicago, fleet operators are implementing comprehensive low rolling resistance tire solutions to reduce fuel costs and meet corporate sustainability targets, with documented case studies showing 6-8% fuel consumption reduction through advanced tire technology adoption. The market shows strong growth potential with a CAGR of 12.1% through 2035, linked to the large commercial vehicle fleet, increasing electric vehicle adoption, and corporate environmental commitments in logistics and transportation sectors. American fleet managers are adopting intelligent tire monitoring and fuel-efficient solutions to enhance operational economics while maintaining safety standards demanded by the Department of Transportation and environmental regulations. The country's established logistics infrastructure creates sustained demand for tire performance optimization solutions that integrate with fleet management systems.
In London, Manchester, Birmingham, and Glasgow, vehicle operators are implementing low rolling resistance tire solutions to comply with Ultra Low Emission Zone requirements and optimize fuel consumption, with documented consumer surveys showing 55% awareness of tire fuel efficiency ratings through government labeling programs. The market shows steady growth potential with a CAGR of 11.7% through 2035, linked to stringent emissions regulations, established vehicle testing standards, and growing environmental consciousness among UK consumers. British motorists are adopting fuel-efficient tire technologies and monitoring platforms to enhance vehicle economy while maintaining compliance with MOT testing requirements and urban emissions standards. The country's commitment to carbon neutrality by 2050 creates sustained demand for tire efficiency solutions that contribute to transportation sector decarbonization.
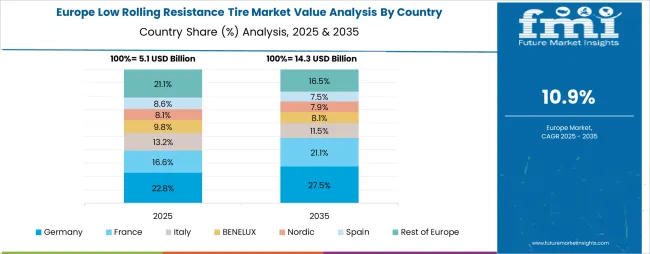
The low rolling resistance tire market in Europe is projected to grow from USD 6.8 billion in 2025 to USD 20.4 billion by 2035, registering a CAGR of 11.6% over the forecast period. Germany is expected to maintain its leadership position with a 28.5% market share in 2025, growing to 29.2% by 2035, supported by its extensive premium automotive manufacturing base, advanced tire technology development, and comprehensive emissions reduction programs serving major European markets.
France follows with a 24.3% share in 2025, projected to reach 25.1% by 2035, driven by comprehensive tire labeling regulations and strong consumer environmental awareness in Paris, Lyon, and other major cities implementing advanced low rolling resistance tire systems. The United Kingdom holds a 18.7% share in 2025, expected to maintain 18.4% by 2035 through ongoing electric vehicle adoption and urban emissions zone expansion. Italy commands a 12.4% share, while Spain accounts for 9.6% in 2025. The Rest of Europe region is anticipated to gain momentum, maintaining its collective share around 6.5% through 2035, attributed to increasing tire efficiency adoption in Nordic countries and emerging Eastern European markets implementing EU emissions standards.
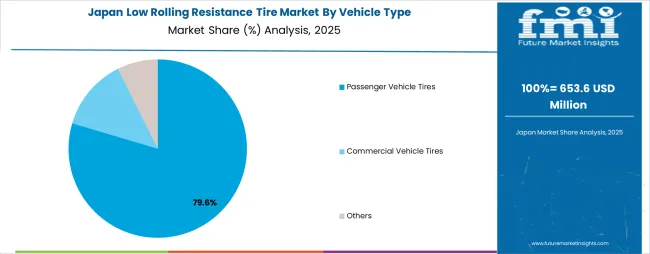
The Japanese Low Rolling Resistance Tire Market demonstrates a mature and technology-focused landscape, characterized by sophisticated integration of advanced tire compounds with hybrid and electric vehicle platforms across passenger cars, luxury vehicles, and commercial applications. Japan's emphasis on manufacturing excellence and environmental responsibility drives demand for ultra-efficient tire solutions that support kaizen continuous improvement initiatives and strict fuel economy regulations in automotive operations.
The market benefits from strong partnerships between domestic tire manufacturers like Bridgestone Corporation and Yokohama Rubber Co. with global automotive leaders, including Toyota and Nissan, creating comprehensive technology ecosystems that prioritize efficiency optimization and environmental performance programs. Automotive centers in Tokyo, Osaka, Nagoya, and other major industrial areas showcase advanced technology implementations where low rolling resistance tire systems achieve superior fuel savings through integrated vehicle monitoring programs.
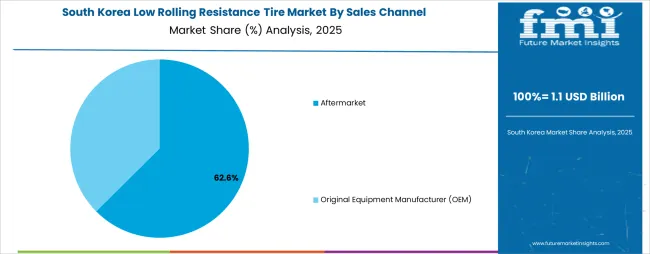
The South Korean Low Rolling Resistance Tire Market is characterized by strong domestic manufacturer presence, with companies like Hankook Tire & Technology Co. and Kumho Tire Co. maintaining competitive positions through comprehensive research and development capabilities for electric vehicle and premium automotive applications. The market is demonstrating a growing emphasis on export-oriented production and global market expansion, as Korean tire manufacturers increasingly supply international automotive brands with advanced low rolling resistance technologies deployed across Asia Pacific, North America, and European markets.
Local automotive companies and tire specialists are gaining global market share through strategic partnerships with international vehicle manufacturers, offering specialized technologies including silica compound innovations and smart tire monitoring systems for diverse applications. The competitive landscape shows increasing collaboration between Korean tire manufacturers and global automotive brands, creating technology transfer models that combine domestic innovation capabilities with international market access and brand recognition.
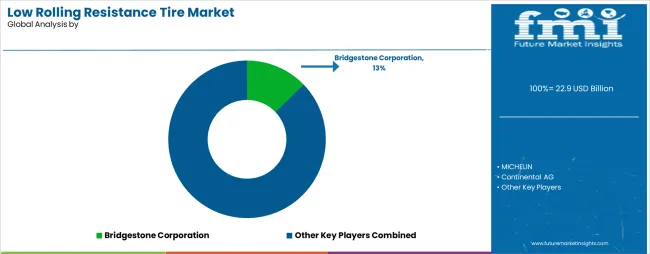
The Low Rolling Resistance Tire Market features approximately 40-50 meaningful players with moderate concentration, where the top three companies control roughly 45-50% of global market share through established technology portfolios and extensive automotive industry relationships. Competition centers on fuel efficiency performance, technological innovation, and OEM partnerships rather than price competition alone.
Market leaders include Bridgestone Corporation, MICHELIN, and Continental AG, which maintain competitive advantages through comprehensive low rolling resistance tire portfolios, global manufacturing networks, and deep expertise in advanced compound technologies and vehicle integration, creating high switching costs for OEM customers. These companies leverage established technical relationships with major automakers and ongoing research and development programs to defend market positions while expanding into electric vehicle platforms and emerging mobility applications.
Challengers encompass Goodyear Tire & Rubber Company and Pirelli & C S.p.A, which compete through specialized premium tire solutions and strong brand positioning in luxury and high-performance vehicle markets. Technology specialists, including Sumitomo Rubber Industries, Hankook Tire & Technology, and Yokohama Rubber, focus on specific tire technologies or regional markets, offering differentiated capabilities in advanced silica compounds, smart tire systems, and application-specific solutions.
Regional players and emerging tire manufacturers create competitive pressure through cost-effective solutions and rapid production scaling, particularly in high-growth markets including China and India, where local presence provides advantages in market access and regional automotive partnerships. Market dynamics favor companies that combine advanced low rolling resistance technologies with comprehensive OEM relationships that address the complete vehicle efficiency lifecycle from initial design through replacement tire aftermarket support.
Low rolling resistance tire solutions represent a critical automotive efficiency technology that enables vehicle owners, fleet operators, and automotive manufacturers to reduce fuel consumption and carbon emissions without substantial vehicle modification requirements, typically providing 8-12% fuel savings and 10-15% extended electric vehicle range compared to conventional alternatives. With the market projected to grow from USD 22.9 billion in 2025 to USD 69.2 billion by 2035 at an 11.7% CAGR, these solutions offer compelling advantages including superior fuel economy, enhanced sustainability performance, and advanced safety features making them essential for passenger vehicles (77% market share), commercial fleets, and diverse electric mobility applications seeking cost-effective efficiency solutions. Scaling market penetration and technology adoption requires coordinated action across automotive policy, industry standards, tire manufacturers, vehicle OEMs, and consumer education programs.
How Governments Could Spur Local Production and Adoption?
How Industry Bodies Could Support Market Development?
How Manufacturers and Technology Players Could Strengthen the Ecosystem?
How Suppliers Could Navigate the Shift?
How Investors and Financial Enablers Could Unlock Value?
| Item | Details |
|---|---|
| Quantitative Units (2025) | USD 22.9 billion |
| Vehicle Type | Passenger Vehicle Tires, Commercial Vehicle Tires, Others |
| Sales Channel | Aftermarket, Original Equipment Manufacturer (OEM) |
| Tire Construction | Radial Tires, Bias Tires |
| Regions Covered | Asia Pacific, Europe, North America, Latin America, Middle East & Africa |
| Countries Covered | India, China, France, Brazil, Germany, the USA, the UK, and 40+ additional countries |
| Key Companies Profiled | Bridgestone Corporation, MICHELIN, Continental AG, Goodyear Tire & Rubber Company, Pirelli & C S.p.A, Sumitomo Rubber Industries Ltd., Hankook Tire & Technology Co. Ltd., Yokohama Rubber Co. Ltd., Nokian Tyres plc, Apollo Tyres Ltd., Cheng Shin Rubber Industry Co. Ltd., Triangle Tyre Co. Ltd., CEAT Ltd., JK Tyre & Industries Ltd., MRF Limited |
| Additional Attributes | Dollar sales by vehicle type, sales channel, and tire construction categories; regional adoption trends across Asia Pacific, Europe, and North America; competitive landscape with tire manufacturers and OEM partnerships; fuel efficiency performance specifications and testing standards; integration with EV platforms and smart mobility systems; innovations in silica compound technologies and sustainable materials; development of specialized applications with enhanced fuel economy and safety capabilities. |
How big is the low rolling resistance tire market in 2025?
The global low rolling resistance tire market is valued at USD 22.9 billion in 2025.
What will be the size of the low rolling resistance tire market in 2035?
The size of the low rolling resistance tire market is projected to reach USD 69.2 billion by 2035.
How much will the low rolling resistance tire market grow between 2025 and 2035?
The low rolling resistance tire market is expected to grow at an 11.7% CAGR between 2025 and 2035.
What are the key vehicle type segments in the low rolling resistance tire market?
The key vehicle type segments in the low rolling resistance Tire market are Passenger Vehicle Tires, Commercial Vehicle Tires, and Others.
Which sales channel segment is expected to contribute a significant share to the low rolling resistance tire market in 2025?
In terms of sales channel, the Aftermarket segment is set to command the dominant share in the low rolling resistance tire market in 2025.
The global low rolling resistance tire market is estimated to be valued at USD 22.9 billion in 2025.
The market size for the low rolling resistance tire market is projected to reach USD 69.2 billion by 2035.
The low rolling resistance tire market is expected to grow at a 11.7% CAGR between 2025 and 2035.
The key product types in low rolling resistance tire market are passenger vehicle tires, commercial vehicle tires and others.
In terms of sales channel, aftermarket segment to command 60.0% share in the low rolling resistance tire market in 2025.


Our Research Products

The "Full Research Suite" delivers actionable market intel, deep dives on markets or technologies, so clients act faster, cut risk, and unlock growth.

The Leaderboard benchmarks and ranks top vendors, classifying them as Established Leaders, Leading Challengers, or Disruptors & Challengers.

Locates where complements amplify value and substitutes erode it, forecasting net impact by horizon

We deliver granular, decision-grade intel: market sizing, 5-year forecasts, pricing, adoption, usage, revenue, and operational KPIs—plus competitor tracking, regulation, and value chains—across 60 countries broadly.

Spot the shifts before they hit your P&L. We track inflection points, adoption curves, pricing moves, and ecosystem plays to show where demand is heading, why it is changing, and what to do next across high-growth markets and disruptive tech

Real-time reads of user behavior. We track shifting priorities, perceptions of today’s and next-gen services, and provider experience, then pace how fast tech moves from trial to adoption, blending buyer, consumer, and channel inputs with social signals (#WhySwitch, #UX).

Partner with our analyst team to build a custom report designed around your business priorities. From analysing market trends to assessing competitors or crafting bespoke datasets, we tailor insights to your needs.
Supplier Intelligence
Discovery & Profiling
Capacity & Footprint
Performance & Risk
Compliance & Governance
Commercial Readiness
Who Supplies Whom
Scorecards & Shortlists
Playbooks & Docs
Category Intelligence
Definition & Scope
Demand & Use Cases
Cost Drivers
Market Structure
Supply Chain Map
Trade & Policy
Operating Norms
Deliverables
Buyer Intelligence
Account Basics
Spend & Scope
Procurement Model
Vendor Requirements
Terms & Policies
Entry Strategy
Pain Points & Triggers
Outputs
Pricing Analysis
Benchmarks
Trends
Should-Cost
Indexation
Landed Cost
Commercial Terms
Deliverables
Brand Analysis
Positioning & Value Prop
Share & Presence
Customer Evidence
Go-to-Market
Digital & Reputation
Compliance & Trust
KPIs & Gaps
Outputs
Full Research Suite comprises of:
Market outlook & trends analysis
Interviews & case studies
Strategic recommendations
Vendor profiles & capabilities analysis
5-year forecasts
8 regions and 60+ country-level data splits
Market segment data splits
12 months of continuous data updates
DELIVERED AS:
PDF EXCEL ONLINE
Western Europe Low Rolling Resistance Tire Market Growth – Trends & Forecast 2023-2033
Japan Low Rolling Resistance Tire Market Growth – Trends & Forecast 2023-2033
Korea Low Rolling Resistance Tire Market Growth – Trends & Forecast 2023-2033
Demand for Low Rolling Resistance Tire in EU Size and Share Forecast Outlook 2025 to 2035
Low Alloy Steels Powder Market Size and Share Forecast Outlook 2025 to 2035
Low Alkali Cement Market Size and Share Forecast Outlook 2025 to 2035
Low Vibration Thermostat Market Size and Share Forecast Outlook 2025 to 2035
Low-Level Order Picker Pallet Truck Market Size and Share Forecast Outlook 2025 to 2035
Low Voltage Components Market Size and Share Forecast Outlook 2025 to 2035
Low Temperature Flexible Tester Market Size and Share Forecast Outlook 2025 to 2035
Tire Marking Machine Market Size and Share Forecast Outlook 2025 to 2035
Rolling Stock Management Market Forecast Outlook 2025 to 2035
Low Light Imaging Market Forecast Outlook 2025 to 2035
Low Density Polyethylene Market Forecast and Outlook 2025 to 2035
Low-Temperature Cable Market Size and Share Forecast Outlook 2025 to 2035
Low Molecular Weight Chondroitin Sulfate Sodium Market Size and Share Forecast Outlook 2025 to 2035
Tire Pressure Monitoring System Market Size and Share Forecast Outlook 2025 to 2035
Tire Cord Fabric Market Size and Share Forecast Outlook 2025 to 2035
Low Temperature Radiators Market Size and Share Forecast Outlook 2025 to 2035
Low Temperature Commercial Boiler Market Size and Share Forecast Outlook 2025 to 2035

Thank you!
You will receive an email from our Business Development Manager. Please be sure to check your SPAM/JUNK folder too.
Chat With
MaRIA