Low Fat Drinks Market Size and Share Forecast Outlook 2025 to 2035

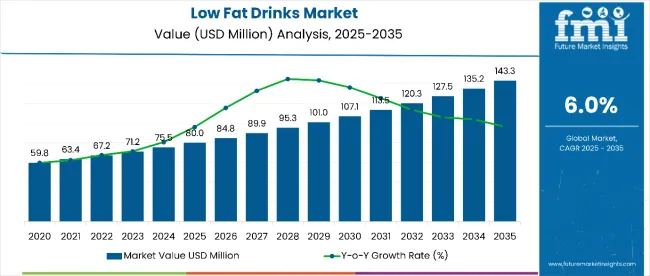
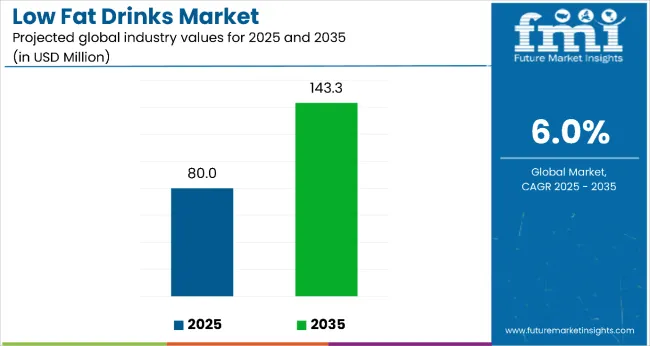
The global low-fat drinks market is estimated at USD 80 million in 2025 and is forecasted to reach USD 143.3 million by 2035, reflecting a compound annual growth rate (CAGR) of 6%. This expansion is being driven by growing consumer preference for healthier beverage options that support weight control and overall wellness. The market is projected to add an absolute dollar opportunity of USD 50 million during the forecast period.
Low Fat Drinks Market Value Analysis

Quick Stats

  • Low Fat Drinks Market Value (2025): USD 80 million
  • Low Fat Drinks Market Forecast Value (2035): USD 143.3 million
  • Low Fat Drinks Market Forecast CAGR: 6%
  • Leading Segment by Product Type in Low-Fat Drinks Market in 2025: Non-Alcoholic (80% market share)
  • Key Growth Regions in Low Fat Drinks Market: North America, Western Europe, East Asia
  • Top Key Players in Low Fat Drinks Market: PepsiCo, The Coca-Cola Company, Diageo, Herbal Water, Inc., Bacardi Limited

Low Fat Drinks Market

By 2030, the market is likely to reach approximately USD 94.5 million, accounting for an incremental value of USD 19.5 million during the first half of the decade. The remaining USD 30.5 million is expected in the latter half, indicating a moderately back-loaded growth pattern.

Leading manufacturers such as PepsiCo and The Coca-Cola Company are leveraging this trend by broadening their product portfolios and introducing innovative low-fat beverage solutions. Simultaneously, an increased focus on clean-label formulations and natural ingredients is influencing strategic priorities as brands respond to heightened consumer demand for transparency and health-oriented products.

The market holds a notable position across several larger parent industries. It represents approximately 1.2% of the global food and beverage market, driven by its integration into healthier beverage alternatives. Within the health and wellness sector, the share is estimated at 3.5%, supported by increasing consumer demand for functional drinks that assist in weight control and overall metabolic health. Its contribution to the functional beverages category is around 4.8%, reflecting a steady shift toward products offering added nutritional benefits. Additionally, it accounts for nearly 2.0% of the broader consumer goods segment, indicating its expanding relevance in daily nutrition habits.

The low-fat drinks market is undergoing strong growth as consumers increasingly opt for beverages that aid in weight management and reduce the risk of chronic illnesses. Industry leaders such as PepsiCo and The Coca-Cola Company are broadening their portfolios with low-fat, sugar-free, and naturally formulated offerings to cater to a health-conscious consumer base. Innovation within plant-based drinks, particularly vegan options, is accelerating this trend, reinforcing the category’s alignment with clean-label and lifestyle-focused consumption patterns.

Why is the Low-Fat Drinks Market Growing?

Low-fat drinks are witnessing strong adoption as health-conscious consumers seek alternatives that provide reduced fat without compromising on taste, hydration, or functional benefits. These products have become increasingly attractive due to their alignment with weight management goals and lifestyle-oriented nutrition trends. Rising global awareness regarding obesity, hypertension, and cardiovascular diseases has intensified the shift from traditional full-fat and sugary beverages toward healthier options, supporting steady market growth.

Demand is further supported by the surge in low-calorie, sugar-free, and plant-based beverage consumption, driven by the rise of vegan and lactose-free diets. Functional beverages fortified with electrolytes, vitamins, and proteins are gaining traction for post-workout recovery and digestive health benefits. These formulations cater to both fitness enthusiasts and mainstream consumers prioritizing preventive health.

Technological advancements in fat-reduction processes, natural sweetener integration, and flavor-enhancement systems are enabling the development of products that maintain taste and texture integrity while reducing fat content. Innovations such as oat-based, almond-based, and other plant-derived alternatives have expanded product diversity, creating new growth avenues. Ready-to-drink formats, clean-label claims, and transparent ingredient sourcing further reinforce consumer trust, positioning low-fat drinks as a key component of the global wellness beverage category.

Low Fat Drinks Market Analysis by Top Investment Segment

The market is segmented by product type, source, packaging, distribution channel, and region. By product type, the market is bifurcated into alcoholic and non-alcoholic. Based on source, the market is characterized into animal-based and plant-based (oat, pea, almond, soy, coconut, and others). In terms of packaging, the market is divided into cans, bottles, cartons, sachets, and others.

By distribution channel, the market is segmented into B2B, B2C (modern trade, convenience stores, online retailers, hypermarkets/supermarkets, specialty stores, and small groceries). Regionally, the market is classified into North America, Latin America, Europe, East Asia, South Asia, Oceania, Middle East & Africa.

By Product Type, Non-Alcoholic Segment Accounts for 80% of the Market Share

The product type segment is divided into alcoholic and non-alcoholic beverages, with non-alcoholic drinks leading the category at 80% market share in 2025. This dominance is driven by a strong consumer shift toward wellness-focused beverage options and reduced alcohol consumption. Non-alcoholic low-fat drinks, particularly in functional and plant-based categories, cater to urban and health-conscious consumers.

Key Factors
  • Increasing adoption of functional, non-alcoholic drinks for hydration and recovery
  • Rising demand for sugar-free and fortified low-fat options
  • Expansion of clean-label and vegan beverage formulations
  • Product innovation targeting fitness and weight-conscious consumers

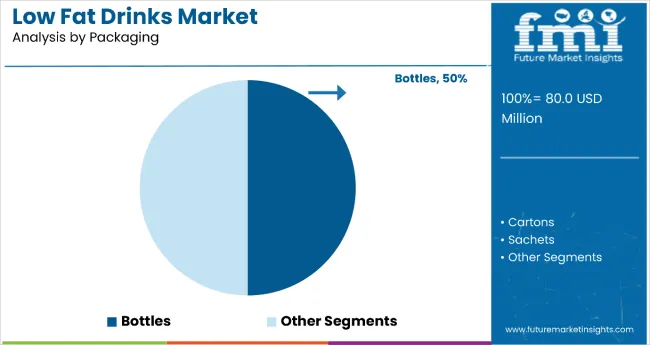
By Packaging, Bottles Account for 50% of the Market Share

Low Fat Drinks Market By Packaging

The packaging segment includes bottles, cans, cartons, sachets, and others. Bottles-both glass and PET-dominate with a 50% share, attributed to their portability, reseal ability, and suitability for premium and mass-market products. While cans remain popular for convenience and on-the-go consumption, cartons and sachets are gaining traction among sustainability-conscious consumers.

Key Factors
  • Consumer preference for resealable formats in functional beverages
  • Growth of eco-friendly packaging, including plant-based cartons
  • Bottles dominate in premium and large-serving categories
  • Retailer push for sustainable alternatives to meet environmental standards

By Distribution Channel, B2C Accounts for 60% of the Market Share

Low Fat Drinks Market By Distribution

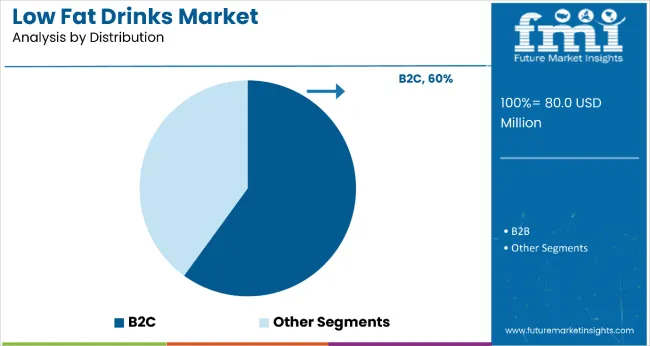
The distribution channel category comprises B2B and B2C, with B2C commanding 60% share in 2025. Within B2C, hypermarkets, supermarkets, and modern trade dominate due to their extensive reach and availability of diverse product offerings. Online retail is growing rapidly, driven by convenience and the popularity of subscription models for functional drinks.

Key Factors

  • Expansion of organized retail and hypermarket chains
  • Rising adoption of e-commerce for health-focused beverages
  • Enhanced availability of product variety in urban retail channels
  • Digital promotions and influencer-driven marketing increasing online demand

What are the Drivers, Restraints, and Key Trends of the Low-Fat Drinks Market?

In 2024, global consumption of low-fat drinks rose by 14% year-on-year, with North America and Asia Pacific accounting for nearly 60% of total demand. The market is shaped by key forces-growing consumer interest in health-centric beverages, technological advancements in fat reduction, and the expansion of plant-based alternatives.

However, product reformulation challenges, pricing constraints, and taste perception issues continue to impact adoption. Clean-label positioning, functional health benefits, and sugar-reduction initiatives remain central to market development, driving brand differentiation and consumer loyalty.

Key Drivers Fueling Low-Fat Drinks Market Expansion

The primary growth stimulus is rising global awareness of lifestyle-related health conditions such as obesity, diabetes, and cardiovascular disorders. Consumers are actively seeking beverages that deliver essential nutrition without excess fat or sugar. Low-fat drinks serve as healthier substitutes for traditional options, aligning with preventive health goals and fitness-oriented lifestyles.

Demand is further strengthened by the increasing adoption of functional beverages that aid energy, digestion, and post-workout recovery. Low-fat formulations enriched with proteins, vitamins, and electrolytes are gaining strong traction in sports nutrition and general wellness categories. The growth of plant-based and dairy-alternative beverages-driven by veganism and lactose intolerance-has expanded market opportunities significantly.

Technological progress in fat removal, flavor masking, and natural ingredient integration has improved the sensory profile of low-fat beverages. These advancements allow manufacturers to deliver clean-label, nutrient-rich drinks without compromising on taste or shelf stability.

Major Restraints Challenging Low-Fat Drinks Market Development

Despite positive momentum, the market faces structural hurdles. Reformulation complexity often results in higher production costs, as fat reduction impacts beverage mouthfeel and texture. Manufacturers resort to stabilizers and natural flavoring agents to maintain taste, which can further escalate costs.

Price sensitivity in emerging markets poses another challenge, where premium low-fat beverages compete against cost-effective traditional options. Additionally, regulatory discrepancies in nutrient labeling and health claims across regions create barriers for global standardization. Limited supply of high-quality plant-based ingredients and natural additives adds to procurement difficulties, creating scalability concerns for brands operating in multiple geographies.

Emerging Key Trends Influencing Low-Fat Drinks Market Direction

Clean-label and plant-based innovations dominate emerging trends. Consumers increasingly favor beverages with transparent ingredient lists and ethical sourcing credentials, prompting manufacturers to expand vegan product lines using oat, almond, coconut, and pea proteins. This transition supports broader acceptance among lactose-intolerant and environmentally conscious buyers.

Sugar reduction is another critical trend, with brands adopting natural sweeteners like stevia, monk fruit, and erythritol to maintain taste without raising caloric content. Functional fortification through probiotics, antioxidants, and adaptogens is reshaping product positioning, targeting immunity and energy-boosting benefits. Convenience formats-such as single-serve bottles and ready-to-drink packs-are widely adopted, reflecting the demand for on-the-go health solutions.

Regionally, North America continues to lead in innovation and premiumization, while Asia Pacific emerges as a key growth frontier due to expanding urban middle-class populations and heightened health awareness. These shifts underline the long-term potential of the low-fat drinks category within the global beverage industry.
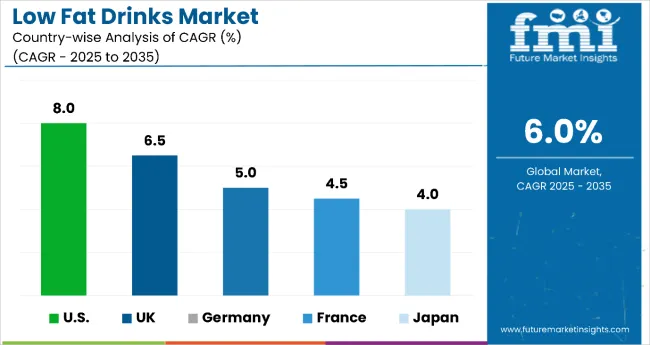
Analysis of Low-Fat Drinks Market By Key Countries

Country Wise Analysis Of Low Fat Drinks Market

Country CAGR
United States 8%
United Kingdom 6.5%
Germany 5%
France 4.5%
Japan 4%

The growth rates for the low-fat drinks market in the USA, the UK, Germany, France, and Japan vary significantly due to differences in consumer preferences, health trends, and regulatory environments. The USA is expected to lead with the highest growth rate at 8% CAGR, driven by a growing health-conscious population and demand for low-fat alternatives.

The UK follows closely with 6.5% CAGR with strong consumer shifts towards healthier, plant-based options. Germany and France show steady growth at CAGRs of 5% and 4.5% due to established markets for functional beverages. Japan presents a slower growth rate at 4% but a consistent demand for functional and health-focused products.

Demand Analysis for Low Fat Drinks in the United States by Product Type

The USA low-fat drinks market is projected to record the fastest growth globally, with an estimated CAGR of 8% between 2025 and 2035. Rising health awareness, combined with growing concerns over obesity and cardiovascular diseases, continues to drive demand. Non-alcoholic beverages dominate, supported by plant-based innovations like oat and almond-based drinks. Functional beverages targeting fitness and post-workout recovery are gaining popularity among urban and health-conscious consumers.

Key Highlights

  • Market projected to reach USD 8 million by 2025
  • Non-alcoholic drinks to maintain 80% share in 2025
  • Oat-based plant drinks expected to grow 12% annually

Demand Analysis for Low Fat Drinks in the United Kingdom by Source

The UK low-fat drinks market is expected to expand at a CAGR of 6.5% during the forecast period. Growing consumer demand for health-driven and vegan-friendly beverages drives strong adoption of plant-based low-fat alternatives. Functional drinks supporting immunity, weight management, and digestive health are becoming mainstream across retail channels.

Key Highlights

  • Plant-based beverages to hold 40% market share by 2025
  • Functional beverage sales to rise at 7% annually
  • Vegan low-fat drinks forecasted to grow 10% annually

Market Integration in Low Fat Drinks Market in Germany

The sales of low-fat drinks in Germany are growing steadily with a CAGR of 5% from 2025 to 2035, as health-conscious consumers demand better options for weight management and heart health. There is a growing trend toward clean-label and organic beverages, which appeal to the increasing number of people looking for natural and minimally processed products. Additionally, functional beverages designed to improve overall wellness, such as those targeting diabetes and digestive health, are expanding in popularity.

  • Germany’s low-fat drinks market is projected to exceed USD 6 million by 2025.
  • Clean-label drinks expected to hold 30% market share in 2025.
  • Functional drinks targeting cardiovascular health growing at 5% CAGR.

Production Capacity Trends in Low Fat Drinks Market in France

The low fat drinks market in France is projected to grow at a CAGR of 4.5% from 2025 to 2035, supported by an increasing demand for healthier beverage alternatives. French consumers are prioritizing weight management and digestive health, leading to a rise in demand for functional drinks, including low-fat options that support these needs. Plant-based low-fat drinks are seeing strong growth, with oat and almond-based beverages becoming particularly popular among the health-conscious demographic.

  • Plant-based low-fat drinks expected to grow by 9% annually in France.
  • The French market for low-fat functional drinks to reach USD 7 million by 2025.
  • Digestive health drinks growing at a 6% CAGR by 2025.

Structural Adoption in Low Fat Drinks Market in Japan

The demand for low-fat drinks in Japan is growing steadily, with an estimated CAGR of 4% from 2025to 2035. The country’s aging population, which is increasingly focused on maintaining health, is driving demand for functional beverages, particularly those that support cardiovascular health, weight management, and digestion. Additionally, Japan is witnessing a shift toward plant-based low-fat drinks as part of a broader health and wellness trend. The market for low-fat drinks is expected to continue growing, albeit at a slower pace compared to other regions.

  • Japan’s low-fat drinks market expected to reach USD 5 million by 2025.
  • Weight management drinks projected to account for 40% market share.
  • Cardiovascular health-focused low-fat drinks growing by 5% annually in Japan

Competitive Landscape in Low Fat Drinks Market

The global low-fat drinks market is highly fragmented, with both established brands and emerging players competing through pricing, innovation, partnerships, and expansion. Major companies like PepsiCo, Coca-Cola, and Nestlé are leveraging both traditional retail and e-commerce platforms to reach health-conscious consumers. These companies are focusing on product diversification, clean-label formulations, and strategic partnerships to strengthen their market presence.

Leading players have introduced innovative products to meet the rising demand for healthier beverages. For example, PepsiCo and Coca-Cola have expanded their portfolios to include low-fat, sugar-free, and plant-based options, responding to the increasing shift toward functional and health-driven drinks. Additionally, companies like Nestlé are incorporating functional ingredients, such as vitamins and minerals, in their low-fat beverage offerings.

Emerging startups and regional players are making significant strides by offering niche products and targeting specific consumer segments, capitalizing on the growing trend of personalized nutrition and the demand for functional beverages.

However, players in this market face challenges such as intense competition, the need for continuous innovation, and regulatory hurdles. Consumer skepticism about the authenticity of health claims, as well as concerns over preservatives and artificial ingredients in low-fat drinks, remain significant obstacles. To overcome these challenges, companies must prioritize transparency, quality assurance, and consumer education.

Scope of Report

Item Value
Quantitative Units (2025) USD 80 Million
Product Type Alcoholic, Non-Alcoholic
Source Animal-based, Plant-based, Oat, Pea, Almond, Soy, Coconut, Others.
Packaging Cans, Bottles, Cartons, Sachets, Others
Distribution Channel B2B, B2C, Modern Trade, Convenience Stores, Online Retailers, Hypermarkets/Supermarkets, Specialty Stores, Small Groceries
Regions Covered North America, Latin America, Europe, East Asia, South Asia, Oceania, Middle East & Africa
Country Covered United States, United Kingdom, Germany, France, Japan, Canada, India, Brazil, Australia , and 40+ countries
Key Companies Profiled Organic India Pvt. Ltd., Healthvit , Medisyskart , Amazon, Flipkart, PepsiCo, The Coca-Cola Company, Diageo, Bacardi Limited, Herbal Water, SGC Global LLC
Additional Attributes Dollar sales by product type and end-use sector, growing usage in flooring and structural panels for residential construction, stable demand in furniture and interior applications, innovations in cross-laminated bamboo and low-emission adhesives improve strength, durability, and environmental compliance

Key Segmentation

By Product Type:

  • Alcoholic
  • Non- Alcoholic

By Source:

  • Animal based
  • Plant based
    • Oat
    • Pea
    • Almond
    • Soy
    • Coconut
    • others

By Packaging:

  • Cans
  • Bottles
  • Cartons
  • Sachets
  • Others

By Distribution Channel:

  • B2B
  • B2C
    • Modern Trade
    • Convenience Stores
    • Online Retailers
    • Hypermarkets/Supermarkets
    • Convenience Stores
    • Specialty Stores
    • Small Groceries

Table of Content

  1. Executive Summary
    • Global Market Outlook
    • Demand-side Trends
    • Supply-side Trends
    • Technology Roadmap Analysis
    • Analysis and Recommendations
  2. Market Overview
    • Market Coverage / Taxonomy
    • Market Definition / Scope / Limitations
  3. Market Background
    • Market Dynamics
      • Drivers
      • Restraints
      • Opportunity
      • Trends
    • Scenario Forecast
      • Demand in Optimistic Scenario
      • Demand in Likely Scenario
      • Demand in Conservative Scenario
    • Opportunity Map Analysis
    • Product Life Cycle Analysis
    • Supply Chain Analysis
      • Supply Side Participants and their Roles
        • Producers
        • Mid-Level Participants (Traders/ Agents/ Brokers)
        • Wholesalers and Distributors
      • Value Added and Value Created at Node in the Supply Chain
      • List of Raw Material Suppliers
      • List of Existing and Potential Buyer’s
    • Investment Feasibility Matrix
    • Value Chain Analysis
      • Profit Margin Analysis
      • Wholesalers and Distributors
      • Retailers
    • PESTLE and Porter’s Analysis
    • Regulatory Landscape
      • By Key Regions
      • By Key Countries
    • Regional Parent Market Outlook
    • Production and Consumption Statistics
    • Import and Export Statistics
  4. Global Low Fat Drinks Market Analysis 2020-2024 and Forecast, 2025-2035
    • Historical Market Size Value (US$ Mn) & Volume (Metric Tons) Analysis, 2020-2024
    • Current and Future Market Size Value (US$ Mn) & Volume (Metric Tons) Projections, 2025-2035
      • Y-o-Y Growth Trend Analysis
      • Absolute $ Opportunity Analysis
  5. Global Low Fat Drinks Market Pricing Analysis 2020-2024 and Forecast 2025-2035
  6. Global Low Fat Drinks Market Analysis 2020-2024 and Forecast 2025-2035, By Product Type
    • Introduction / Key Findings
    • Historical Market Size Value (US$ Mn) & Volume (Metric Tons) Analysis By Product Type, 2020-2024
    • Current and Future Market Size Value (US$ Mn) & Volume (Metric Tons) Analysis and Forecast By Product Type, 2025-2035
      • Alcoholic
      • Non-Alcoholic
    • Y-o-Y Growth Trend Analysis By Product Type, 2020-2024
    • Absolute $ Opportunity Analysis By Product Type, 2025-2035
  7. Global Low Fat Drinks Market Analysis 2020-2024 and Forecast 2025-2035, By Source
    • Introduction / Key Findings
    • Historical Market Size Value (US$ Mn) & Volume (Metric Tons) Analysis By Source, 2020-2024
    • Current and Future Market Size Value (US$ Mn) & Volume (Metric Tons) Analysis and Forecast By Source, 2025-2035
      • Animal Based
      • Plant Based
        • Oat
        • Pea
        • Almond
        • Soy
        • Coconut
        • Others
    • Y-o-Y Growth Trend Analysis By Source, 2020-2024
    • Absolute $ Opportunity Analysis By Source, 2025-2035
  8. Global Low Fat Drinks Market Analysis 2020-2024 and Forecast 2025-2035, By Packaging
    • Introduction / Key Findings
    • Historical Market Size Value (US$ Mn) & Volume (Metric Tons) Analysis By Packaging, 2020-2024
    • Current and Future Market Size Value (US$ Mn) & Volume (Metric Tons) Analysis and Forecast By Packaging, 2025-2035
      • Cans
      • Bottles
      • Cartons
      • Sachets
      • Others
    • Y-o-Y Growth Trend Analysis By Packaging, 2020-2024
    • Absolute $ Opportunity Analysis By Packaging, 2025-2035
  9. Global Low Fat Drinks Market Analysis 2020-2024 and Forecast 2025-2035, By Distribution Channel
    • Introduction / Key Findings
    • Historical Market Size Value (US$ Mn) & Volume (Metric Tons) Analysis By Distribution Channel, 2020-2024
    • Current and Future Market Size Value (US$ Mn) & Volume (Metric Tons) Analysis and Forecast By Distribution Channel, 2025-2035
      • B2B
      • B2C
        • Modern Trade
        • Convenience Store
        • Hypermarkets/Supermarkets
        • Specialty Stores
        • Small Groceries
    • Y-o-Y Growth Trend Analysis By Distribution Channel, 2020-2024
    • Absolute $ Opportunity Analysis By Distribution Channel, 2025-2035
  10. Global Low Fat Drinks Market Analysis 2020-2024 and Forecast 2025-2035, By Region
    • Introduction
    • Historical Market Size Value (US$ Mn) & Volume (Metric Tons) Analysis By Region, 2020-2024
    • Current Market Size Value (US$ Mn) & Volume (Metric Tons) Analysis and Forecast By Region, 2025-2035
      • North America
      • Latin America
      • Western Europe
      • Eastern Europe
      • East Asia
      • South Asia & Pacific
      • Middle East and Africa
    • Market Attractiveness Analysis By Region
  11. North America Low Fat Drinks Market Analysis 2020-2024 and Forecast 2025-2035, By Country
    • Historical Market Size Value (US$ Mn) & Volume (Metric Tons) Trend Analysis By Market Taxonomy, 2020-2024
    • Market Size Value (US$ Mn) & Volume (Metric Tons) Forecast By Market Taxonomy, 2025-2035
      • By Country
        • USA
        • Canada
        • Mexico
      • By Product Type
      • By Source
      • By Packaging
      • By Distribution Channel
    • Market Attractiveness Analysis
      • By Country
      • By Product Type
      • By Source
      • By Packaging
      • By Distribution Channel
    • Key Takeaways
  12. Latin America Low Fat Drinks Market Analysis 2020-2024 and Forecast 2025-2035, By Country
    • Historical Market Size Value (US$ Mn) & Volume (Metric Tons) Trend Analysis By Market Taxonomy, 2020-2024
    • Market Size Value (US$ Mn) & Volume (Metric Tons) Forecast By Market Taxonomy, 2025-2035
      • By Country
        • Brazil
        • Argentina
        • Rest of LATAM
      • By Product Type
      • By Source
      • By Packaging
      • By Distribution Channel
    • Market Attractiveness Analysis
      • By Country
      • By Product Type
      • By Source
      • By Packaging
      • By Distribution Channel
    • Key Takeaways
  13. Western Europe Low Fat Drinks Market Analysis 2020-2024 and Forecast 2025-2035, By Country
    • Historical Market Size Value (US$ Mn) & Volume (Metric Tons) Trend Analysis By Market Taxonomy, 2020-2024
    • Market Size Value (US$ Mn) & Volume (Metric Tons) Forecast By Market Taxonomy, 2025-2035
      • By Country
        • Germany
        • Italy
        • France
        • UK
        • Spain
        • BENELUX
        • Nordic
        • Rest of W.Europe
      • By Product Type
      • By Source
      • By Packaging
      • By Distribution Channel
    • Market Attractiveness Analysis
      • By Country
      • By Product Type
      • By Source
      • By Packaging
      • By Distribution Channel
    • Key Takeaways
  14. Eastern Europe Low Fat Drinks Market Analysis 2020-2024 and Forecast 2025-2035, By Country
    • Historical Market Size Value (US$ Mn) & Volume (Metric Tons) Trend Analysis By Market Taxonomy, 2020-2024
    • Market Size Value (US$ Mn) & Volume (Metric Tons) Forecast By Market Taxonomy, 2025-2035
      • By Country
        • Russia
        • Hungary
        • Poland
        • Balkan & Baltics
        • Rest of E. Europe
      • By Product Type
      • By Source
      • By Packaging
      • By Distribution Channel
    • Market Attractiveness Analysis
      • By Country
      • By Product Type
      • By Source
      • By Packaging
      • By Distribution Channel
    • Key Takeaways
  15. East Asia Low Fat Drinks Market Analysis 2020-2024 and Forecast 2025-2035, By Country
    • Historical Market Size Value (US$ Mn) & Volume (Metric Tons) Trend Analysis By Market Taxonomy, 2020-2024
    • Market Size Value (US$ Mn) & Volume (Metric Tons) Forecast By Market Taxonomy, 2025-2035
      • By Country
        • China
        • Japan
        • South Korea
      • By Product Type
      • By Source
      • By Packaging
      • By Distribution Channel
    • Market Attractiveness Analysis
      • By Country
      • By Product Type
      • By Source
      • By Packaging
      • By Distribution Channel
    • Key Takeaways
  16. South Asia & Pacific Low Fat Drinks Market Analysis 2020-2024 and Forecast 2025-2035, By Country
    • Historical Market Size Value (US$ Mn) & Volume (Metric Tons) Trend Analysis By Market Taxonomy, 2020-2024
    • Market Size Value (US$ Mn) & Volume (Metric Tons) Forecast By Market Taxonomy, 2025-2035
      • By Country
        • India
        • Australia & New Zealand
        • ASEAN
        • Rest of SAP
      • By Product Type
      • By Source
      • By Packaging
      • By Distribution Channel
    • Market Attractiveness Analysis
      • By Country
      • By Product Type
      • By Source
      • By Packaging
      • By Distribution Channel
    • Key Takeaways
  17. Middle East and Africa Low Fat Drinks Market Analysis 2020-2024 and Forecast 2025-2035, By Country
    • Historical Market Size Value (US$ Mn) & Volume (Metric Tons) Trend Analysis By Market Taxonomy, 2020-2024
    • Market Size Value (US$ Mn) & Volume (Metric Tons) Forecast By Market Taxonomy, 2025-2035
      • By Country
        • GCC Countries
        • Northern Africa
        • South Africa
        • Turkiye
        • Rest of MEA
      • By Product Type
      • By Source
      • By Packaging
      • By Distribution Channel
    • Market Attractiveness Analysis
      • By Country
      • By Product Type
      • By Source
      • By Packaging
      • By Distribution Channel
    • Key Takeaways
  18. Key Countries Low Fat Drinks Market Analysis
    • USA
      • Pricing Analysis
      • Market Share Analysis, 2024
        • By Product Type
        • By Source
        • By Packaging
        • By Distribution Channel
    • Canada
      • Pricing Analysis
      • Market Share Analysis, 2024
        • By Product Type
        • By Source
        • By Packaging
        • By Distribution Channel
    • Brazil
      • Pricing Analysis
      • Market Share Analysis, 2024
        • By Product Type
        • By Source
        • By Packaging
        • By Distribution Channel
    • Mexico
      • Pricing Analysis
      • Market Share Analysis, 2024
        • By Product Type
        • By Source
        • By Packaging
        • By Distribution Channel
    • Argentina
      • Pricing Analysis
      • Market Share Analysis, 2024
        • By Product Type
        • By Source
        • By Packaging
        • By Distribution Channel
  19. Market Structure Analysis
    • Competition Dashboard
    • Competition Benchmarking
    • Market Share Analysis of Top Players
      • By Regional
      • By Product Type
      • By Source
      • By Packaging
      • By Distribution Channel
  20. Competition Analysis
    • Competition Deep Dive
      • Organic India, Pvt Ltd.
        • Overview
        • Product Portfolio
        • Profitability by Market Segments (Product/Age /Sales Channel/Region)
        • Sales Footprint
        • Strategy Overview
          • Marketing Strategy
          • Product Strategy
          • Channel Strategy
      • healthyvit.com
        • Overview
        • Product Portfolio
        • Profitability by Market Segments (Product/Age /Sales Channel/Region)
        • Sales Footprint
        • Strategy Overview
          • Marketing Strategy
          • Product Strategy
          • Channel Strategy
      • Medisyskart
        • Overview
        • Product Portfolio
        • Profitability by Market Segments (Product/Age /Sales Channel/Region)
        • Sales Footprint
        • Strategy Overview
          • Marketing Strategy
          • Product Strategy
          • Channel Strategy
      • Amazon
        • Overview
        • Product Portfolio
        • Profitability by Market Segments (Product/Age /Sales Channel/Region)
        • Sales Footprint
        • Strategy Overview
          • Marketing Strategy
          • Product Strategy
          • Channel Strategy
      • Flipkart
        • Overview
        • Product Portfolio
        • Profitability by Market Segments (Product/Age /Sales Channel/Region)
        • Sales Footprint
        • Strategy Overview
          • Marketing Strategy
          • Product Strategy
          • Channel Strategy
  21. Assumptions & Acronyms Used
  22. Research Methodology

List of Tables

  • Table 1: Global Market Value (USD Million) Forecast by Region, 2020 to 2035
  • Table 2: Global Market Volume (Metric Tons) Forecast by Region, 2020 to 2035
  • Table 3: Global Market Value (USD Million) Forecast by Product Type, 2020 to 2035
  • Table 4: Global Market Volume (Metric Tons) Forecast by Product Type, 2020 to 2035
  • Table 5: Global Market Value (USD Million) Forecast by Source, 2020 to 2035
  • Table 6: Global Market Volume (Metric Tons) Forecast by Source, 2020 to 2035
  • Table 7: Global Market Value (USD Million) Forecast by Packaging, 2020 to 2035
  • Table 8: Global Market Volume (Metric Tons) Forecast by Packaging, 2020 to 2035
  • Table 9: Global Market Value (USD Million) Forecast by Distribution Channel, 2020 to 2035
  • Table 10: Global Market Volume (Metric Tons) Forecast by Distribution Channel, 2020 to 2035
  • Table 11: North America Market Value (USD Million) Forecast by Country, 2020 to 2035
  • Table 12: North America Market Volume (Metric Tons) Forecast by Country, 2020 to 2035
  • Table 13: North America Market Value (USD Million) Forecast by Product Type, 2020 to 2035
  • Table 14: North America Market Volume (Metric Tons) Forecast by Product Type, 2020 to 2035
  • Table 15: North America Market Value (USD Million) Forecast by Source, 2020 to 2035
  • Table 16: North America Market Volume (Metric Tons) Forecast by Source, 2020 to 2035
  • Table 17: North America Market Value (USD Million) Forecast by Packaging, 2020 to 2035
  • Table 18: North America Market Volume (Metric Tons) Forecast by Packaging, 2020 to 2035
  • Table 19: North America Market Value (USD Million) Forecast by Distribution Channel, 2020 to 2035
  • Table 20: North America Market Volume (Metric Tons) Forecast by Distribution Channel, 2020 to 2035
  • Table 21: Latin America Market Value (USD Million) Forecast by Country, 2020 to 2035
  • Table 22: Latin America Market Volume (Metric Tons) Forecast by Country, 2020 to 2035
  • Table 23: Latin America Market Value (USD Million) Forecast by Product Type, 2020 to 2035
  • Table 24: Latin America Market Volume (Metric Tons) Forecast by Product Type, 2020 to 2035
  • Table 25: Latin America Market Value (USD Million) Forecast by Source, 2020 to 2035
  • Table 26: Latin America Market Volume (Metric Tons) Forecast by Source, 2020 to 2035
  • Table 27: Latin America Market Value (USD Million) Forecast by Packaging, 2020 to 2035
  • Table 28: Latin America Market Volume (Metric Tons) Forecast by Packaging, 2020 to 2035
  • Table 29: Latin America Market Value (USD Million) Forecast by Distribution Channel, 2020 to 2035
  • Table 30: Latin America Market Volume (Metric Tons) Forecast by Distribution Channel, 2020 to 2035
  • Table 31: Western Europe Market Value (USD Million) Forecast by Country, 2020 to 2035
  • Table 32: Western Europe Market Volume (Metric Tons) Forecast by Country, 2020 to 2035
  • Table 33: Western Europe Market Value (USD Million) Forecast by Product Type, 2020 to 2035
  • Table 34: Western Europe Market Volume (Metric Tons) Forecast by Product Type, 2020 to 2035
  • Table 35: Western Europe Market Value (USD Million) Forecast by Source, 2020 to 2035
  • Table 36: Western Europe Market Volume (Metric Tons) Forecast by Source, 2020 to 2035
  • Table 37: Western Europe Market Value (USD Million) Forecast by Packaging, 2020 to 2035
  • Table 38: Western Europe Market Volume (Metric Tons) Forecast by Packaging, 2020 to 2035
  • Table 39: Western Europe Market Value (USD Million) Forecast by Distribution Channel, 2020 to 2035
  • Table 40: Western Europe Market Volume (Metric Tons) Forecast by Distribution Channel, 2020 to 2035
  • Table 41: Eastern Europe Market Value (USD Million) Forecast by Country, 2020 to 2035
  • Table 42: Eastern Europe Market Volume (Metric Tons) Forecast by Country, 2020 to 2035
  • Table 43: Eastern Europe Market Value (USD Million) Forecast by Product Type, 2020 to 2035
  • Table 44: Eastern Europe Market Volume (Metric Tons) Forecast by Product Type, 2020 to 2035
  • Table 45: Eastern Europe Market Value (USD Million) Forecast by Source, 2020 to 2035
  • Table 46: Eastern Europe Market Volume (Metric Tons) Forecast by Source, 2020 to 2035
  • Table 47: Eastern Europe Market Value (USD Million) Forecast by Packaging, 2020 to 2035
  • Table 48: Eastern Europe Market Volume (Metric Tons) Forecast by Packaging, 2020 to 2035
  • Table 49: Eastern Europe Market Value (USD Million) Forecast by Distribution Channel, 2020 to 2035
  • Table 50: Eastern Europe Market Volume (Metric Tons) Forecast by Distribution Channel, 2020 to 2035
  • Table 51: East Asia Market Value (USD Million) Forecast by Country, 2020 to 2035
  • Table 52: East Asia Market Volume (Metric Tons) Forecast by Country, 2020 to 2035
  • Table 53: East Asia Market Value (USD Million) Forecast by Product Type, 2020 to 2035
  • Table 54: East Asia Market Volume (Metric Tons) Forecast by Product Type, 2020 to 2035
  • Table 55: East Asia Market Value (USD Million) Forecast by Source, 2020 to 2035
  • Table 56: East Asia Market Volume (Metric Tons) Forecast by Source, 2020 to 2035
  • Table 57: East Asia Market Value (USD Million) Forecast by Packaging, 2020 to 2035
  • Table 58: East Asia Market Volume (Metric Tons) Forecast by Packaging, 2020 to 2035
  • Table 59: East Asia Market Value (USD Million) Forecast by Distribution Channel, 2020 to 2035
  • Table 60: East Asia Market Volume (Metric Tons) Forecast by Distribution Channel, 2020 to 2035
  • Table 61: South Asia & Pacific Market Value (USD Million) Forecast by Country, 2020 to 2035
  • Table 62: South Asia & Pacific Market Volume (Metric Tons) Forecast by Country, 2020 to 2035
  • Table 63: South Asia & Pacific Market Value (USD Million) Forecast by Product Type, 2020 to 2035
  • Table 64: South Asia & Pacific Market Volume (Metric Tons) Forecast by Product Type, 2020 to 2035
  • Table 65: South Asia & Pacific Market Value (USD Million) Forecast by Source, 2020 to 2035
  • Table 66: South Asia & Pacific Market Volume (Metric Tons) Forecast by Source, 2020 to 2035
  • Table 67: South Asia & Pacific Market Value (USD Million) Forecast by Packaging, 2020 to 2035
  • Table 68: South Asia & Pacific Market Volume (Metric Tons) Forecast by Packaging, 2020 to 2035
  • Table 69: South Asia & Pacific Market Value (USD Million) Forecast by Distribution Channel, 2020 to 2035
  • Table 70: South Asia & Pacific Market Volume (Metric Tons) Forecast by Distribution Channel, 2020 to 2035
  • Table 71: Middle East and Africa Market Value (USD Million) Forecast by Country, 2020 to 2035
  • Table 72: Middle East and Africa Market Volume (Metric Tons) Forecast by Country, 2020 to 2035
  • Table 73: Middle East and Africa Market Value (USD Million) Forecast by Product Type, 2020 to 2035
  • Table 74: Middle East and Africa Market Volume (Metric Tons) Forecast by Product Type, 2020 to 2035
  • Table 75: Middle East and Africa Market Value (USD Million) Forecast by Source, 2020 to 2035
  • Table 76: Middle East and Africa Market Volume (Metric Tons) Forecast by Source, 2020 to 2035
  • Table 77: Middle East and Africa Market Value (USD Million) Forecast by Packaging, 2020 to 2035
  • Table 78: Middle East and Africa Market Volume (Metric Tons) Forecast by Packaging, 2020 to 2035
  • Table 79: Middle East and Africa Market Value (USD Million) Forecast by Distribution Channel, 2020 to 2035
  • Table 80: Middle East and Africa Market Volume (Metric Tons) Forecast by Distribution Channel, 2020 to 2035

List of Figures

  • Figure 1: Global Market Volume (Metric Tons) Forecast 2020 to 2035
  • Figure 2: Global Market Pricing Analysis
  • Figure 3: Global Market Value (USD Million) Forecast 2020 to 2035
  • Figure 4: Global Market Value Share and BPS Analysis by Product Type, 2025 and 2035
  • Figure 5: Global Market Y-o-Y Growth Comparison by Product Type, 2025 to 2035
  • Figure 6: Global Market Attractiveness Analysis by Product Type
  • Figure 7: Global Market Value Share and BPS Analysis by Source, 2025 and 2035
  • Figure 8: Global Market Y-o-Y Growth Comparison by Source, 2025 to 2035
  • Figure 9: Global Market Attractiveness Analysis by Source
  • Figure 10: Global Market Value Share and BPS Analysis by Packaging, 2025 and 2035
  • Figure 11: Global Market Y-o-Y Growth Comparison by Packaging, 2025 to 2035
  • Figure 12: Global Market Attractiveness Analysis by Packaging
  • Figure 13: Global Market Value Share and BPS Analysis by Distribution Channel, 2025 and 2035
  • Figure 14: Global Market Y-o-Y Growth Comparison by Distribution Channel, 2025 to 2035
  • Figure 15: Global Market Attractiveness Analysis by Distribution Channel
  • Figure 16: Global Market Value (USD Million) Share and BPS Analysis by Region, 2025 and 2035
  • Figure 17: Global Market Y-o-Y Growth Comparison by Region, 2025 to 2035
  • Figure 18: Global Market Attractiveness Analysis by Region
  • Figure 19: North America Market Incremental $ Opportunity, 2025 to 2035
  • Figure 20: Latin America Market Incremental $ Opportunity, 2025 to 2035
  • Figure 21: Western Europe Market Incremental $ Opportunity, 2025 to 2035
  • Figure 22: Eastern Europe Market Incremental $ Opportunity, 2025 to 2035
  • Figure 23: East Asia Market Incremental $ Opportunity, 2025 to 2035
  • Figure 24: South Asia & Pacific Market Incremental $ Opportunity, 2025 to 2035
  • Figure 25: Middle East and Africa Market Incremental $ Opportunity, 2025 to 2035
  • Figure 26: North America Market Value Share and BPS Analysis by Country, 2025 and 2035
  • Figure 27: North America Market Value Share and BPS Analysis by Product Type, 2025 and 2035
  • Figure 28: North America Market Y-o-Y Growth Comparison by Product Type, 2025 to 2035
  • Figure 29: North America Market Attractiveness Analysis by Product Type
  • Figure 30: North America Market Value Share and BPS Analysis by Source, 2025 and 2035
  • Figure 31: North America Market Y-o-Y Growth Comparison by Source, 2025 to 2035
  • Figure 32: North America Market Attractiveness Analysis by Source
  • Figure 33: North America Market Value Share and BPS Analysis by Packaging, 2025 and 2035
  • Figure 34: North America Market Y-o-Y Growth Comparison by Packaging, 2025 to 2035
  • Figure 35: North America Market Attractiveness Analysis by Packaging
  • Figure 36: North America Market Value Share and BPS Analysis by Distribution Channel, 2025 and 2035
  • Figure 37: North America Market Y-o-Y Growth Comparison by Distribution Channel, 2025 to 2035
  • Figure 38: North America Market Attractiveness Analysis by Distribution Channel
  • Figure 39: Latin America Market Value Share and BPS Analysis by Country, 2025 and 2035
  • Figure 40: Latin America Market Value Share and BPS Analysis by Product Type, 2025 and 2035
  • Figure 41: Latin America Market Y-o-Y Growth Comparison by Product Type, 2025 to 2035
  • Figure 42: Latin America Market Attractiveness Analysis by Product Type
  • Figure 43: Latin America Market Value Share and BPS Analysis by Source, 2025 and 2035
  • Figure 44: Latin America Market Y-o-Y Growth Comparison by Source, 2025 to 2035
  • Figure 45: Latin America Market Attractiveness Analysis by Source
  • Figure 46: Latin America Market Value Share and BPS Analysis by Packaging, 2025 and 2035
  • Figure 47: Latin America Market Y-o-Y Growth Comparison by Packaging, 2025 to 2035
  • Figure 48: Latin America Market Attractiveness Analysis by Packaging
  • Figure 49: Latin America Market Value Share and BPS Analysis by Distribution Channel, 2025 and 2035
  • Figure 50: Latin America Market Y-o-Y Growth Comparison by Distribution Channel, 2025 to 2035
  • Figure 51: Latin America Market Attractiveness Analysis by Distribution Channel
  • Figure 52: Western Europe Market Value Share and BPS Analysis by Country, 2025 and 2035
  • Figure 53: Western Europe Market Value Share and BPS Analysis by Product Type, 2025 and 2035
  • Figure 54: Western Europe Market Y-o-Y Growth Comparison by Product Type, 2025 to 2035
  • Figure 55: Western Europe Market Attractiveness Analysis by Product Type
  • Figure 56: Western Europe Market Value Share and BPS Analysis by Source, 2025 and 2035
  • Figure 57: Western Europe Market Y-o-Y Growth Comparison by Source, 2025 to 2035
  • Figure 58: Western Europe Market Attractiveness Analysis by Source
  • Figure 59: Western Europe Market Value Share and BPS Analysis by Packaging, 2025 and 2035
  • Figure 60: Western Europe Market Y-o-Y Growth Comparison by Packaging, 2025 to 2035
  • Figure 61: Western Europe Market Attractiveness Analysis by Packaging
  • Figure 62: Western Europe Market Value Share and BPS Analysis by Distribution Channel, 2025 and 2035
  • Figure 63: Western Europe Market Y-o-Y Growth Comparison by Distribution Channel, 2025 to 2035
  • Figure 64: Western Europe Market Attractiveness Analysis by Distribution Channel
  • Figure 65: Eastern Europe Market Value Share and BPS Analysis by Country, 2025 and 2035
  • Figure 66: Eastern Europe Market Value Share and BPS Analysis by Product Type, 2025 and 2035
  • Figure 67: Eastern Europe Market Y-o-Y Growth Comparison by Product Type, 2025 to 2035
  • Figure 68: Eastern Europe Market Attractiveness Analysis by Product Type
  • Figure 69: Eastern Europe Market Value Share and BPS Analysis by Source, 2025 and 2035
  • Figure 70: Eastern Europe Market Y-o-Y Growth Comparison by Source, 2025 to 2035
  • Figure 71: Eastern Europe Market Attractiveness Analysis by Source
  • Figure 72: Eastern Europe Market Value Share and BPS Analysis by Packaging, 2025 and 2035
  • Figure 73: Eastern Europe Market Y-o-Y Growth Comparison by Packaging, 2025 to 2035
  • Figure 74: Eastern Europe Market Attractiveness Analysis by Packaging
  • Figure 75: Eastern Europe Market Value Share and BPS Analysis by Distribution Channel, 2025 and 2035
  • Figure 76: Eastern Europe Market Y-o-Y Growth Comparison by Distribution Channel, 2025 to 2035
  • Figure 77: Eastern Europe Market Attractiveness Analysis by Distribution Channel
  • Figure 78: East Asia Market Value Share and BPS Analysis by Country, 2025 and 2035
  • Figure 79: East Asia Market Value Share and BPS Analysis by Product Type, 2025 and 2035
  • Figure 80: East Asia Market Y-o-Y Growth Comparison by Product Type, 2025 to 2035
  • Figure 81: East Asia Market Attractiveness Analysis by Product Type
  • Figure 82: East Asia Market Value Share and BPS Analysis by Source, 2025 and 2035
  • Figure 83: East Asia Market Y-o-Y Growth Comparison by Source, 2025 to 2035
  • Figure 84: East Asia Market Attractiveness Analysis by Source
  • Figure 85: East Asia Market Value Share and BPS Analysis by Packaging, 2025 and 2035
  • Figure 86: East Asia Market Y-o-Y Growth Comparison by Packaging, 2025 to 2035
  • Figure 87: East Asia Market Attractiveness Analysis by Packaging
  • Figure 88: East Asia Market Value Share and BPS Analysis by Distribution Channel, 2025 and 2035
  • Figure 89: East Asia Market Y-o-Y Growth Comparison by Distribution Channel, 2025 to 2035
  • Figure 90: East Asia Market Attractiveness Analysis by Distribution Channel
  • Figure 91: South Asia & Pacific Market Value Share and BPS Analysis by Country, 2025 and 2035
  • Figure 92: South Asia & Pacific Market Value Share and BPS Analysis by Product Type, 2025 and 2035
  • Figure 93: South Asia & Pacific Market Y-o-Y Growth Comparison by Product Type, 2025 to 2035
  • Figure 94: South Asia & Pacific Market Attractiveness Analysis by Product Type
  • Figure 95: South Asia & Pacific Market Value Share and BPS Analysis by Source, 2025 and 2035
  • Figure 96: South Asia & Pacific Market Y-o-Y Growth Comparison by Source, 2025 to 2035
  • Figure 97: South Asia & Pacific Market Attractiveness Analysis by Source
  • Figure 98: South Asia & Pacific Market Value Share and BPS Analysis by Packaging, 2025 and 2035
  • Figure 99: South Asia & Pacific Market Y-o-Y Growth Comparison by Packaging, 2025 to 2035
  • Figure 100: South Asia & Pacific Market Attractiveness Analysis by Packaging
  • Figure 101: South Asia & Pacific Market Value Share and BPS Analysis by Distribution Channel, 2025 and 2035
  • Figure 102: South Asia & Pacific Market Y-o-Y Growth Comparison by Distribution Channel, 2025 to 2035
  • Figure 103: South Asia & Pacific Market Attractiveness Analysis by Distribution Channel
  • Figure 104: Middle East and Africa Market Value Share and BPS Analysis by Country, 2025 and 2035
  • Figure 105: Middle East and Africa Market Value Share and BPS Analysis by Product Type, 2025 and 2035
  • Figure 106: Middle East and Africa Market Y-o-Y Growth Comparison by Product Type, 2025 to 2035
  • Figure 107: Middle East and Africa Market Attractiveness Analysis by Product Type
  • Figure 108: Middle East and Africa Market Value Share and BPS Analysis by Source, 2025 and 2035
  • Figure 109: Middle East and Africa Market Y-o-Y Growth Comparison by Source, 2025 to 2035
  • Figure 110: Middle East and Africa Market Attractiveness Analysis by Source
  • Figure 111: Middle East and Africa Market Value Share and BPS Analysis by Packaging, 2025 and 2035
  • Figure 112: Middle East and Africa Market Y-o-Y Growth Comparison by Packaging, 2025 to 2035
  • Figure 113: Middle East and Africa Market Attractiveness Analysis by Packaging
  • Figure 114: Middle East and Africa Market Value Share and BPS Analysis by Distribution Channel, 2025 and 2035
  • Figure 115: Middle East and Africa Market Y-o-Y Growth Comparison by Distribution Channel, 2025 to 2035
  • Figure 116: Middle East and Africa Market Attractiveness Analysis by Distribution Channel
  • Figure 117: Global Market - Tier Structure Analysis
  • Figure 118: Global Market - Company Share Analysis

Frequently Asked Questions

What is the projected size of the low fat drinks market in 2025?

The market size is valued at USD 80 million in 2025.

What is the outlook on low fat drinks demand by 2035?

The market is forecasted to reach USD 143.3 million by 2035, reflecting a CAGR of 6%.

Which product type leads the low fat drinks market in 2025?

Non-alcoholic drinks are expected to lead the market with a 80% share in 2025.

What is the projected share of bottles segment in the low fat drinks market by 2025?

Plant-based drinks are projected to hold a 50% share of the market in 2025.

Which country is projected to have the fastest-growing low fat drinks market?

The USA is anticipated to be the fastest-growing market with a CAGR of 8% from 2025 to 2035.

Explore Similar Insights

Future Market Insights

Low Fat Drinks Market