The low light imaging market is experiencing strong expansion, supported by the growing demand for high-quality imaging solutions across consumer, industrial, and security applications. Rapid advancements in sensor technology and image processing algorithms are enabling improved visibility in dark environments, creating wider adoption in smartphones, automotive cameras, surveillance systems, and medical imaging devices.
The increasing integration of AI-powered enhancement tools and machine learning models has further strengthened the effectiveness of low light cameras by improving clarity, reducing noise, and enhancing detail recognition under poor illumination. Rising consumer expectations for advanced imaging in smartphones, combined with the increasing use of cameras in autonomous vehicles and smart city surveillance networks, are driving sustained demand.
Market growth is also being fueled by increasing applications in healthcare imaging and defense systems, where precise visibility in challenging conditions is crucial As industries prioritize safety, security, and enhanced user experience, investments in low light imaging technologies are expected to accelerate, positioning the market for consistent growth in the coming decade with broader adoption across diverse verticals.
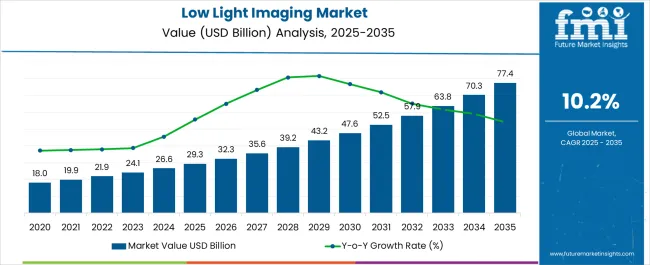
| Metric | Value |
|---|---|
| Low Light Imaging Market Estimated Value in (2025 E) | USD 29.3 billion |
| Low Light Imaging Market Forecast Value in (2035 F) | USD 77.4 billion |
| Forecast CAGR (2025 to 2035) | 10.2% |
The market is segmented by Technology, Application, and Vertical and region. By Technology, the market is divided into Complementary Metal Oxide Semiconductor and Charge Coupled Device. In terms of Application, the market is classified into Low Light Photography, Monitoring, Inspection And Detection, Scientific And Medical Imaging, and Security And Surveillance. Based on Vertical, the market is segmented into Consumer Electronics, Automotive, Medical And Life Sciences, and Military And Defense. Regionally, the market is classified into North America, Latin America, Western Europe, Eastern Europe, Balkan & Baltic Countries, Russia & Belarus, Central Asia, East Asia, South Asia & Pacific, and the Middle East & Africa.
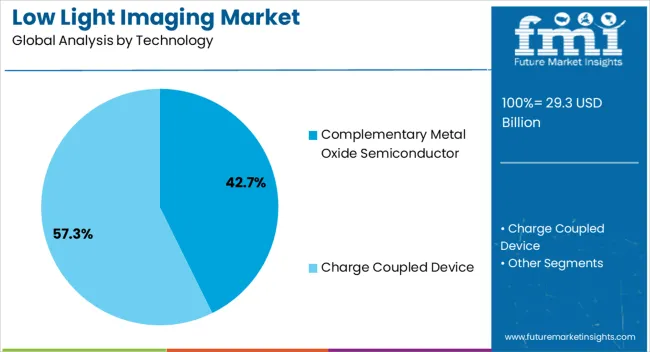
The complementary metal oxide semiconductor technology segment is projected to account for 42.7% of the low light imaging market revenue in 2025, establishing itself as the leading technology type. This dominance is being driven by the technology’s cost-effectiveness, low power consumption, and capability to deliver high-resolution images in compact formats. Smartphones and consumer cameras widely integrate complementary metal oxide semiconductors due to their scalability and ability to support advanced software-driven features such as computational photography.
Enhanced sensitivity in low light conditions, combined with faster readout speeds, has made these sensors a preferred choice for manufacturers aiming to improve user experiences. Their compatibility with AI-driven image processing further improves adaptability across applications including automotive, healthcare, and industrial surveillance.
The production advantages of complementary metal oxide semiconductors, including ease of mass manufacturing and integration with standard electronic circuits, have reinforced their market share As demand for affordable and high-quality low light imaging grows across industries, this technology segment is expected to maintain its leadership, supported by innovation and broad ecosystem adoption.
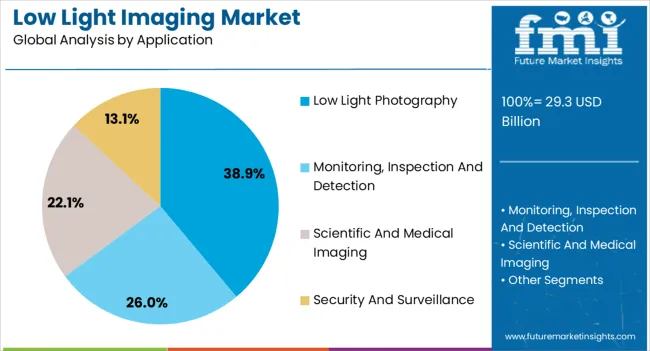
The low light photography application segment is expected to capture 38.9% of the market revenue in 2025, making it the leading application category. Increasing consumer demand for advanced photography features in smartphones, cameras, and wearable devices has been a major driver of this growth. With users prioritizing image quality in challenging lighting conditions, manufacturers are integrating advanced low light sensors and AI-based image optimization tools to improve clarity and sharpness.
The trend of social media sharing, content creation, and professional photography has further reinforced demand for superior low light capabilities. Continuous innovations in multi-frame image processing, noise reduction algorithms, and computational photography are transforming how devices handle poor lighting scenarios. Additionally, low light photography is gaining importance in industries such as event management, media production, and surveillance, where reliable performance in dark conditions is critical.
The ability to deliver high-quality visual output without additional hardware accessories such as external flash or lighting equipment is strengthening adoption As consumer and professional expectations evolve, low light photography is anticipated to remain a primary growth driver in the market.
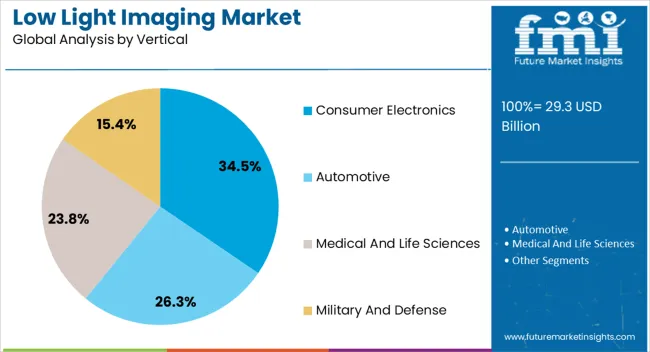
The consumer electronics segment is projected to hold 34.5% of the low light imaging market revenue in 2025, positioning it as the leading vertical. The rising integration of advanced imaging technologies in smartphones, tablets, laptops, and wearable devices is a key contributor to this growth. Consumers are increasingly demanding devices capable of delivering high-quality visuals even in dim environments, driven by use cases such as video calling, live streaming, gaming, and social media content creation.
Manufacturers are investing in sensors with higher sensitivity, advanced pixel architectures, and AI-powered software to meet these expectations. The growing popularity of smart home devices, augmented reality, and virtual reality platforms has further strengthened demand for enhanced imaging. Cost efficiency in semiconductor production is also allowing for broader adoption of advanced low light technologies in mid-range consumer devices.
As competition intensifies among consumer electronics brands, low light imaging capabilities have emerged as a critical differentiator in purchasing decisions This sustained demand across mass-market electronics ensures the vertical’s leading position in driving revenue within the low light imaging market.
The scope for low light imaging rose at a 12.2% CAGR between 2020 and 2025. The global market is achieving heights to grow at a moderate CAGR of 10.2% over the forecast period 2025 to 2035.
Factors such as the advancements in sensor technology, image processing algorithms as well as optical components had accelerated the market prospects during the historical period.
Integration in consumer electronics, coupled with the rise in automotive applications had also contributed to the market growth.
Developments in medical imaging and scientific research also augmented the demand for low light imaging.
The applications such as augmented reality and virtual reality, spatial computing, agricultural robotics, and industrial automation are the major factors influencing the demand for low light imaging, especially when they are successfully applied for such different applications.
The integration of machine learning and artificial intelligence together with low light imaging techniques is expected to make the imaging and identification of objects more precise, contributing to significant growth of the market.
The market is expected to accelerate, owing to the collaborations between the industry actors, such as technology companies, manufactures of sensors, and software companies, as well as end users, which is further scaling up the market growth.
The below table showcases revenues in terms of the top 5 leading countries, spearheaded by Korea and Japan. The countries will lead the market through 2035.
| Countries | Forecast CAGRs from 2025 to 2035 |
|---|---|
| The United States | 10.2% |
| The United Kingdom | 10.6% |
| China | 10.9% |
| Japan | 11.3% |
| Korea | 12.6% |
The low light imaging market in the United States will expand at a CAGR of 10.2% through 2035. The healthcare sector in the country is continuously adopting advanced imaging technologies for diagnosis, treatment, and surgical procedures.
Low light imaging technology, particularly in applications such as fluorescence guided surgery and endoscopy, is expected to witness increased adoption, contributing to market growth.
The United States has a significant demand for security and surveillance solutions across various sectors, including government, commercial, and residential. Low light imaging technology plays a crucial role in enhancing surveillance capabilities, especially in low-light conditions, driving market growth.
The low light imaging market in the United Kingdom to expand at a CAGR of 10.6% through 2035. The aerospace and defense industry in the country requires advanced imaging technologies for surveillance, reconnaissance, and military operations.
Low light imaging systems, such as night vision goggles, thermal imaging cameras, and surveillance drones, play a critical role in defense applications, contributing to market growth.
The United Kingdom is a significant market for automotive manufacturers, with a focus on improving vehicle safety standards. Low light imaging solutions, including night vision systems and advanced driver assistance systems, are essential for enhancing nighttime visibility and reducing accidents, driving market growth in the automotive sector.
Low light imaging trends in China are taking a turn for the better. A 10.9% CAGR is forecast for the country from 2025 to 2035. Government support and policies aimed at promoting technological innovation, supporting key industries, and addressing security challenges drive market growth in China.
Initiatives such as the Made in China 2025 plan and the National Defense Science and Technology Innovation Strategy prioritize the development of advanced imaging technologies, including low light imaging systems.
China is investing heavily in research and development initiatives to drive innovation and advancements in imaging technology. Chinese companies are developing cutting-edge low light imaging systems, including sensors, cameras, and image processing algorithms, fostering market growth and competitiveness.
The low light imaging market in Japan is poised to expand at a CAGR of 11.3% through 2035. Japan is a leader in robotics and automation technologies, with applications in manufacturing, healthcare, and service industries.
Low light imaging systems play a crucial role in robotic vision systems, enabling robots to operate effectively in low light environments, driving market growth in robotics and automation.
Japan has a large consumer electronics market, with a high demand for smartphones, digital cameras, and other imaging devices. Consumers increasingly prefer devices with improved low light imaging capabilities, such as night mode features and advanced camera sensors, driving market growth in the consumer electronics sector.
The low light imaging market in Korea will expand at a CAGR of 12.6% through 2035. Low light imaging technology finds applications in industrial inspection, quality control, and manufacturing processes.
Korea strong manufacturing base and emphasis on advanced production techniques drive the adoption of low light imaging systems for inspecting components, detecting defects, and ensuring product quality, contributing to market growth.
Korea is home to leading semiconductor manufacturers and suppliers, driving innovation and advancements in imaging sensor technology. The expansion of the semiconductor industry fosters the development of high-performance low light imaging sensors, supporting market growth in Korea and globally.
The below table highlights how CMOS segment is leading the market in terms of technology, and will account for a CAGR of 10.0% through 2035.
Based on form, the low light photography segment is gaining heights and will to account for a CAGR of 9.8% through 2035.
| Category | CAGR through 2035 |
|---|---|
| Complementary Metal Oxide Semiconductor | 10.0% |
| Low Light Photography | 9.8% |
Based on technology, the complementary metal oxide semiconductor segment will dominate the low light imaging market. CMOS sensors offer cost effective manufacturing processes and scalability, making them suitable for mass production and integration into various imaging devices.
Compared to other sensor technologies such as charge coupled devices, CMOS sensors are more economical to produce, resulting in lower overall system costs and broader market accessibility.
Advancements in CMOS sensor technology have led to significant improvements in sensitivity and signal to noise ratio, making CMOS sensors capable of capturing high-quality images even in low light conditions. The enhanced sensitivity enables better image quality and visibility, driving the adoption of CMOS based low light imaging solutions.
In terms of application, the low light photography segment will dominate the low light imaging market. Smartphone manufacturers are continuously improving camera technology to meet consumer expectations for better low light photography.
Advancements such as larger pixel sizes, wider aperture lenses, optical image stabilization, and advanced image processing algorithms enable smartphones to capture clearer and more detailed photos in challenging lighting conditions, driving market growth.
Consumers demand better low light performance in their devices, with the increasing popularity of smartphone photography and social media sharing. The ability to capture high-quality photos in low light conditions, such as indoors or at night, has become a key selling point for smartphones and digital cameras, driving market demand for low light imaging solutions.
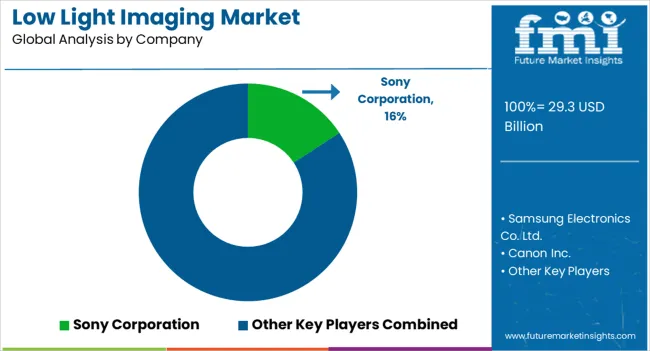
A deep dive in the competitive landscape of the low light imaging market states that the industry is burgeoning and giants are working day in and out to achieve goals and to stand out unique in the queue.
Company Portfolio
| Attribute | Details |
|---|---|
| Estimated Market Size in 2025 | USD 26.6 billion |
| Projected Market Valuation in 2035 | USD 70.0 billion |
| Value-based CAGR 2025 to 2035 | 10.2% |
| Forecast Period | 2025 to 2035 |
| Historical Data Available for | 2020 to 2025 |
| Market Analysis | Value in USD Billion |
| Key Regions Covered | North America; Latin America; Western Europe; Eastern Europe; South Asia and Pacific; East Asia; The Middle East & Africa |
| Key Market Segments Covered | Technology, Application, Vertical, Region |
| Key Countries Profiled | The United States, Canada, Brazil, Mexico, Germany, France, France, Spain, Italy, Russia, Poland, Czech Republic, Romania, India, Bangladesh, Australia, New Zealand, China, Japan, South Korea, GCC countries, South Africa, Israel |
| Key Companies Profiled | Sony Corporation; Samsung Electronics Co. Ltd.; Omnivision Technologies Inc.; ON Semiconductor Corporation; STMicroelectronics N.V.; Panasonic Holdings Corporation; Canon Inc.; PixArt Imaging Inc.; Hamamatsu Photonics K.K.; Teledyne Technologies Incorporated |
The global low light imaging market is estimated to be valued at USD 29.3 billion in 2025.
The market size for the low light imaging market is projected to reach USD 77.4 billion by 2035.
The low light imaging market is expected to grow at a 10.2% CAGR between 2025 and 2035.
The key product types in low light imaging market are complementary metal oxide semiconductor and charge coupled device.
In terms of application, low light photography segment to command 38.9% share in the low light imaging market in 2025.


Our Research Products

The "Full Research Suite" delivers actionable market intel, deep dives on markets or technologies, so clients act faster, cut risk, and unlock growth.

The Leaderboard benchmarks and ranks top vendors, classifying them as Established Leaders, Leading Challengers, or Disruptors & Challengers.

Locates where complements amplify value and substitutes erode it, forecasting net impact by horizon

We deliver granular, decision-grade intel: market sizing, 5-year forecasts, pricing, adoption, usage, revenue, and operational KPIs—plus competitor tracking, regulation, and value chains—across 60 countries broadly.

Spot the shifts before they hit your P&L. We track inflection points, adoption curves, pricing moves, and ecosystem plays to show where demand is heading, why it is changing, and what to do next across high-growth markets and disruptive tech

Real-time reads of user behavior. We track shifting priorities, perceptions of today’s and next-gen services, and provider experience, then pace how fast tech moves from trial to adoption, blending buyer, consumer, and channel inputs with social signals (#WhySwitch, #UX).

Partner with our analyst team to build a custom report designed around your business priorities. From analysing market trends to assessing competitors or crafting bespoke datasets, we tailor insights to your needs.
Supplier Intelligence
Discovery & Profiling
Capacity & Footprint
Performance & Risk
Compliance & Governance
Commercial Readiness
Who Supplies Whom
Scorecards & Shortlists
Playbooks & Docs
Category Intelligence
Definition & Scope
Demand & Use Cases
Cost Drivers
Market Structure
Supply Chain Map
Trade & Policy
Operating Norms
Deliverables
Buyer Intelligence
Account Basics
Spend & Scope
Procurement Model
Vendor Requirements
Terms & Policies
Entry Strategy
Pain Points & Triggers
Outputs
Pricing Analysis
Benchmarks
Trends
Should-Cost
Indexation
Landed Cost
Commercial Terms
Deliverables
Brand Analysis
Positioning & Value Prop
Share & Presence
Customer Evidence
Go-to-Market
Digital & Reputation
Compliance & Trust
KPIs & Gaps
Outputs
Full Research Suite comprises of:
Market outlook & trends analysis
Interviews & case studies
Strategic recommendations
Vendor profiles & capabilities analysis
5-year forecasts
8 regions and 60+ country-level data splits
Market segment data splits
12 months of continuous data updates
DELIVERED AS:
PDF EXCEL ONLINE
Low Alloy Steels Powder Market Size and Share Forecast Outlook 2025 to 2035
Low Alkali Cement Market Size and Share Forecast Outlook 2025 to 2035
Low Vibration Thermostat Market Size and Share Forecast Outlook 2025 to 2035
Low-Level Order Picker Pallet Truck Market Size and Share Forecast Outlook 2025 to 2035
Low Voltage Components Market Size and Share Forecast Outlook 2025 to 2035
Low Temperature Flexible Tester Market Size and Share Forecast Outlook 2025 to 2035
Low Density Polyethylene Market Forecast and Outlook 2025 to 2035
Low-Temperature Cable Market Size and Share Forecast Outlook 2025 to 2035
Low Molecular Weight Chondroitin Sulfate Sodium Market Size and Share Forecast Outlook 2025 to 2035
Low Temperature Radiators Market Size and Share Forecast Outlook 2025 to 2035
Low Rolling Resistance Tire Market Size and Share Forecast Outlook 2025 to 2035
Low Temperature Commercial Boiler Market Size and Share Forecast Outlook 2025 to 2035
Low Emissivity Film Market Size and Share Forecast Outlook 2025 to 2035
Low Voltage Residential Switchgear Market Size and Share Forecast Outlook 2025 to 2035
Low Voltage Substation Market Size and Share Forecast Outlook 2025 to 2035
Low Migration Inks Market Size and Share Forecast Outlook 2025 to 2035
Low Voltage Distribution Panel Market Size and Share Forecast Outlook 2025 to 2035
Low Voltage Surge Arrester Market Size and Share Forecast Outlook 2025 to 2035
Low Density Polyethylene Packaging Market Size and Share Forecast Outlook 2025 to 2035
Low Temperature Insulation Materials Market Size and Share Forecast Outlook 2025 to 2035

Thank you!
You will receive an email from our Business Development Manager. Please be sure to check your SPAM/JUNK folder too.
Chat With
MaRIA