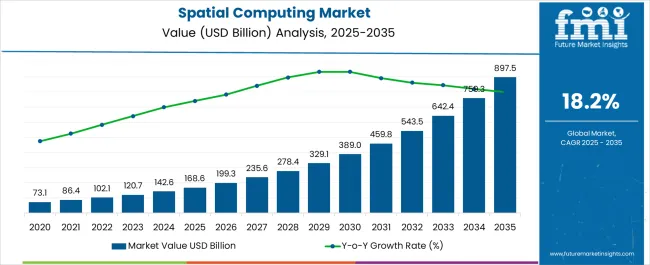
The Spatial Computing Market is estimated to be valued at USD 168.6 billion in 2025 and is projected to reach USD 897.5 billion by 2035, registering a compound annual growth rate (CAGR) of 18.2% over the forecast period.
| Metric | Value |
|---|---|
| Spatial Computing Market Estimated Value in (2025 E) | USD 168.6 billion |
| Spatial Computing Market Forecast Value in (2035 F) | USD 897.5 billion |
| Forecast CAGR (2025 to 2035) | 18.2% |
The spatial computing market is experiencing accelerated growth driven by advancements in 3D perception, AI integration, and cross-industry adoption of immersive technologies. Enterprises across manufacturing, healthcare, architecture, and retail are investing in spatial computing systems to bridge the physical-digital divide through real-time interaction, simulation, and spatial mapping.
Continued convergence of sensor fusion, edge computing, and computer vision is enabling more responsive and context-aware systems, enhancing productivity and operational safety. Enterprise demand for precise, scalable mixed reality environments has led to rising R&D investments and strategic alliances among device manufacturers and software platform providers.
The shift toward remote collaboration, autonomous navigation, and immersive training experiences is further expanding application potential. Looking ahead, growth is expected to be reinforced by miniaturization of spatial sensors, standardization of development platforms, and increased integration of spatial computing into digital twin and smart environment strategies.
The market is segmented by Component, Technology, Application, and Industry and region. By Component, the market is divided into Spatial Computing Devices, Computing Software Solutions, and Services. In terms of Technology, the market is classified into Augmented Reality, Mixed Reality, and Virtual Reality. Based on Application, the market is segmented into Design and manufacturing, Entertainment, Meetings and interaction, Logistics, and Others. By Industry, the market is divided into Healthcare, BFSI, Government & Public Sector, IT & Telecom, Travel & Hospitality, Retail, Energy & Utilities, Manufacturing, Education, and Others. Regionally, the market is classified into North America, Latin America, Western Europe, Eastern Europe, Balkan & Baltic Countries, Russia & Belarus, Central Asia, East Asia, South Asia & Pacific, and the Middle East & Africa.
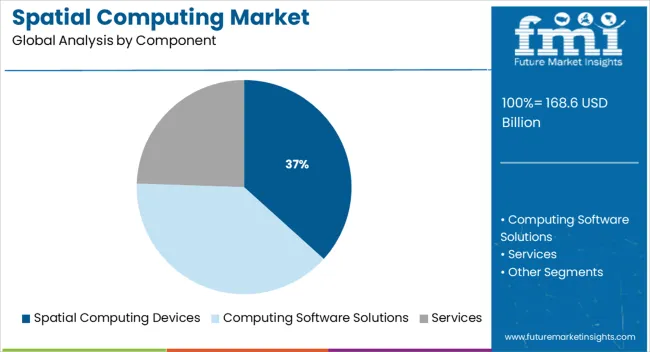
Spatial computing devices are anticipated to account for 36.7% of total market revenue in 2025, positioning them as the leading component segment. This lead is being supported by rising demand for high-performance headsets, smart glasses, LiDAR-enabled mobile devices, and spatial sensors that enable real-time environment mapping and interaction.
The segment’s momentum is also reinforced by rapid hardware innovation focused on ergonomic design, reduced latency, and integrated AI chips for on-device processing. Industrial and commercial buyers are prioritizing edge-capable devices for field applications, contributing to broader deployment in manufacturing, healthcare, and logistics.
As spatial computing expands beyond labs into operational environments, hardware form factors with high compute density and multi-modal sensing are driving adoption at scale.
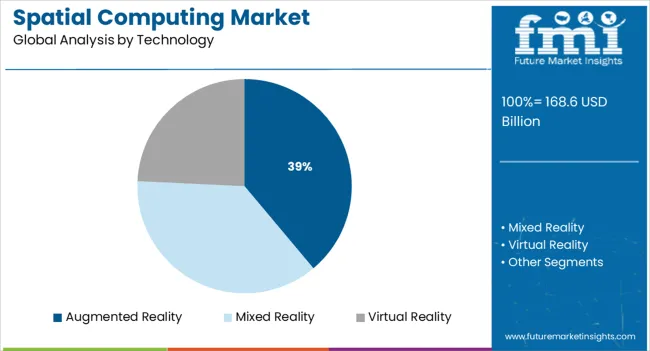
Augmented reality (AR) technology is projected to lead the market with a 38.9% revenue share in 2025. Its leadership is being fueled by strong adoption across industrial design, maintenance, retail engagement, and training simulations.
AR’s ability to overlay actionable digital content onto real-world settings has improved productivity, accuracy, and user experience across various workflows. Increased support from operating systems, chipset providers, and enterprise software platforms has accelerated development and deployment cycles.
The evolution of markerless AR, spatial anchors, and persistent content is enhancing user immersion, which is crucial in engineering, visualization, and field support tasks. As businesses embrace remote operations and real-time contextual assistance, AR is expected to maintain its edge as the most deployable and intuitive spatial computing technology.
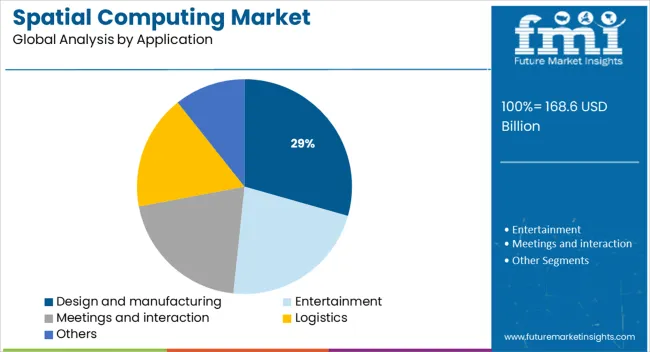
The design and manufacturing segment is expected to capture 29.4% of total market revenue in 2025, making it the dominant application area for spatial computing. Growth in this segment is being driven by the need for immersive prototyping, simulation-based optimization, and collaborative design reviews that reduce cycle times and rework costs.
Spatial computing tools are increasingly being integrated into CAD workflows, enabling engineers to interact with models at full scale and in real-world context. Manufacturing operations are leveraging spatial insights to improve precision, automate inspections, and enhance worker guidance systems.
As digital twins and smart factory models gain traction, spatial computing is providing the real-time spatial awareness necessary for high-precision production environments. The convergence of IoT, robotics, and AR is expected to further strengthen adoption in design-driven industrial ecosystems.
The spatial computing market is estimated to grow at a CAGR of 18.2% over the forecast period 2025 to 2035 compared to the 2020 to 2024 CAGR of 16.1%.
Spatial computing is a new concept altogether, and the technologies that allowed users to implement augmented reality and virtual reality were either expensive or in a trial and testing phase.
Companies had just recently introduced virtual reality solutions and services, two of the prime examples being video streaming platforms and video game companies, but neither the quality of which was being offered by the video game companies for their VR was not at the level which was envisioned or the 2D form of video streaming still remained popular.
However, the 2025 to 2035 forecast period is estimated to witness staggering growth for the spatial computing market, the primary reasons being the discovery of the numerous applications of spatial computing for various industrial purposes and the metaverse. The prices of VR headsets have dropped over the past few years, allowing more people to get their hands on this technology and be introduced to spatial computing.
The introduction of the metaverse has also encouraged numerous companies to create their own different versions of the metaverse for various purposes. Mental health professionals have also started using virtual reality exposure therapy (VERT) to treat patients with trauma, expanding the use of spatial computing.
Companies and universities are implementing spatial computing solutions to train and educate their employees and students better. Spatial computing allows the users to be immersed in a virtual environment and the help of audio-video sensors and other tools like joysticks could help them interact better with this virtual environment.
Apart from the virtual environment, spatial computing can be used for creating 3D models which could help users visualize and understand complicated concepts and topics and much better this can benefit students and employees who are trying to upskill themselves or learn a subject.
North America is estimated to have the largest market share over the forecast period and held the largest market share of 28.6% in 2024, while South Asia and the Pacific are estimated to have the highest growth rate over the forecast period with a CAGR of 23.8%.
North America was the first region to introduce the metaverse to the public, allowing the spatial computing market to grow in North America. The implementation of spatial computing solutions for industrial purposes has also begun in this region, and the presence of key players in the spatial computing market allows this region to be a strong market for the spatial computing market.
South Asia and the Pacific region are estimated to be the fastest growing because of the large population, internet penetration, and a much younger population that can be attracted to this form of technology and metaverse.
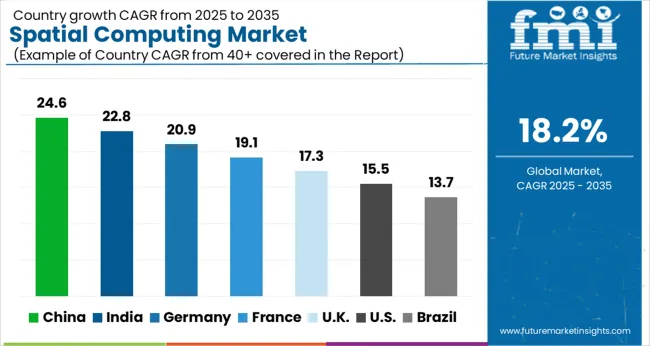
Since the US and Canada were the first countries to be introduced to the metaverse, the users of spatial computing technologies also witnessed growth in this country. Companies that offer spatial computing solutions are implementing technological updates to improve the metaverse experience and allow spatial computing technologies to be used for various different industrial purposes.
With a large chunk of the population involved in gaming, this can also allow the spatial computing market to grow in this country since gaming is one of the important applications for spatial computing.
Over the past year, large companies based in India have been implementing spatial computing solutions for various purposes. such as advertising with the help of virtual reality and setting up virtual environments for numerous business and transactional purposes.
One of the applications of spatial computing which can also be discovered by these developments is that spatial computing can allow work and transactions which require in-person presence, like purchasing a car or house, to be done remotely, as well as numerous other activities.
These forms of transactions and activities are not meant to replace their physical counterparts, but can definitely increase the inflow of customers to any particular dealer, market, or company.
Companies in Germany are developing spatial computing solutions and services which could be used for numerous industrial purposes. These purposes extend to healthcare, manufacturing, designing, gaming, work-from-home, and consumer solutions.
Allowing users to implement augmented and mixed reality to understand what kinds of shoes or clothes will be the right match for them or allowing manufacturers to visualize elements naked to the human eye, like airflow, to better understand what design changes they need to make to their automobiles are examples of the developments occurring in Germany regarding spatial computing.
Spatial computing is a new technology that is still in its developing stages, the technology that is needed for implementing spatial computing is not yet widely available among a wider group of people. This technology holds the potential to become a technology that could go on to become something that is as important as smartphones and personal computers eventually.
Capital investment is necessary for this market since the hardware needs to be made available for performing various tasks, both consumer and professional.
North America has two countries Canada and USA, both with similar economic conditions, therefore, the revenue volatility is not an impactful factor, there is a high scope for industrial applications, however, part of the population is skeptical of spatial computing technologies.
Latin America has large economic differences between countries causing wide revenue volatility. Mexico and Brazil can be good marketplaces for spatial computing, internet penetration in this region is rising which could complement growth for spatial computing in this region.
Europe has numerous countries with several countries under the same economic conditions, industrial applications are growing at a quick rate in this region. Due to several countries being large economies in this region, Europe can become a large marketplace for spatial computing market, several start-ups have already begun their operations in this region.
South Asia and the Pacific have high revenue volatility due to economic differences between the economies. There is a wide population that is looking forward to implementing the metaverse technology which further raises the scope for spatial computing technologies, numerous regulatory factors could come into play considering the regulations which have been applied to new technologies in the past. Numerous languages are spoken in this region, which could grow the scope of differentiation as vernacular content could be preferred.
East Asia is a large market and the companies and consumers implement technologies at a quick rate, large population also allows the market for consumer spatial computing products to grow, manufacturing industry is well established in this region which could act as a strong marketplace for the spatial computing market.
Middle East and Africa have high revenue volatility; however, internet penetration is increasing in these countries. Distinct industries in the region could raise the scope for differentiation.
The software solutions allow the spatial computing solutions to completely leverage the spatial computing solutions.
The importance of smartphone applications for smartphone devices is the best analogy to explain the importance of software solutions for spatial computing. Various video games and metaverse are examples of this software and can even drive manufacturers to make hardware changes to their spatial computing devices.
In order for spatial computing technologies to be successful, the programs and applications that are developed for them need to be of high quality as well, allowing programming and development for spatial computing to rapidly grow and improve as well.
For these reasons, computing software solutions are estimated to grow at a CAGR of 20.2% over the forecast period.
One of the foundational motivations of spatial computing is to replace the 2D-based computing that exists in today’s day and age with the 3D form of computing that is made possible by spatial computing technologies.
Mixed reality can allow virtual and interactive objects to be placed around the user’s environment, which only the user or specific users can interact with via their spatial computing gear. This technology can allow work-from-home to become more efficient and even allow enterprises to shift certain operations and tasks completely to a virtual environment.
Mixed reality can improve the process of manufacturing and design for numerous industries, and this technology can also be used for the purpose of developing certain games specific to the environment created by mixed reality technology.
For these reasons, mixed reality is estimated to grow at a CAGR of 21.3% for the forecast period.
Due to the development of the metaverse, spatial computing became a technology with which consumers wanted to interact more in 2025. Certain companies are developing their own virtual environments, which could act as a marketplace for numerous purposes, and even companies have started implementing spatial computing solutions and metaverse to allow team meetings.
One of the primary reasons people use Metaverse today is to interact with different people from various backgrounds or with people having similar interests.
In the future, there could be a possibility that there will be an integration between real meetings and meetings being fluctuated by spatial computing.
Healthcare and medicine can see vast benefits by implementing spatial computing solutions. Creating models for the practice of surgeries and operations could help surgeons and students develop their skills and knowledge for their medical practices. This can reduce the risk of causing damage to patients and cadavers.
For this reason, the healthcare sector is estimated to witness the highest CAGR for the forecast period of 24.2%.
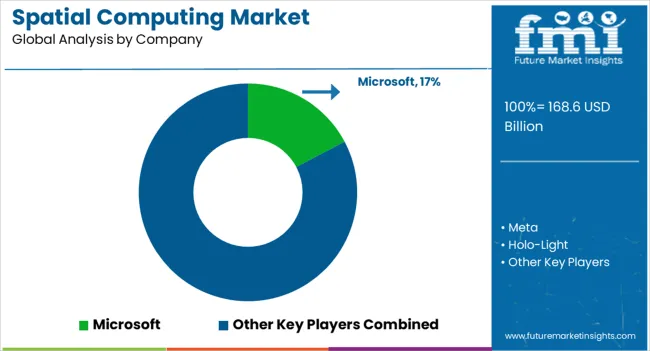
Companies with technical expertise in artificial intelligence, machine learning, augmented, virtual, and mixed realities, and cloud computing could maximize the quality of their spatial computing offerings. Companies are either dedicated to developing their business functions, developing the technologies for spatial computing, or developing the software and applications that are run on spatial computing technologies.
| Attributes | Details |
|---|---|
| Market value in 2024 | USD 168.6 billion |
| Market CAGR 2025 to 2035 | 18.2% |
| Share of top 5 players | Around 40% |
| Forecast Period | 2025 to 2035 |
| Historical Data Available for | 2020 to 2024 |
| Market Analysis | USD Billion for Value |
| Key Regions Covered | North America; Latin America; Europe; South Asia & Pacific; East Asia; and the Middle East & Africa (MEA) |
| Key Countries Covered | USA, Canada, Germany, UK, France, Italy, Spain, Russia, China, Japan, South Korea, India, Australia & New Zealand, GCC Countries, Turkey, and South Africa |
| Key Segments Covered | Component, Technology, Application, Industry and Region |
| Key Companies Profiled | Meta; Holo-Light; PTC; Microsoft; Google; Sony; 4Experience; Magic Leap; Vuzix; InfiVR; CitrusBits; Apple |
| Report Coverage | Market Forecast, Company Share Analysis, Competition Intelligence, DROT Analysis, Market Dynamics and Challenges, and Strategic Growth Initiatives |
| Customization & Pricing | Available upon Request |
The global spatial computing market is estimated to be valued at USD 168.6 billion in 2025.
The market size for the spatial computing market is projected to reach USD 897.5 billion by 2035.
The spatial computing market is expected to grow at a 18.2% CAGR between 2025 and 2035.
The key product types in spatial computing market are spatial computing devices, _vr headsets, _ar glasses, _hybrid gear, computing software solutions, services, _integration and deployment services, _support & maintenance and _consulting services.
In terms of technology, augmented reality segment to command 38.9% share in the spatial computing market in 2025.


Full Research Suite comprises of:
Market outlook & trends analysis
Interviews & case studies
Strategic recommendations
Vendor profiles & capabilities analysis
5-year forecasts
8 regions and 60+ country-level data splits
Market segment data splits
12 months of continuous data updates
DELIVERED AS:
PDF EXCEL ONLINE
Spatial Mass Spectrometry Market Size and Share Forecast Outlook 2025 to 2035
Spatial Light Modulator Market Analysis - Growth, Demand & Forecast 2025 to 2035
Geospatial Imagery Analytics Market Size and Share Forecast Outlook 2025 to 2035
Geospatial Solution Market Analysis - Size, Share, and Forecast Outlook for 2025 to 2035
Geospatial Analytics Market Growth – Trends & Forecast through 2034
Sequencing and Spatial Omics Platform Market Size and Share Forecast Outlook 2025 to 2035
Fog Computing Market
Brain Computing Interfaces Market Size and Share Forecast Outlook 2025 to 2035
Swarm Computing Market Size and Share Forecast Outlook 2025 to 2035
Cloud Computing Market Size and Share Forecast Outlook 2025 to 2035
Visual Computing Market Size and Share Forecast Outlook 2025 to 2035
Mobile Computing Devices Market Insights – Growth & Forecast 2023-2033
Central Computing Architecture Vehicle OS Market Forecast and Outlook 2025 to 2035
Quantum Computing Market Growth – Trends & Forecast 2025 to 2035
Wearable Computing Market Trends – Growth & Forecast 2025 to 2035
Wearable Computing Devices Market Analysis - Size, Share & Forecast 2025 to 2035
Affective Computing Market Size and Share Forecast Outlook 2025 to 2035
Cognitive Computing Market Size and Share Forecast Outlook 2025 to 2035
Pervasive Computing Technology Market Size and Share Forecast Outlook 2025 to 2035
Server Less Computing Market Size and Share Forecast Outlook 2025 to 2035

Thank you!
You will receive an email from our Business Development Manager. Please be sure to check your SPAM/JUNK folder too.
Chat With
MaRIA