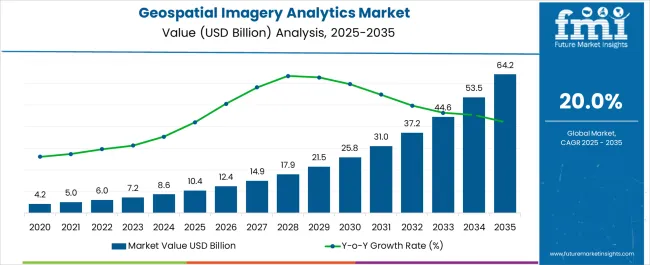
The Geospatial Imagery Analytics Market is estimated to be valued at USD 10.4 billion in 2025 and is projected to reach USD 64.2 billion by 2035, registering a compound annual growth rate (CAGR) of 20.0% over the forecast period.
| Metric | Value |
|---|---|
| Geospatial Imagery Analytics Market Estimated Value in (2025 E) | USD 10.4 billion |
| Geospatial Imagery Analytics Market Forecast Value in (2035 F) | USD 64.2 billion |
| Forecast CAGR (2025 to 2035) | 20.0% |
The geospatial imagery analytics market is expanding rapidly due to rising demand for location intelligence, urban planning, disaster management, and defense applications. Increasing reliance on high resolution satellite and aerial imagery, combined with the integration of artificial intelligence and machine learning, is enhancing the accuracy and predictive power of geospatial analysis.
Governments and enterprises are investing heavily in infrastructure monitoring, climate change assessment, and smart city development, further accelerating adoption. The shift toward real time analytics is being enabled by advancements in cloud computing, big data platforms, and edge processing.
Additionally, the growing role of geospatial technologies in commercial sectors such as retail, logistics, and agriculture is creating new growth avenues. The outlook remains strong as organizations prioritize data driven decision making and resource optimization through advanced imagery analytics.
The market is segmented by Analytics Type, Deployment Model, Collection Medium, and Application and region. By Analytics Type, the market is divided into Image-based Analytics and Video-based Analytics. In terms of Deployment Model, the market is classified into On-premises and Cloud. Based on Collection Medium, the market is segmented into Geographic Information System (GIS), Satellite Imagery, and UAV. By Application, the market is divided into Agriculture, Construction, Mining, Oil & Gas, Telecom, Government, and Transportation & Logistics. Regionally, the market is classified into North America, Latin America, Western Europe, Eastern Europe, Balkan & Baltic Countries, Russia & Belarus, Central Asia, East Asia, South Asia & Pacific, and the Middle East & Africa.
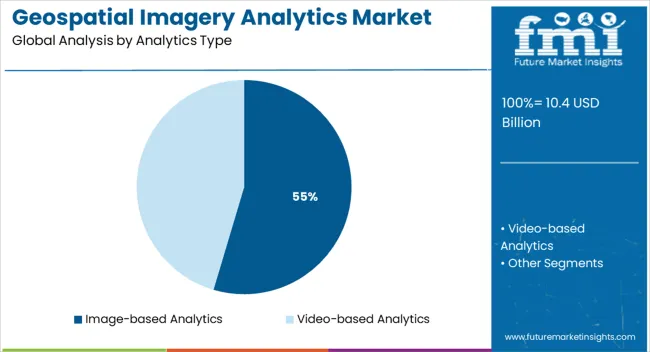
The image based analytics segment is projected to account for 54.60% of total market revenue by 2025 within the analytics type category, establishing it as the leading segment. Its dominance is attributed to the ability to extract actionable insights directly from high resolution satellite, drone, and aerial images.
Enhanced image recognition algorithms, supported by artificial intelligence, have improved classification accuracy, enabling more precise land use mapping, infrastructure monitoring, and environmental assessment. Industries are increasingly valuing visual based intelligence for real time decision making, particularly in urban development and defense.
As adoption expands across multiple sectors, image based analytics continues to strengthen its position as the cornerstone of geospatial analytics.
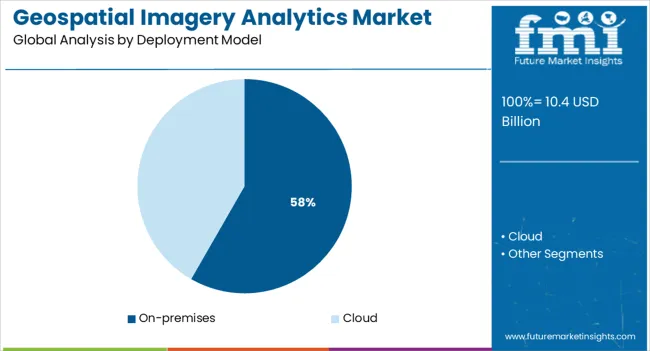
The on premises deployment model is expected to contribute 58.30% of overall market revenue by 2025, positioning it as the dominant deployment approach. This preference is being reinforced by the need for data security, privacy, and compliance with government and defense regulations.
Organizations managing sensitive geospatial data such as defense agencies, energy utilities, and environmental regulators rely heavily on secure, in house systems to ensure controlled access. The ability to customize infrastructure, maintain operational continuity without internet dependence, and meet strict compliance requirements has further solidified on premises deployment.
Despite the rise of cloud platforms, the critical nature of geospatial data continues to sustain the leadership of on premises solutions.
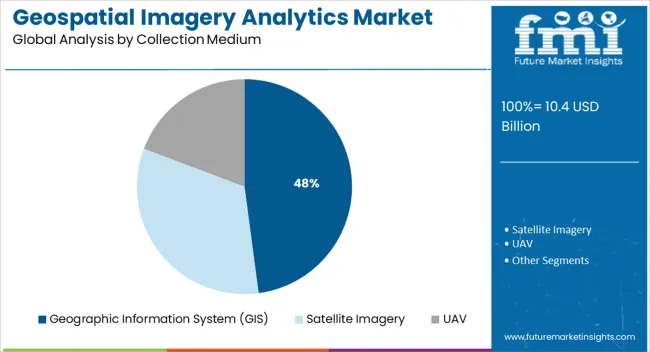
The geographic information system collection medium is anticipated to hold 47.90% of market revenue by 2025, making it the most significant collection medium. GIS platforms provide comprehensive tools to capture, store, analyze, and visualize geospatial data in ways that support strategic planning and operational efficiency.
The integration of GIS with satellite imagery, drones, and IoT sensors has expanded its applicability across industries including agriculture, logistics, and public safety. Its role in enabling multi layered analysis and data visualization has made it indispensable for urban planning and environmental monitoring.
With its capacity to transform raw imagery into actionable intelligence, GIS continues to be the preferred collection medium, reinforcing its leadership in the market.
In contrast to the 12.5% CAGR observed between 2020 and 2025, the demand for geospatial imagery analytics is anticipated to record a CAGR of 20.00% between 2025 and 2035. Geographic information system firms are providing both existing and new data to the telecommunications industry with the aid of technologically advanced 5G networks.
The government sector is one area where geospatial imaging analytics are widely used. Technology plays a significant role in government initiatives related to urban development, property identification, agricultural protection, monitoring of geographical regions, and climate change.
Government decisions regarding crisis management, boundary management, population management, planning for green spaces, public works projects, controlling wildfires, security, and law enforcement, strategy development, emergency management, evacuation action plans, etc. are all supported by geospatial imagery analytics. The worldwide geospatial imagery analytics market is being driven by the broad range of applications in the government sector.
The geospatial imagery analytics market is also being driven by the enterprises' increased requirement for GIS services to discover customer preferences and boost sales in the targeted demography. Geospatial imaging analytics are being used by businesses to direct their decision-making.
The increasing demand for geospatial imaging analytics, rising disposable incomes, and rapid advancements in analytics technology are the main drivers of this market's expansion. Geospatial imagery analytics is projected to have and high demand in the future analytics market. In coming years, the demand for geospatial imagery analytics has improved among organizations, as it supports pathway changes in patterns and trends over a period.
The technological developments in geospatial imagery analytics have increased the acceptance of geospatial technologies including Remote Sensing (RS), a Global Positioning System (GPS), a Geographical Information System (GIS), and many others.
Also, increasing penetration of geographical information system technology in the service industry, increasing usage of location-based data, and rising demand for open interoperable solutions, are significant factors that are boosting the growth of the geospatial imagery analytics market.
As satellite technology has improved to the point that satellites can now take high-resolution photographs, the imagery analytics category dominated the market in 2024 with a market share of roughly 74.5%. These systems record image-based geographic data as raster and vector images, which contain lines, points, and tabular graphics. These detailed images are proven to be priceless tools for geospatial analysis and modeling.
Many mining businesses are emphasizing generating more value out of their planning, mining, and data processing operations to make informed strategic decisions. One example of this is the use of geospatial imaging analytics to gain a deeper understanding of mining operations.
Defense organizations employ geographic information systems in several ways, including the charting and mapping of all military actions and plans to assist in their decision-making. The administration of the defense estate can benefit greatly from GIS. One of the key benefits of using a geographic information system for managing military bases is that it makes it easier to manage and maintain all of the bases' inventories. Therefore, geospatial imagery analytics' benefits are spurring demand in this market.
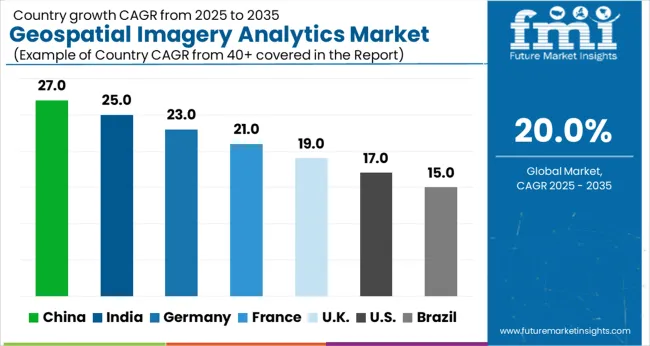
China, South Korea, and India are setting the standard for developing 5G and IoT infrastructure, the demand for smart cities, smart infrastructure, and well-planned urban population has increased as a result of this expansion. The market in Asia Pacific is expected to expand throughout the forecast period as a result of these factors.
This was due to an increase in regional spending on new satellite systems. For instance, the federal government in Canada committed around USD 4.2 million in December 2020 as part of its support for the International Space Station (ISS) to open the door for the advancement of innovative space robotics technology.
UAVs are widely used in the region in the construction, agricultural, disaster management, and government sectors. Defense and intelligence organizations are likewise embracing a variety of GIS-based technologies due to the crucial function that spatial data plays in these organizations. The agencies can utilize this data to make more rapid and precise decisions about missions related to national security.
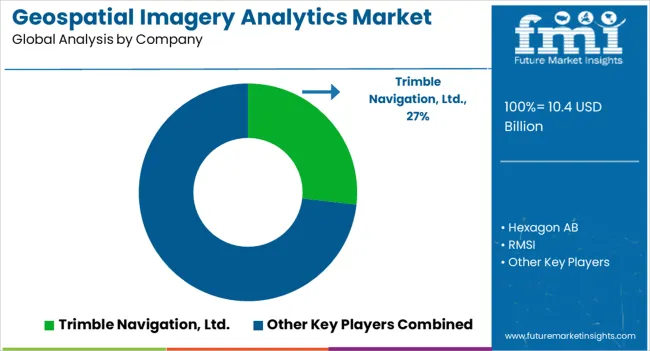
To strengthen their market positions in the worldwide geospatial imagery analytics market, the top players are currently focusing on implementing tactics like adopting new technology, product innovations, mergers and acquisitions, joint ventures, alliances, and collaborations. There have been some significant market developments.
Some of the Key Players Operating in the Market Include:
Latest Developments in the Market
| Attribute | Details |
|---|---|
| Growth Rate | CAGR of 20.00% from 2025 to 2035 |
| Base Year of Estimation | 2025 |
| Historical Data | 2020 to 2025 |
| Forecast Period | 2025 to 2035 |
| Quantitative Units | Revenue in USD billion and Volume in Units and F-CAGR from 2025 to 2035 |
| Report Coverage | Revenue Forecast, Volume Forecast, Company Ranking, Competitive Landscape, Growth Factors, Trends, and Pricing Analysis |
| Key Segments Covered | Analytics Type, Deployment Model, Collection Medium, Application, By Region |
| Regions Covered | North America; Latin America; Europe; East Asia; South Asia; The Middle East & Africa; Oceania |
| Key Countries Profiled | United States, Canada, Brazil, Mexico, Germany, Italy, France, United Kingdom, Spain, Russia, China, Japan, India, GCC Countries, Australia |
| Key Companies Profiled | Trimble Navigation, Ltd.; Hexagon AB; General Electric; RMSI, Bentley Systems, Inc.; ESRI, MDA Corporation; Fugro N.V.; Harris Corporation; WS Atkins Plc.; TomTom; Digital Globe; Critigen, AAM; Nokia |
| Customization & Pricing | Available upon Request |
The global geospatial imagery analytics market is estimated to be valued at USD 10.4 billion in 2025.
The market size for the geospatial imagery analytics market is projected to reach USD 64.2 billion by 2035.
The geospatial imagery analytics market is expected to grow at a 20.0% CAGR between 2025 and 2035.
The key product types in geospatial imagery analytics market are image-based analytics and video-based analytics.
In terms of deployment model, on-premises segment to command 58.3% share in the geospatial imagery analytics market in 2025.


Our Research Products

The "Full Research Suite" delivers actionable market intel, deep dives on markets or technologies, so clients act faster, cut risk, and unlock growth.

The Leaderboard benchmarks and ranks top vendors, classifying them as Established Leaders, Leading Challengers, or Disruptors & Challengers.

Locates where complements amplify value and substitutes erode it, forecasting net impact by horizon

We deliver granular, decision-grade intel: market sizing, 5-year forecasts, pricing, adoption, usage, revenue, and operational KPIs—plus competitor tracking, regulation, and value chains—across 60 countries broadly.

Spot the shifts before they hit your P&L. We track inflection points, adoption curves, pricing moves, and ecosystem plays to show where demand is heading, why it is changing, and what to do next across high-growth markets and disruptive tech

Real-time reads of user behavior. We track shifting priorities, perceptions of today’s and next-gen services, and provider experience, then pace how fast tech moves from trial to adoption, blending buyer, consumer, and channel inputs with social signals (#WhySwitch, #UX).

Partner with our analyst team to build a custom report designed around your business priorities. From analysing market trends to assessing competitors or crafting bespoke datasets, we tailor insights to your needs.
Supplier Intelligence
Discovery & Profiling
Capacity & Footprint
Performance & Risk
Compliance & Governance
Commercial Readiness
Who Supplies Whom
Scorecards & Shortlists
Playbooks & Docs
Category Intelligence
Definition & Scope
Demand & Use Cases
Cost Drivers
Market Structure
Supply Chain Map
Trade & Policy
Operating Norms
Deliverables
Buyer Intelligence
Account Basics
Spend & Scope
Procurement Model
Vendor Requirements
Terms & Policies
Entry Strategy
Pain Points & Triggers
Outputs
Pricing Analysis
Benchmarks
Trends
Should-Cost
Indexation
Landed Cost
Commercial Terms
Deliverables
Brand Analysis
Positioning & Value Prop
Share & Presence
Customer Evidence
Go-to-Market
Digital & Reputation
Compliance & Trust
KPIs & Gaps
Outputs
Full Research Suite comprises of:
Market outlook & trends analysis
Interviews & case studies
Strategic recommendations
Vendor profiles & capabilities analysis
5-year forecasts
8 regions and 60+ country-level data splits
Market segment data splits
12 months of continuous data updates
DELIVERED AS:
PDF EXCEL ONLINE
Geospatial Solution Market Analysis - Size, Share, and Forecast Outlook for 2025 to 2035
Geospatial Analytics Market Growth – Trends & Forecast through 2034
Imagery Analytics Market Analysis – Growth & Forecast through 2034
Analytics Of Things Market Size and Share Forecast Outlook 2025 to 2035
Analytics as a Service (AaaS) Market - Growth & Forecast 2025 to 2035
Analytics Sandbox Market
Ad Analytics Market Growth - Trends & Forecast 2025 to 2035
HR Analytics Market
AI-Powered Analytics – Transforming Business Intelligence
NFT Analytics Tools Market Size and Share Forecast Outlook 2025 to 2035
App Analytics Market Trends – Growth & Industry Forecast 2023-2033
Dark Analytics Market Size and Share Forecast Outlook 2025 to 2035
Text Analytics Market Size and Share Forecast Outlook 2025 to 2035
Cloud Analytics Market Size and Share Forecast Outlook 2025 to 2035
Drone Analytics Market Size and Share Forecast Outlook 2025 to 2035
Video Analytics Market Growth - Trends & Forecast 2025 to 2035
Visual Analytics Market Size and Share Forecast Outlook 2025 to 2035
Mobile Analytics Market Size and Share Forecast Outlook 2025 to 2035
Sports Analytics Market Growth - Trends & Forecast 2025 to 2035
Retail Analytics Market Analysis by Solution, Function, Enterprise Size, Deployment Model, Field Crowdsourcing, and Region Through 2035

Thank you!
You will receive an email from our Business Development Manager. Please be sure to check your SPAM/JUNK folder too.
Chat With
MaRIA