Reports

- Global Locations -

Headquarters

Future Market Insights, Inc.

Christiana Corporate, 200
Continental Drive, Suite 401,
Newark, Delaware - 19713,
United States

T: +1-845-579-5705

Americas

Future Market Insights, Inc.

616 Corporate Way, Suite 2-9018,
Valley Cottage, NY 10989, United States

T: +1-347-918-3531

MEA

Future Market Insights

1602-6 Jumeirah Bay X2 Tower, Plot No: JLT-PH2-X2A,
Jumeirah Lakes Towers, Dubai,
United Arab Emirates

Europe

Future Market Insights

3rd Floor, 207 Regent Street,
W1B 3HH London
United Kingdom

T: + 44 (0) 20 8123 9659
D: +44 (0) 20 3287 4268

Asia Pacific

Future Market Insights

IndiaLand Global Tech Park, Unit UG-1, Behind Grand HighStreet, Phase 1, Hinjawadi, MH, Pune – 411057, India

NFT Analytics Tools Market Outlook (2022 to 2032)

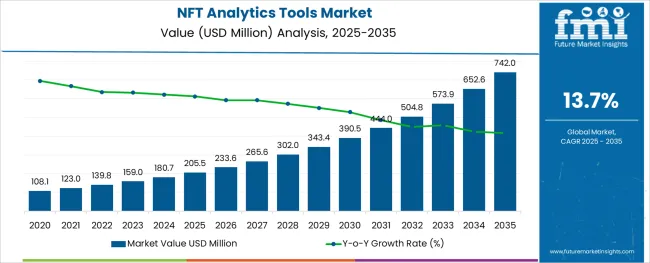
[250 Pages Report] The global Non-Fungible Tokens (NFT) analytics tools market revenue totaled US$ 124.7 Million in 2021. The NFT analytics tools market is expected to reach US$ 506.2 Million by 2032, growing at a CAGR of 13.7% from 2022 to 2032.

Attributes Details
Estimated Year (2022) Market Value US$ 139.8 Million
Projected Year (2032) Market Value US$ 506.2 Million
CAGR% (2022 to 2032) 13.7%
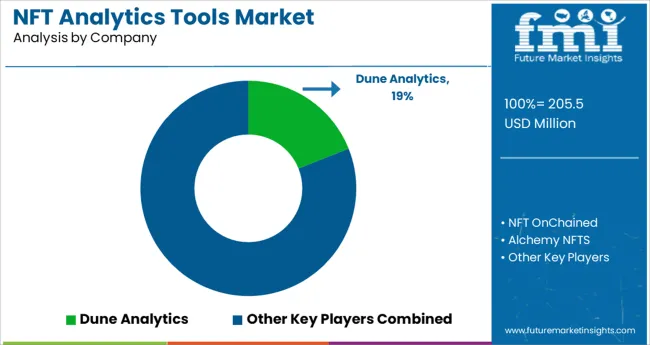
Top 5 Vendor Market Share Around 45%

Non-Fungible Tokens (NFT) analytics tools market enable users to evaluate real-time and historical data for NFT wallets, collections, or mints. End users can use this sort of technology to receive the most recent data, generate custom alerts, subscribe to curated feeds, and view dynamic visualizations.

Don't pay for what you don't need

Customize your report by selecting specific countries or regions and save 30%!

2017 to 2021 Non-Fungible Tokens (NFT) Analytics Tools Market Demand Outlook Compared to 2022 to 2032 Forecast

The Non-Fungible Tokens (NFT) Analytics Tools Market demand is estimated to grow at 13.7% CAGR between 2022 and 2032 as compared to 11.0% CAGR during the historic period of 2017 to 2021 as the increasing usage and demand of NFT tokens across the globe are driving the NFT analytics tool market. NFT analytics tools help with free minting NFTs, Upcoming NFT projects, and even hidden-gem NFTs from multi-chain

NFT Analytics Tools Market

Increasing demand for the NFT platform

A number of people across the globe found ways to earn money online with the help of digital platforms. These things attract people to the NFT platforms to earn money online. Before investing money and taking a risk most NFT investors want to study the market’s historic and current data, past sales, trading volume, buying pressure, floor prices, resistance levels, hype in the NFT community, and much more. The increasing demand for NFT market analysis from NFT investors is boosting the NFT analytics tool market growth across the globe.

Sudip Saha
Sudip Saha

Principal Consultant

Talk to Analyst

Find your sweet spots for generating winning opportunities in this market.

Regional Analysis

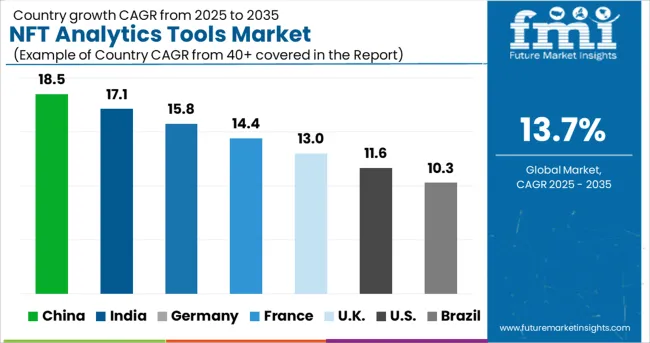
The Non-Fungible Tokens (NFT) Analytics Tools Market in South Asia Pacific is expected to grow at the fastest rate. During the forecast period, the region is expected to grow by 18.0% CAGR, with the increasing investment and user of NFT in the countries like Thailand, India, and Indonesia creating new opportunities for the NFT analytics tool market.

However, North America is expected to account for the highest market share of 35.2% in 2022 in the NFT analytics tool market. The presence of a large number of NFT investors in the US, and Canada and the early adoption of NFT platforms are helping market growth.
Country-wise Insights

Why adoption of the Non-Fungible Tokens (NFT) Analytics Tools Market increasing in Thailand?

The Non-Fungible Tokens (NFT) Analytics Tools Market demand in Thailand accounted for nearly 15.0% of the East Asia market share in 2021, Thailand consists with the highest number of NFT users growing due to increasing in mobile consumers and increasing opportunities for artists. In recent years, the country experience the largest market share of Non-Fungible Tokens due to digital transformation. For instance, In May 2022, Coral an online platform seeks to provide this opportunity to artists in the Southeast Asia region through the online marketplace potential and cooperation with the brands involved, artists, and their allies can collaborate and create together.

Why are the Non-Fungible Tokens (NFT) Analytics Tools Market growing in the USA?

The USA is expected to account for the largest market share of 24.6% in 2022 in the Non-Fungible Tokens (NFT) Analytics Tools Market in North America.

The USA leads in terms of the most NFT companies worldwide with 91 firms recorded, which shows the USA is a hub for 41.5% of all the NFT-based start-ups, the increase in the number of companies leads to an increase in engagement of NFT space, therefore, United States of America has a larger potential to increase its market share worldwide. For Instance, In September 2022 Apple has become the latest platform for the purchase and sale of NFTs to be listed, installed, and sold through its App Store, which currently has over one billion users, Twitter launched NFT verification for profile pictures, TikTok released creator-led NFT collections and many more.

Non-Fungible Tokens (NFT) Analytics Tools Market unfold in India

The Non-Fungible Tokens (NFT) Analytics Tools Market's rising demand in India accounted for nearly 4.2% of the East Asia market share in 2021, India holds with the sixth largest number of NFT users growing due to an increase in mobile consumers. In 2022, the Government of India allows NFTs as virtual digital assets in the Financial Budget wherein the government will charge 30% as a tax, worldwide 5% of NFT-based companies are scaling in India and focusing towards to engage more in NFTs space, as a result, the country will experience the highest growth of Non-Fungible Tokens during the forecast years.

The Non-Fungible Tokens (NFT) Analytics Tools Market has various characteristics and attributes. According to the preview image, various characteristics of a market like revenue volatility, a barrier to entry, and overall attractiveness have a different impact on the overall market, which shows its results differently in different regions.

The preview image shows characteristics of revenue volatility have a medium impact on the market, on the other hand, capital intensiveness has more impact on overall market growth. Because the NFT transactions are anticipated with high and hidden gas fees, which impacted many new users due to unawareness, sometimes its create trust issue.

The regulatory complexity has a significant impact on the market. As the preview image represents Europe and North America are highly relevant, which means regulatory complexity in Europe and North America region is high compared to Latin America and MEA region.

Get the data you need at a Fraction of the cost

Personalize your report by choosing insights you need
and save 40%!

Category-wise Insights

Why the demand is increasing for Mobile-based NFT Analytics Tools?

During the forecast period, The Mobile-based NFT Analytics Tool is expected to account market share of 43.7% in 2022 in the Non-Fungible Tokens (NFT) Analytics Tools Market. Mobile-based NFT analytics tools are highly adopted by individual users and it creates new opportunities for the mobile-based NFT analytics tool. The mobile-based NFT analytics tools are easy to use and provide information about NFT market space, total supply, and price. Also, it gives analysis regarding the community growth rate, community score, and engagement rate. when users can create an account and add any NFT to their calendar, they will get a time-to-time alert on their mobile-based NFT analytics tools when that NFT launches. With the help of this alert, Users can take benefit of any upcoming NFTs and avoid losing out on any profitable ones.

How individual segment led the non-fungible token (NFT) analytics tool market?

The individual segment led the non-fungible token (NFT) market in 2021, it accounting for 55.3% of the market share. One of the major driving factors of industry expansion is rising global spending on digital assets.

A number of individual users are investing in dynamic NFTs, and game NFTs, to avoid losses. For instance, Traditionally, in-game purchases have been a one-time, non-transferable investment locked into a particular gaming environment. on the other hand, Non-fungible tokens, allow programmers control over their in-game assets. Gamers can save in-game buys, sell them to another player, or transfer them to other compatible games with the help of blockchain technology. Individual users are majorly using the NFT analytics tool due to their features like the tools that analyze the trends and answer what and why happened in the market, and which actions to take next by users, track real-time market data and transactions, and also share historical transactions and charts to improve users research.

The growing use of NFTs for commercial purposes and the increasing adoption of blockchain technology are creating new opportunities in the market.

The commercial segment accounted significant revenue share of the NFT analytics tool market. The growing use of NFTs for commercial purposes such as supply logistics innovation and chain management is expected to push the market forward. Organizations in the logistics sector are increasingly adopting blockchain technology into their operations, offering new opportunities for the industry to grow.
Competitive Landscape

Non-Fungible Tokens (NFT) Analytics Tools Market players are focusing on various strategies for increasing their investments in research and development to upgrade their technologies as per the market requirement. Also, several organizations are acquiring and entering into a partnership with other companies to develop their own Non-Fungible Tokens (NFT) Analytics Tools Market solution to serve the customer demand.

For Instance, In February 2022, NFT Terminal launched an NFT analytics tool to analyze NFT’s real-time data, NFT sales, mints, and transaction trends. This innovation helps the company to fulfill the market requirements.

In May 2022, Quicknode, the blockchain infrastructure provider acquired Icy. tools, an NFT analytics platform. This acquisition helps Quicknode to enhance its NFT analytics product portfolio.

Scope of Report

Attributes Details
Market value in 2022 US$ 139.8 Million
Market CAGR 2022 to 2032 13.7%
Share of top 5 players Around 45%
Forecast Period 2022 to 2032
Historical Data Available for 2017 to 2021
Market Analysis USD Million for Value
Key Regions Covered North America, Latin America, Europe, East Asia, South Asia & Pacific, and the Middle East & Africa
Key Countries Covered USA, Canada, Germany, UK, France, Italy, Spain, Russia, China, Japan, South Korea, India, Malaysia, Indonesia, Singapore, Australia & New Zealand, GCC Countries, Turkey, North Africa, and South Africa
Key Segments Covered By Tool Type, By End User, and Region
Key Companies Profiled
Report Coverage Market Forecast, Company Share Analysis, Competition Intelligence, Drivers, Restraints, Opportunities and Threats Analysis, Market Dynamics and Challenges, and Strategic Growth Initiatives
Customization & Pricing Available upon Request

NFT Analytics Tools Outlook by Category

Global Non-Fungible Tokens (NFT) Analytics Tools Market Outlook Tool Type:

  • Web-based NFT Analytics Tool
  • Mobile-based NFT Analytics Tool

By End User, Non-Fungible Tokens (NFT) Analytics Tools Market Outlook is segmented as:

  • Individual Users
  • Commercial/Business Users

By Region, the Non-Fungible Tokens (NFT) Analytics Tools Market is segmented as:

  • North America
  • Latin America
  • Europe
  • East Asia
  • South Asia & Pacific
  • The Middle East and Africa (MEA)

Frequently Asked Questions

Which region is expected to showcase high growth in Non-Fungible Tokens (NFT) Analytics Tools Market demand?

South Asia & Pacific is projected to register strong growth in the market, exhibiting a CAGR of nearly 18.0% during the forecast period with a market share of around 12.4% in 2022.

How much is the global Non-Fungible Tokens (NFT) Analytics Tools Market worth?

The Non-Fungible Tokens (NFT) Analytics Tools Market industry was valued at ~US$ 124.7 Million in 2021 and is estimated to grow at an exceptional pace with a CAGR of 13.7%.

What will be the demand outlook/ sales forecast for the Non-Fungible Tokens (NFT) Analytics Tools Market?

The sales of Non-Fungible Tokens (NFT) Analytics Tools Market solution are expected to total ~US$ 139.8 Million by the end of 2022 and are likely to reach ~US$ 506.2 Million by 2032.

What was the last 5-year Non-Fungible Tokens (NFT) Analytics Tools Market CAGR?

The market in the last 5 years (2017 to 2021) grew by a CAGR of 11.0%.

What is driving demand for the Non-Fungible Tokens (NFT) Analytics Tools Market?

Rising demand for analyze NFT market to avoid the losses is driving the NFT analytics market.

What are the top 5 countries driving demand?

The top 5 countries driving demand for the Non-Fungible Tokens (NFT) Analytics Tools Market include the US, Canada, India, Thailand, and Brazil.

What is Europe’s market outlook?

Europe is predicted to remain one of the most attractive markets during the forecast period, according to Future Market Insights. According to the study, the Germany is expected to account for nearly 12.8% of the Europe market through 2032.

What are the South Korean and Japan Non-Fungible Tokens (NFT) Analytics Tools Market solution market outlook?

The Non-Fungible Tokens (NFT) Analytics Tools Market solution demand in Japan and South Korea was valued at ~US$ 14.3 Million and ~US$ 11.9 Million in 2021, respectively and is projected to register a CAGR of around 8.6% and 9.3% respectively between 2022 and 2032.

Who are some of the leading companies offering Non-Fungible Tokens (NFT) Analytics Tools Market solutions?

Some of the leading companies in this landscape are Dune, NFT OnChained, Alchemy NFTS, Nansen, UXCam, Metawin, Rainbow Wallet, OpenSea, Trait Sniper, BitDegree, NFT Evening, Singular, NFT Terminal and Quicknode and among others. As per Future Market Insights, nearly 45%-50% of the market share is currently covered by the top players.

Table of Content

1. Executive Summary | NFT Analytics Tools Market

    1.1. Global Market Outlook

    1.2. Demand Side Trends

    1.3. Supply Side Trends

    1.4. Analysis and Recommendations

2. Market Overview

    2.1. Market Coverage / Taxonomy

    2.2. Market Definition / Scope / Limitations

3. Key Market Trends

    3.1. Key Trends Impacting the Market

    3.2. Innovation / Development Trends

4. Pricing Analysis

    4.1. Pricing Analysis, NFT Tools

    4.2. Global Average Pricing Analysis Benchmark

5. COVID-19 Impact Analysis

    5.1. Impact of COVID-19 on Growth

    5.2. Pre-COVID-19 Market Growth (2017 to 2019)

    5.3. Expected Recovery Scenario (Short Term/Mid Term/Long Term)

    5.4. Key Action Points for Vendors

6. Global Market Demand (in Value in US$ Million) Analysis 2017 to 2021 and Forecast, 2022 to 2032

    6.1. Historical Market Value (US$ Million) Analysis, 2017 to 2021

    6.2. Current and Future Market Value (US$ Million) Projections, 2022 to 2032

        6.2.1. Y-o-Y Growth Trend Analysis

        6.2.2. Absolute $ Opportunity Analysis

7. Market Background

    7.1. Macro-Economic Factors

    7.2. Forecast Factors - Relevance & Impact

    7.3. Value Chain

    7.4. Market Dynamics

        7.4.1. Drivers

        7.4.2. Restraints

        7.4.3. Opportunities

8. Global Market Analysis 2017 to 2021 and Forecast 2022 to 2032, Tool Type

    8.1. Introduction / Key Findings

    8.2. Historical Market Size (US$ Million) Analysis By Tool Type, 2017 to 2021

    8.3. Current and Future Market Size (US$ Million) Analysis and Forecast by Tool Type, 2022 to 2032

        8.3.1. Web-based NFT Analytics Tool

        8.3.2. Mobile-based NFT Analytics Tool

    8.4. Market Attractiveness Analysis by Tool Type

9. Global Market Analysis 2017 to 2021 and Forecast 2022 to 2032, by End User

    9.1. Introduction / Key Findings

    9.2. Historical Market Size (US$ Million) Analysis By End User, 2017 to 2021

    9.3. Current and Future Market Size (US$ Million) Analysis and Forecast By End User, 2022 to 2032

        9.3.1. Individual Users

        9.3.2. Commercial/Business Users

    9.4. Market Attractiveness Analysis By End User

10. Global Market Analysis 2017 to 2021 and Forecast 2022 to 2032, by Region

    10.1. Introduction / Key Findings

    10.2. Historical Market Size (US$ Million) Analysis By Region, 2017 to 2021

    10.3. Current and Future Market Size (US$ Million) Analysis and Forecast By Region, 2022 to 2032

        10.3.1. North America

        10.3.2. Latin America

        10.3.3. Europe

        10.3.4. East Asia

        10.3.5. South Asia & Pacific

        10.3.6. Middle East & Africa

    10.4. Market Attractiveness Analysis By Region

11. North America Market Analysis 2017 to 2021 and Forecast 2022 to 2032

    11.1. Introduction

    11.2. Historical Market Size (US$ Million) Trend Analysis By Market Taxonomy, 2017 to 2021

    11.3. Current and Future Market Size (US$ Million) Forecast By Market Taxonomy, 2022 to 2032

        11.3.1. By Tool Type

        11.3.2. By End User

        11.3.3. By Country

            11.3.3.1. United States of America

            11.3.3.2. Canada

    11.4. Market Attractiveness Analysis

        11.4.1. By Tool Type

        11.4.2. By End User

        11.4.3. By Country

    11.5. Market Trends

    11.6. Key Market Participants - Intensity Mapping

12. Latin America Market Analysis 2017 to 2021 and Forecast 2022 to 2032

    12.1. Introduction

    12.2. Historical Market Size (US$ Million) Trend Analysis By Market Taxonomy, 2017 to 2021

    12.3. Current and Future Market Size (US$ Million) Forecast By Market Taxonomy, 2022 to 2032

        12.3.1. By Tool Type

        12.3.2. By End User

        12.3.3. By Country

            12.3.3.1. Brazil

            12.3.3.2. Mexico

            12.3.3.3. Rest of Latin America

    12.4. Market Attractiveness Analysis

        12.4.1. By Tool Type

        12.4.2. By End User

        12.4.3. By Country

    12.5. Market Trends

    12.6. Key Market Participants - Intensity Mapping

13. Europe Market Analysis 2017 to 2021 and Forecast 2022 to 2032

    13.1. Introduction

    13.2. Historical Market Size (US$ Million) Trend Analysis By Market Taxonomy, 2017 to 2021

    13.3. Current and Future Market Size (US$ Million) Forecast By Market Taxonomy, 2022 to 2032

        13.3.1. By Tool Type

        13.3.2. By End User

        13.3.3. By Country

            13.3.3.1. Germany

            13.3.3.2. Italy

            13.3.3.3. France

            13.3.3.4. United Kingdom

            13.3.3.5. Spain

            13.3.3.6. BENELUX

            13.3.3.7. Russia

            13.3.3.8. Rest of Europe

    13.4. Market Attractiveness Analysis

        13.4.1. By Tool Type

        13.4.2. By End User

        13.4.3. By Country

    13.5. Market Trends

    13.6. Key Market Participants - Intensity Mapping

14. South Asia & Pacific Market Analysis 2017 to 2021 and Forecast 2022 to 2032

    14.1. Introduction

    14.2. Historical Market Size (US$ Million) Trend Analysis By Market Taxonomy, 2017 to 2021

    14.3. Current and Future Market Size (US$ Million) Forecast By Market Taxonomy, 2022 to 2032

        14.3.1. By Tool Type

        14.3.2. By End User

        14.3.3. By Country

            14.3.3.1. India

            14.3.3.2. Thailand

            14.3.3.3. Indonesia

            14.3.3.4. Malaysia

            14.3.3.5. Australia & New Zealand

            14.3.3.6. Rest of South Asia

    14.4. Market Attractiveness Analysis

        14.4.1. By Tool Type

        14.4.2. By End User

        14.4.3. By Country

    14.5. Market Trends

    14.6. Key Market Participants - Intensity Mapping

15. East Asia Market Analysis 2017 to 2021 and Forecast 2022 to 2032

    15.1. Introduction

    15.2. Historical Market Size (US$ Million) Trend Analysis By Market Taxonomy, 2017 to 2021

    15.3. Current and Future Market Size (US$ Million) Forecast By Market Taxonomy, 2022 to 2032

        15.3.1. By Tool Type

        15.3.2. By End User

        15.3.3. By Country

            15.3.3.1. China

            15.3.3.2. Japan

            15.3.3.3. South Korea

    15.4. Market Attractiveness Analysis

        15.4.1. By Tool Type

        15.4.2. By End User

        15.4.3. By Country

    15.5. Market Trends

    15.6. Key Market Participants - Intensity Mapping

16. Middle East and Africa Market Analysis 2017 to 2021 and Forecast 2022 to 2032

    16.1. Introduction

    16.2. Historical Market Size (US$ Million) Trend Analysis By Market Taxonomy, 2017 to 2021

    16.3. Current and Future Market Size (US$ Million) Forecast By Market Taxonomy, 2022 to 2032

        16.3.1. By Tool Type

        16.3.2. By End User

        16.3.3. By Country

            16.3.3.1. GCC Countries

            16.3.3.2. Turkey

            16.3.3.3. Northern Africa

            16.3.3.4. South Africa

            16.3.3.5. Rest of Middle East and Africa

    16.4. Market Attractiveness Analysis

        16.4.1. By Tool Type

        16.4.2. By End User

        16.4.3. By Country

    16.5. Market Trends

    16.6. Key Market Participants - Intensity Mapping

17. Key Countries Analysis- Market

    17.1. USA Market Analysis

        17.1.1. By Tool Type

        17.1.2. By End User

    17.2. Canada Market Analysis

        17.2.1. By Tool Type

        17.2.2. By End User

    17.3. Mexico Market Analysis

        17.3.1. By Tool Type

        17.3.2. By End User

    17.4. Brazil Market Analysis

        17.4.1. By Tool Type

        17.4.2. By End User

    17.5. Germany Market Analysis

        17.5.1. By Tool Type

        17.5.2. By End User

    17.6. Italy Market Analysis

        17.6.1. By Tool Type

        17.6.2. By End User

    17.7. France Market Analysis

        17.7.1. By Tool Type

        17.7.2. By End User

    17.8. UK Market Analysis

        17.8.1. By Tool Type

        17.8.2. By End User

    17.9. Spain Market Analysis

        17.9.1. By Tool Type

        17.9.2. By End User

    17.10. BENELUX Market Analysis

        17.10.1. By Tool Type

        17.10.2. By End User

    17.11. Russia Market Analysis

        17.11.1. By Tool Type

        17.11.2. By End User

    17.12. China Market Analysis

        17.12.1. By Tool Type

        17.12.2. By End User

    17.13. Japan Market Analysis

        17.13.1. By Tool Type

        17.13.2. By End User

    17.14. South Korea Market Analysis

        17.14.1. By Tool Type

        17.14.2. By End User

    17.15. India Market Analysis

        17.15.1. By Tool Type

        17.15.2. By End User

    17.16. ASEAN Market Analysis

        17.16.1. By Tool Type

        17.16.2. By End User

    17.17. Australia and New Zealand Market Analysis

        17.17.1. By Tool Type

        17.17.2. By End User

    17.18. GCC Countries Market Analysis

        17.18.1. By Deployment Mode

        17.18.2. By Enterprise Size

        17.18.3. By Industry

    17.19. Turkey Market Analysis

        17.19.1. By Deployment Mode

        17.19.2. By Enterprise Size

        17.19.3. By Industry

    17.20. South Africa Market Analysis

        17.20.1. By Deployment Mode

        17.20.2. By Enterprise Size

        17.20.3. By Industry

18. Market Structure Analysis

    18.1. Market Analysis by Tier of Companies

    18.2. Market Share Analysis of Top Players

    18.3. Market Presence Analysis

        18.3.1. Regional footprint by Players

        18.3.2. Product footprint by Players

        18.3.3. Channel footprint by Players

19. Competition Analysis

    19.1. Competition Dashboard

    19.2. Key Strategies, By Competitors

    19.3. Competition Deep Dive

        19.3.1. Dune Analytics

            19.3.1.1. Business Overview

            19.3.1.2. Solution Portfolio

            19.3.1.3. Profitability by Market Segments (Business Segments/Region)

            19.3.1.4. Sales Footprint

            19.3.1.5. Strategy Overview

                19.3.1.5.1. Business Strategies

                19.3.1.5.2. Solution Strategies

                19.3.1.5.3. Channel Strategies

        19.3.2. NFT OnChained

            19.3.2.1. Business Overview

            19.3.2.2. Solution Portfolio

            19.3.2.3. Profitability by Market Segments (Business Segments/Region)

            19.3.2.4. Sales Footprint

            19.3.2.5. Strategy Overview

                19.3.2.5.1. Business Strategies

                19.3.2.5.2. Solution Strategies

                19.3.2.5.3. Channel Strategies

        19.3.3. Alchemy NFTS

            19.3.3.1. Business Overview

            19.3.3.2. Solution Portfolio

            19.3.3.3. Profitability by Market Segments (Business Segments/Region)

            19.3.3.4. Sales Footprint

            19.3.3.5. Strategy Overview

                19.3.3.5.1. Business Strategies

                19.3.3.5.2. Solution Strategies

                19.3.3.5.3. Channel Strategies

        19.3.4. Nansen

            19.3.4.1. Business Overview

            19.3.4.2. Solution Portfolio

            19.3.4.3. Profitability by Market Segments (Business Segments/Region)

            19.3.4.4. Sales Footprint

            19.3.4.5. Strategy Overview

                19.3.4.5.1. Business Strategies

                19.3.4.5.2. Solution Strategies

                19.3.4.5.3. Channel Strategies

        19.3.5. UXCam

            19.3.5.1. Business Overview

            19.3.5.2. Solution Portfolio

            19.3.5.3. Profitability by Market Segments (Business Segments/Region)

            19.3.5.4. Sales Footprint

            19.3.5.5. Strategy Overview

                19.3.5.5.1. Business Strategies

                19.3.5.5.2. Solution Strategies

                19.3.5.5.3. Channel Strategies

        19.3.6. Metawin

            19.3.6.1. Business Overview

            19.3.6.2. Solution Portfolio

            19.3.6.3. Profitability by Market Segments (Business Segments/Region)

            19.3.6.4. Sales Footprint

            19.3.6.5. Strategy Overview

                19.3.6.5.1. Business Strategies

                19.3.6.5.2. Solution Strategies

                19.3.6.5.3. Channel Strategies

        19.3.7. Rainbow Wallet

            19.3.7.1. Business Overview

            19.3.7.2. Solution Portfolio

            19.3.7.3. Profitability by Market Segments (Business Segments/Region)

            19.3.7.4. Sales Footprint

            19.3.7.5. Strategy Overview

                19.3.7.5.1. Business Strategies

                19.3.7.5.2. Solution Strategies

                19.3.7.5.3. Channel Strategies

        19.3.8. OpenSea

            19.3.8.1. Business Overview

            19.3.8.2. Solution Portfolio

            19.3.8.3. Profitability by Market Segments (Business Segments/Region)

            19.3.8.4. Sales Footprint

            19.3.8.5. Strategy Overview

                19.3.8.5.1. Business Strategies

                19.3.8.5.2. Solution Strategies

                19.3.8.5.3. Channel Strategies

        19.3.9. Trait Sniper

            19.3.9.1. Business Overview

            19.3.9.2. Solution Portfolio

            19.3.9.3. Profitability by Market Segments (Business Segments/Region)

            19.3.9.4. Sales Footprint

            19.3.9.5. Strategy Overview

                19.3.9.5.1. Business Strategies

                19.3.9.5.2. Solution Strategies

                19.3.9.5.3. Channel Strategies

        19.3.10. BitDegree

            19.3.10.1. Business Overview

            19.3.10.2. Solution Portfolio

            19.3.10.3. Profitability by Market Segments (Business Segments/Region)

            19.3.10.4. Sales Footprint

            19.3.10.5. Strategy Overview

                19.3.10.5.1. Business Strategies

                19.3.10.5.2. Solution Strategies

                19.3.10.5.3. Channel Strategies

        19.3.11. NFT Evening

            19.3.11.1. Business Overview

            19.3.11.2. Solution Portfolio

            19.3.11.3. Profitability by Market Segments (Business Segments/Region)

            19.3.11.4. Sales Footprint

            19.3.11.5. Strategy Overview

                19.3.11.5.1. Business Strategies

                19.3.11.5.2. Solution Strategies

                19.3.11.5.3. Channel Strategies

        19.3.12. Singular

            19.3.12.1. Business Overview

            19.3.12.2. Solution Portfolio

            19.3.12.3. Profitability by Market Segments (Business Segments/Region)

            19.3.12.4. Sales Footprint

            19.3.12.5. Strategy Overview

                19.3.12.5.1. Business Strategies

                19.3.12.5.2. Solution Strategies

                19.3.12.5.3. Channel Strategies

        19.3.13. NFT Terminal

            19.3.13.1. Business Overview

            19.3.13.2. Solution Portfolio

            19.3.13.3. Profitability by Market Segments (Business Segments/Region)

            19.3.13.4. Sales Footprint

            19.3.13.5. Strategy Overview

                19.3.13.5.1. Business Strategies

                19.3.13.5.2. Solution Strategies

                19.3.13.5.3. Channel Strategies

        19.3.14. Quicknode

            19.3.14.1. Business Overview

            19.3.14.2. Solution Portfolio

            19.3.14.3. Profitability by Market Segments (Business Segments/Region)

            19.3.14.4. Sales Footprint

            19.3.14.5. Strategy Overview

                19.3.14.5.1. Business Strategies

                19.3.14.5.2. Solution Strategies

                19.3.14.5.3. Channel Strategies

20. Assumptions and Acronyms Used

21. Research Methodology

Don't pay for what you don't need

Customize your report by selecting specific countries or regions and save 30%!

List of Tables

Table 1: Global Market Value (US$ Million) Analysis (2017 to 2021) Tool Type

Table 2: Global Market Value (US$ Million) Analysis (2017 to 2021) Tool Type

Table 3: Global Market Value (US$ Million) Analysis (2017 to 2021) Tool Type

Table 4: Global Market Value (US$ Million) Analysis (2017 to 2021) Tool Type

Table 5: Global Market Value (US$ Million) Analysis (2017 to 2021) by End User

Table 6: Global Market Value (US$ Million) Analysis (2017 to 2021) by End User

Table 7: Global Market Value (US$ Million) Analysis (2017 to 2021) by Region

Table 8: Global Market Value (US$ Million) Analysis (2017 to 2021) by Region

Table 9: North America Market Value (US$ Million) Analysis (2017 to 2021) Tool Type

Table 10: North America Market Value (US$ Million) Analysis (2017 to 2021) Tool Type

Table 11: North America Market Value (US$ Million) Analysis (2017 to 2021) Tool Type

Table 12: North America Market Value (US$ Million) Analysis (2017 to 2021) Tool Type

Table 13: North America Market Value (US$ Million) Analysis (2017 to 2021) by End User

Table 14: North America Market Value (US$ Million) Analysis (2017 to 2021) by End User

Table 15: North America Market

Table 16: North America Market Value (US$ Million) Analysis (2017 to 2021) by Country

Table 17: Latin America Market Value (US$ Million) Analysis (2017 to 2021) Tool Type

Table 18: Latin America Market Value (US$ Million) Analysis (2017 to 2021) Tool Type

Table 19: Latin America Market Value (US$ Million) Analysis (2017 to 2021) Tool Type

Table 20: Latin America Market Value (US$ Million) Analysis (2017 to 2021) Tool Type

Table 21: Latin America Market Value (US$ Million) Analysis (2017 to 2021) by End User

Table 22: Latin America Market Value (US$ Million) Analysis (2017 to 2021) by End User

Table 23: Latin America Market Value (US$ Million) Analysis (2017 to 2021) by Country

Table 24: Latin America Market Value (US$ Million) Analysis (2017 to 2021) by Country

Table 25: Europe Market Value (US$ Million) Analysis (2017 to 2021) Tool Type

Table 26: Europe Market Value (US$ Million) Analysis (2017 to 2021) Tool Type

Table 27: Europe Market Value (US$ Million) Analysis (2017 to 2021) Tool Type

Table 28: Europe Market Value (US$ Million) Analysis (2017 to 2021) Tool Type

Table 29: Europe Market Value (US$ Million) Analysis (2017 to 2021) by End User

Table 30: Europe Market Value (US$ Million) Analysis (2017 to 2021) by End User

Table 31: Europe Market Value (US$ Million) Analysis (2017 to 2021) by Country

Table 32: Europe Market Value (US$ Million) Analysis (2017 to 2021) by Country

Table 33: East Asia Market Value (US$ Million) Analysis (2017 to 2021) Tool Type

Table 34: East Asia Market Value (US$ Million) Analysis (2017 to 2021) Tool Type

Table 35: East Asia Market Value (US$ Million) Analysis (2017 to 2021) Tool Type

Table 36: East Asia Market Value (US$ Million) Analysis (2017 to 2021) Tool Type

Table 37: East Asia Market Value (US$ Million) Analysis (2017 to 2021) by End User

Table 38: East Asia Market Value (US$ Million) Analysis (2017 to 2021) by End User

Table 39: East Asia Market Value (US$ Million) Analysis (2017 to 2021) by Country

Table 40: East Asia Market Value (US$ Million) Analysis (2017 to 2021) by Country

Table 41: South Asia & Pacific Market Value (US$ Million) Analysis (2017 to 2021) Tool Type

Table 42: South Asia & Pacific Market Value (US$ Million) Analysis (2017 to 2021) Tool Type

Table 43: South Asia & Pacific Market Value (US$ Million) Analysis (2017 to 2021) Tool Type

Table 44: South Asia & Pacific Market Value (US$ Million) Analysis (2017 to 2021) Tool Type

Table 45: South Asia & Pacific Market Value (US$ Million) Analysis (2017 to 2021) by End User

Table 46: South Asia & Pacific Market Value (US$ Million) Analysis (2017 to 2021) by End User

Table 47: South Asia & Pacific Market Value (US$ Million) Analysis (2017 to 2021) by Country

Table 48: South Asia & Pacific Market Value (US$ Million) Analysis (2017 to 2021) by Country

Table 49: Middle East & Africa Market Value (US$ Million) Analysis (2017 to 2021) Tool Type

Table 50: Middle East & Africa Market Value (US$ Million) Analysis (2017 to 2021) Tool Type

Table 51: Middle East & Africa Market Value (US$ Million) Analysis (2017 to 2021) Tool Type

Table 52: Middle East & Africa Market Value (US$ Million) Analysis (2017 to 2021) Tool Type

Table 53: Middle East & Africa Market Value (US$ Million) Analysis (2017 to 2021) by End User

Table 54: Middle East & Africa Market Value (US$ Million) Analysis (2017 to 2021) by End User

Table 55: Middle East & Africa Market Value (US$ Million) Analysis (2017 to 2021) by Country

Table 56: Middle East & Africa Market Value (US$ Million) Analysis (2017 to 2021) by Country
Sudip Saha
Sudip Saha

Principal Consultant

Talk to Analyst

Find your sweet spots for generating winning opportunities in this market.

List of Charts

Figure 01: Global Market Value (US$ Million), 2017 to 2021

Figure 02: Global Market Value (US$ Million), 2022 to 2032

Figure 03: Global Market Size (US$ Million) and Y-o-Y Growth Rate from 2022 to 2032

Figure 04: Global Market Size and Y-o-Y Growth Rate from 2022 to 2032

Figure 05: Global Market Value Y-o-Y Growth Trend Analysis (2019 to 2032) Tool Type

Figure 06: Global Market Value Share Analysis (2022 to 2032) Tool Type

Figure 07: Global Market Attractiveness Tool Type

Figure 08: Global Market Value Y-o-Y Growth Trend Analysis (2019 to 2032) by End User

Figure 09: Global Market Value Share Analysis (2022 to 2032) by End User

Figure 10: Global Market Attractiveness by End User

Figure 11: Global Market Value Y-o-Y Growth Trend Analysis (2019 to 2032) by Region

Figure 12: Global Market Value Share Analysis (2022 to 2032) by Region

Figure 13: Global Market Attractiveness by Region

Figure 14: North America Market Absolute $ Opportunity (US$ Million), 2017 to 2032

Figure 15: Latin America Market Absolute $ Opportunity (US$ Million), 2017 to 2032

Figure 16: Europe Market Absolute $ Opportunity (US$ Million), 2017 to 2032

Figure 17: East Asia Market Absolute $ Opportunity (US$ Million), 2017 to 2032

Figure 18: South Asia & Pacific Market Absolute $ Opportunity (US$ Million), 2017 to 2032

Figure 19: Middle East & Africa Market Absolute $ Opportunity (US$ Million), 2017 to 2032

Figure 20: North America Market Value (US$ Million), 2017 to 2021

Figure 21: North America Market Value (US$ Million), 2022 to 2032

Figure 22: North America Market Value Y-o-Y Growth Trend Analysis (2019 to 2032) Tool Type

Figure 23: North America Market Value Share Analysis (2022 to 2032) Tool Type

Figure 24: North America Market Attractiveness Tool Type

Figure 25: North America Market Value Y-o-Y Growth Trend Analysis (2019 to 2032) by End User

Figure 26: North America Market Value Share Analysis (2022 to 2032) by End User

Figure 27: North America Market Attractiveness by End User

Figure 28: North America Market Value Y-o-Y Growth Trend Analysis (2019 to 2032) by Country

Figure 29: North America Market Value Share Analysis (2022 to 2032) by Country

Figure 30: North America Market Attractiveness by Country

Figure 31: USA Market Absolute $ Opportunity (US$ Million), 2017 to 2032

Figure 32: Canada Market Absolute $ Opportunity (US$ Million), 2017 to 2032

Figure 33: Latin America Market Value (US$ Million), 2017 to 2021

Figure 34: Latin America Market Value (US$ Million), 2022 to 2032

Figure 35: Latin America Market Value Y-o-Y Growth Trend Analysis (2019 to 2032) Tool Type

Figure 36: Latin America Market Value Share Analysis (2022 to 2032) Tool Type

Figure 37: Latin America Market Attractiveness Tool Type

Figure 38: Latin America Market Value Y-o-Y Growth Trend Analysis (2019 to 2032) by End User

Figure 39: Latin America Market Value Share Analysis (2022 to 2032) by End User

Figure 40: Latin America Market Attractiveness by End User

Figure 41: Latin America Market Value Y-o-Y Growth Trend Analysis (2019 to 2032) by Country

Figure 42: Latin America Market Value Share Analysis (2022 to 2032) by Country

Figure 43: Latin America Market Attractiveness by Country

Figure 44: Brazil Market Absolute $ Opportunity (US$ Million), 2017 to 2032

Figure 45: Mexico Market Absolute $ Opportunity (US$ Million), 2017 to 2032

Figure 46: Rest of Latin America Market Absolute $ Opportunity (US$ Million), 2017 to 2032

Figure 47: Europe Market Value (US$ Million), 2017 to 2021

Figure 48: Europe Market Value (US$ Million), 2022 to 2032

Figure 49: Europe Market Value Y-o-Y Growth Trend Analysis (2019 to 2032) Tool Type

Figure 50: Europe Market Value Share Analysis (2022 to 2032) Tool Type

Figure 51: Europe Market Attractiveness Tool Type

Figure 52: Europe Market Value Y-o-Y Growth Trend Analysis (2019 to 2032) by End User

Figure 53: Europe Market Value Share Analysis (2022 to 2032) by End User

Figure 54: Europe Market Attractiveness by End User

Figure 55: Europe Market Value Y-o-Y Growth Trend Analysis (2019 to 2032) by Country

Figure 56: Europe Market Value Share Analysis (2022 to 2032) by Country

Figure 57: Europe Market Attractiveness by Country

Figure 58: Germany Market Absolute $ Opportunity (US$ Million), 2017 to 2032

Figure 59: Italy Market Absolute $ Opportunity (US$ Million), 2017 to 2032

Figure 60: France Market Absolute $ Opportunity (US$ Million), 2017 to 2032

Figure 61: UK Market Absolute $ Opportunity (US$ Million), 2017 to 2032

Figure 62: Spain Market Absolute $ Opportunity (US$ Million), 2017 to 2032

Figure 63: BENELUX Market Absolute $ Opportunity (US$ Million), 2017 to 2032

Figure 64: Russia Market Absolute $ Opportunity (US$ Million), 2017 to 2032

Figure 65: Rest of Europe Market Absolute $ Opportunity (US$ Million), 2017 to 2032

Figure 66: East Asia Market Value (US$ Million), 2017 to 2021

Figure 67: East Asia Market Value (US$ Million), 2022 to 2032

Figure 68: East Asia Market Value Y-o-Y Growth Trend Analysis (2019 to 2032) Tool Type

Figure 69: East Asia Market Value Share Analysis (2022 to 2032) Tool Type

Figure 70: East Asia Market Attractiveness Tool Type

Figure 71: East Asia Market Value Y-o-Y Growth Trend Analysis (2019 to 2032) by End User

Figure 72: East Asia Market Value Share Analysis (2022 to 2032) by End User

Figure 73: East Asia Market Attractiveness by End User

Figure 74: East Asia Market Value Y-o-Y Growth Trend Analysis (2019 to 2032) by Country

Figure 75: East Asia Market Value Share Analysis (2022 to 2032) by Country

Figure 76: East Asia Market Attractiveness by Country

Figure 77: China Market Absolute $ Opportunity (US$ Million), 2017 to 2032

Figure 78: Japan Market Absolute $ Opportunity (US$ Million), 2017 to 2032

Figure 79: South Korea Market Absolute $ Opportunity (US$ Million), 2017 to 2032

Figure 80: South Asia & Pacific Market Value (US$ Million), 2017 to 2021

Figure 81: South Asia & Pacific Market Value (US$ Million), 2022 to 2032

Figure 82: South Asia & Pacific Market Value Y-o-Y Growth Trend Analysis (2019 to 2032) Tool Type

Figure 83: South Asia & Pacific Market Value Share Analysis (2022 to 2032) Tool Type

Figure 84: South Asia & Pacific Market Attractiveness Tool Type

Figure 85: South Asia & Pacific Market Value Y-o-Y Growth Trend Analysis (2019 to 2032) by End User

Figure 86: South Asia & Pacific Market Value Share Analysis (2022 to 2032) by End User

Figure 87: South Asia & Pacific Market Attractiveness by End User

Figure 88: South Asia & Pacific Market Value Y-o-Y Growth Trend Analysis (2019 to 2032) by Country

Figure 89: South Asia & Pacific Market Value Share Analysis (2022 to 2032) by Country

Figure 90: South Asia & Pacific Market Attractiveness by Country

Figure 91: India Market Absolute $ Opportunity (US$ Million), 2017 to 2032

Figure 92: ASEAN Market Absolute $ Opportunity (US$ Million), 2017 to 2032

Figure 93: Australia & New Zealand Market Absolute $ Opportunity (US$ Million), 2017 to 2032

Figure 94: Rest of South Asia & Pacific Market Absolute $ Opportunity (US$ Million), 2017 to 2032

Figure 95: Middle East & Africa Market Value (US$ Million), 2017 to 2021

Figure 96: Middle East & Africa Market Value (US$ Million), 2022 to 2032

Figure 97: Middle East & Africa Market Value Y-o-Y Growth Trend Analysis (2019 to 2032) Tool Type

Figure 98: Middle East & Africa Market Value Share Analysis (2022 to 2032) Tool Type

Figure 99: Middle East & Africa Market Attractiveness Tool Type

Figure 100: Middle East & Africa Market Value Y-o-Y Growth Trend Analysis (2019 to 2032) by End User

Figure 101: Middle East & Africa Market Value Share Analysis (2022 to 2032) by End User

Figure 102: Middle East & Africa Market Attractiveness by End User

Figure 103: Middle East & Africa Market Value Y-o-Y Growth Trend Analysis (2019 to 2032) by Country

Figure 104: Middle East & Africa Market Value Share Analysis (2022 to 2032) by Country

Figure 105: Middle East & Africa Market Attractiveness by Country

Figure 106: GCC Countries Market Absolute $ Opportunity (US$ Million), 2017 to 2032

Figure 107: North Africa Market Absolute $ Opportunity (US$ Million), 2017 to 2032

Figure 108: South Africa Market Absolute $ Opportunity (US$ Million), 2017 to 2032

Figure 109: Turkey Market Absolute $ Opportunity (US$ Million), 2017 to 2032

Figure 110: Rest of Middle East & Africa Market Absolute $ Opportunity (US$ Million), 2017 to 2032

Figure 111: Global Market Value (US$ Million), 2017 to 2021

Figure 112: Global Market Value (US$ Million), 2022 to 2032

Figure 113: Global Market Size (US$ Million) and Y-o-Y Growth Rate from 2022 to 2032

Figure 114: Global Market Value (US$ Million), 2017 to 2021

Figure 115: Global Market Value (US$ Million), 2022 to 2032

Figure 116: Global Market Size (US$ Million) and Y-o-Y Growth Rate from 2022 to 2032

Figure 117: Global Market Size and Y-o-Y Growth Rate from 2022 to 2032

Figure 118: Global Market Value Y-o-Y Growth Trend Analysis (2019 to 2032) Tool Type

Figure 119: Global Market Value Share Analysis (2022 to 2032) Tool Type

Figure 120: Global Market Attractiveness Tool Type

Figure 121: Global Market Value Y-o-Y Growth Trend Analysis (2019 to 2032) by End User

Figure 122: Global Market Value Share Analysis (2022 to 2032) by End User

Figure 123: Global Market Attractiveness by End User

Figure 124: Global Market Value Y-o-Y Growth Trend Analysis (2019 to 2032) by Region

Figure 125: Global Market Value Share Analysis (2022 to 2032) by Region

Figure 126:Global Market Attractiveness by Region

Figure 127: North America Market Absolute $ Opportunity (US$ Million), 2017 to 2032

Figure 128: Latin America Market Absolute $ Opportunity (US$ Million), 2017 to 2032

Figure 129: Europe Market Absolute $ Opportunity (US$ Million), 2017 to 2032

Figure 130: East Asia Market Absolute $ Opportunity (US$ Million), 2017 to 2032

Figure 131: South Asia & Pacific Market Absolute $ Opportunity (US$ Million), 2017 to 2032

Figure 132: Middle East & Africa Market Absolute $ Opportunity (US$ Million), 2017 to 2032

Figure 133: North America Market Value (US$ Million), 2017 to 2021

Figure 134: North America Market Value (US$ Million), 2022 to 2032

Figure 135: North America Market Value Y-o-Y Growth Trend Analysis (2019 to 2032) Tool Type

Figure 136: North America Market Value Share Analysis (2022 to 2032) Tool Type

Figure 137: North America Market Attractiveness Tool Type

Figure 138: North America Market Value Y-o-Y Growth Trend Analysis (2019 to 2032) by End User

Figure 139: North America Market Value Share Analysis (2022 to 2032) by End User

Figure 140: North America Market Attractiveness by End User

Figure 150: North America Market Value Y-o-Y Growth Trend Analysis (2019 to 2032) by Country

Figure 151: North America Market Value Share Analysis (2022 to 2032) by Country

Figure 152: North America Market Attractiveness by Country

Figure 153:USA Market Absolute $ Opportunity (US$ Million), 2017 to 2032

Figure 155:Canada Market Absolute $ Opportunity (US$ Million), 2017 to 2032

Figure 156:Latin America Market Value (US$ Million), 2017 to 2021

Figure 157:Latin America Market Value (US$ Million), 2022 to 2032

Figure 158:Latin America Market Value Y-o-Y Growth Trend Analysis (2019 to 2032) Tool Type

Figure 159:Latin America Market Value Share Analysis (2022 to 2032) Tool Type

Figure 160:Latin America Market Attractiveness Tool Type

Figure 161:Latin America Market Value Y-o-Y Growth Trend Analysis (2019 to 2032) by End User

Figure 162:Latin America Market Value Share Analysis (2022 to 2032) by End User

Recommendations

Technology

Crypto Wallets Market

Published : August 2023

Technology

Blockchain Technology Market

Published : January 2023

Technology

Crypto Trading Platform Market

Published : October 2022

Explore Technology Insights

View Reports

NFT Analytics Tools Market