NFT Dapps Market Forecast and Outlook 2025 to 2035

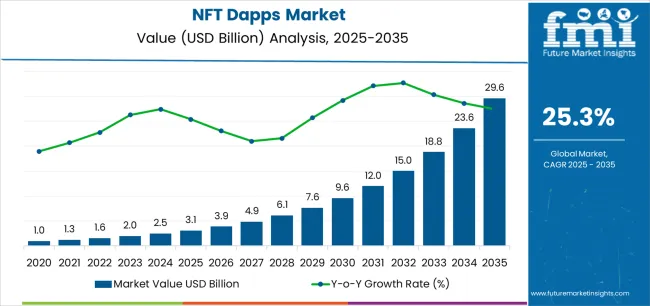
The NFT Dapps market is expected to grow significantly from USD 3.1 billion in 2025 to USD 29.5 billion by 2035, reflecting a remarkable CAGR of 25.3%. This rapid growth is primarily driven by the increasing popularity of non-fungible tokens (NFTs) and decentralized applications (Dapps) in industries such as art, gaming, and digital collectibles. As blockchain technology continues to evolve, NFT Dapps are becoming more accessible and integral to various sectors, attracting both creators and investors. The rise of digital ownership and the growing demand for unique digital assets are key drivers of this market.

The NFT Dapps market will also benefit from the expansion of decentralized finance (DeFi) ecosystems, which provide greater security and transparency. As more industries explore the potential of NFTs for tokenizing assets such as virtual real estate, music, and intellectual property, the market will continue to gain momentum. With growing adoption among both consumers and businesses, the NFT Dapps market is expected to see continuous innovation, offering new ways to monetize digital assets and engage with users in decentralized environments. This shift will ensure the market’s robust growth through 2035.
Quick Stats of the NFT Dapps Market

  • NFT Dapps Market Value (2025): USD 3.1 billion
  • NFT Dapps Market Forecast Value (2035): USD 29.5 billion
  • NFT Dapps Market Forecast CAGR (2025-2035): 25.3%
  • NFT Dapps Market Leading Segment: Digital Art & Collectibles (25%)
  • NFT Dapps Market Key Growth Regions: China, India, Germany, Brazil, U.S., U.K., Japan
  • NFT Dapps Market Top Players: OpenSea, Magic Eden, DraftKings Marketplace, Floor, Hyperspace, NiftyGateway, X2Y2, Exchange Art, Tensor, Superfarm, LooksRare, Genie, Frakt, Ethernity, 3six9, GME, OverHyped, Zora, trader.xyz, Rarible, Foundation, Sudoswap, Fractal, Solanart, Solsea, DigitalEyes, FormFunction, Alpha Art, MakersPlace

Nft Dapps Market Market Value Analysis

NFT Dapps Market Year-over-Year Forecast (2025–2035)

From 2025 to 2030, the market is projected to grow from USD 3.1 billion to USD 7.6 billion, an increase of USD 4.5 billion. This early phase will be driven by expanding use cases for NFTs in digital art, gaming, and collectibles, as well as increased investment in blockchain-based technologies. The market will experience rapid adoption as more users and developers explore the potential of decentralized applications and the broader NFT ecosystem.

Between 2030 and 2035, the market will expand from USD 7.6 billion to USD 29.5 billion, adding USD 21.9 billion in value. This surge will be fueled by the broader integration of NFTs into various industries, including virtual real estate, music, and intellectual property rights. As the market matures, NFTs will play a central role in transforming how digital ownership is managed, allowing for new monetization models and enhanced user engagement. The increasing adoption of NFT Dapps for various applications will drive continuous innovation and market expansion through 2035.

Metric 

Metric  Value 
Market Value (2025)  USD 3.1 billion 
Market Forecast Value (2035)  USD 29.5 nillion 
Forecast CAGR (2025-2035)  25.3% 

What is driving the growth of the NFT Dapps market?

The NFT Dapps market is experiencing rapid growth due to the increasing adoption of blockchain technology and decentralized applications (Dapps), particularly in the areas of digital art, gaming, and virtual goods. The growing interest in NFTs (non-fungible tokens) as a unique and verifiable digital asset has attracted both retail investors and institutions, further propelling the market. Digital art & collectibles, which hold a significant share in the market, have become a mainstream investment class, with artists and collectors flocking to NFT platforms to buy and sell one-of-a-kind digital pieces. Additionally, games & virtual worlds, metaverse projects, and virtual goods are expanding, further increasing the demand for NFT marketplaces and Dapps. The market is also benefiting from rising interest in fan economy projects and digital identities, which are being integrated with social platforms and sports. Governments and enterprises are exploring blockchain technology for digital assets, which further drives the market. With increased institutional investment and growing consumer adoption of NFT Dapps, the market is poised for explosive growth, as these technologies redefine how digital assets are bought, sold, and traded.

What are the key segments of the NFT Dapps market?

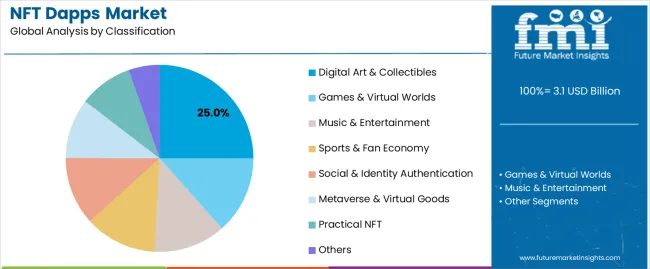
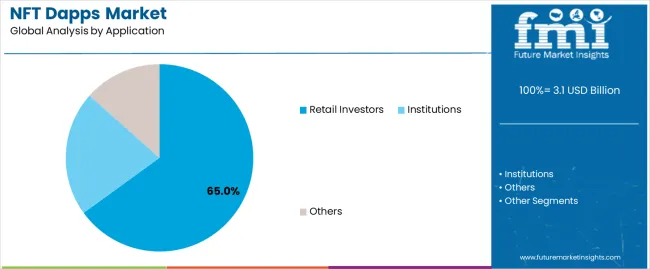
The NFT Dapps market is segmented by classification and application. By classification, the market includes digital art & collectibles, games & virtual worlds, music & entertainment, sports & fan economy, social & identity authentication, metaverse & virtual goods, practical NFTs, and others. Among these, digital art & collectibles holds the largest share due to growing interest in NFT art and its adoption as a mainstream investment class. By application, the market is categorized into retail investors, institutions, and others, with retail investors leading the market, driven by the ease of access to NFT platforms and marketplaces. Key regions driving the market include China, India, Germany, and the U.S., with these regions showing strong growth in NFT adoption due to their large populations of digital consumers and institutional players.
Why is digital art & collectibles the leading segment in the NFT Dapps market?

Nft Dapps Market Analysis By Classification

The digital art & collectibles segment is the largest in the NFT Dapps market, accounting for 25% of the market share. This dominance is driven by the increasing popularity of NFT art, where creators tokenize their digital artworks, providing buyers with exclusive ownership of unique pieces. Digital art has become a recognized form of investment, attracting both individual collectors and institutional investors. The growth of platforms like OpenSea, Nifty Gateway, and Rarible has facilitated the buying, selling, and auctioning of digital collectibles in a secure, blockchain-based environment.

These platforms enable artists to retain control over their work and receive royalties from secondary sales, creating a new revenue stream for creators. The mainstream adoption of NFT art has also been bolstered by celebrity endorsements and high-profile auctions, which have driven media attention and expanded interest among retail investors. Furthermore, as more artists and creators enter the space, the variety of NFT art has increased, attracting more buyers seeking unique digital pieces. This segment's growth is expected to continue as NFTs increasingly gain acceptance as both artistic expression and investment vehicles, expanding the overall market for NFT Dapps.
Why are retail investors the dominant application segment in the NFT Dapps market?

Nft Dapps Market Analysis By Application

The retail investors segment is the largest in the NFT Dapps market, holding approximately 65% of the market share. This dominance can be attributed to the easy access to NFT marketplaces and the growing interest of individual consumers in digital collectibles and NFTs as an alternative asset class. Platforms like OpenSea, Magic Eden, and Floor make it simple for retail investors to browse, purchase, and sell NFTs in various categories, from digital art to gaming assets and virtual real estate.

The rise of social media and celebrity endorsements has also contributed to the growth of NFTs in the retail space, making them more visible and attractive to a wider audience. Retail investors are particularly drawn to NFTs because of the potential for high returns, as witnessed in the sale of rare digital art and limited-edition collectibles. Moreover, NFTs allow individuals to participate in the emerging metaverse and virtual worlds, further driving their popularity among consumers seeking new forms of digital ownership. As blockchain technology becomes more mainstream and NFT marketplaces continue to evolve, the dominance of retail investors in the NFT Dapps market is expected to grow, further fueling the expansion of this market.

What are the drivers, restraints, and key trends of the NFT Dapps market?

The NFT Dapps market is growing rapidly due to increasing consumer interest in digital assets, particularly in sectors such as digital art, gaming, and virtual goods. The rising adoption of blockchain technology and decentralized applications (Dapps) is enabling the growth of NFT platforms, offering secure ownership and verifiable scarcity. Additionally, both retail investors and institutions are showing strong interest in NFTs as an investment vehicle. Emerging markets and metaverse adoption are further propelling growth in this market, as more users and investors participate in the expanding NFT ecosystem.

What are the key drivers of the NFT Dapps market?

The key drivers of the NFT Dapps market include the growing demand for blockchain technology in various applications such as digital art, gaming, and virtual goods. NFTs offer a new way to verify ownership and create scarcity in the digital world, which is highly attractive for collectors and investors. The increasing use of NFTs in the metaverse, virtual worlds, and fan economies is driving significant market growth. Furthermore, the rise of retail investors and institutional interest in NFTs, particularly in digital art collectibles, is fueling the adoption of NFT Dapps across different sectors. As blockchain technology becomes more mainstream and user-friendly, the market is expected to continue expanding rapidly.

What are the key restraints in the NFT Dapps market?

Despite strong growth, the NFT Dapps market faces several challenges. One of the main restraints is the volatility of NFT prices, which can make it difficult for investors to predict returns, leading to uncertainty in the market. This volatility may deter some potential buyers from entering the space. Additionally, environmental concerns related to the energy consumption of blockchain networks, particularly those using proof-of-work protocols, are raising awareness about the sustainability of NFT platforms. There is also regulatory uncertainty, as governments work to develop clear guidelines for the NFT market and digital assets, which could affect investor confidence and market stability.

What are the key trends in the NFT Dapps market?

Key trends in the NFT Dapps market include the growing integration of NFTs in the metaverse, where virtual real estate and assets are increasingly being tokenized. The gaming sector is also a major trend, with play-to-earn models gaining traction, allowing players to own, buy, and sell in-game items as NFTs. Eco-friendly NFTs are becoming more popular, with an emphasis on blockchain solutions that are energy-efficient and sustainable. Moreover, personalized NFTs, enabled by 3D printing and customization, are gaining traction in the digital art space. As more industries adopt NFTs and blockchain technologies, the NFT Dapps market is expected to evolve further, offering new opportunities for investors, artists, and consumers alike.

What is the country-wise analysis of the NFT Dapps market?

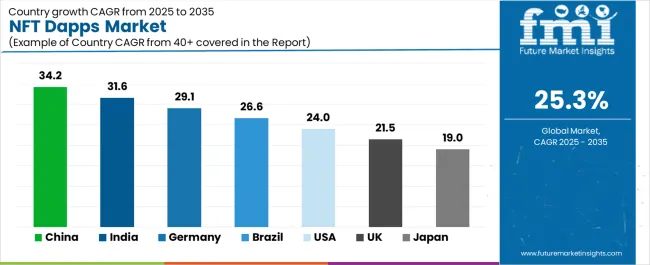
The NFT Dapps market is experiencing strong growth globally, with key regions like China, India, Germany, and the U.S. leading the charge due to their rapidly expanding blockchain ecosystems and growing interest in NFTs. China and India are seeing significant growth due to increasing adoption of digital assets, NFT marketplaces, and virtual goods. Meanwhile, Germany, Brazil, the U.K., and Japan are following suit, with expanding demand driven by the gaming, digital art, and metaverse sectors. Retail investors are dominating these markets, while institutional investments are also growing in some regions, reflecting the mainstream acceptance of NFTs across industries. As these countries continue to embrace blockchain technology and NFT applications, the market is expected to continue growing at a rapid pace, especially in Asia-Pacific and North America.
Nft Dapps Market Cagr Analysis By Country

Country CAGR (%)
China 34.2
India 31.6
Germany 29.1
Brazil 26.6
U.S. 24
U.K. 21.5
Japan 19

How is China leading the NFT Dapps market growth?

China is expected to experience an impressive CAGR of 34.2% in the NFT Dapps market, driven by its large and growing digital consumer base and blockchain adoption. China is at the forefront of technological advancements, with a rapidly growing number of NFT platforms and blockchain projects catering to gaming, virtual goods, and digital art. As the country leads in tech innovation, NFTs are increasingly being integrated into social media platforms and entertainment. Additionally, China’s vast e-commerce market plays a significant role in boosting NFT Dapps, providing a new avenue for virtual asset sales. Regulatory uncertainty remains a challenge in China, but the demand for NFTs remains strong, particularly in the gaming and virtual collectibles sectors. As NFT adoption becomes more mainstream, China’s blockchain technology infrastructure and innovative digital platforms will continue to drive growth in the global market.

What is driving India's rapid growth in the NFT Dapps market?

India is projected to experience a CAGR of 31.6% in the NFT Dapps market, reflecting a surge in interest in digital assets and blockchain applications. India’s young and tech-savvy population is driving the adoption of NFT platforms, especially in the gaming and digital art sectors. As the demand for NFT-based collectibles and virtual goods grows, Indian investors and creators are increasingly participating in the NFT ecosystem. The country’s rapidly expanding blockchain infrastructure and increasing access to decentralized finance (DeFi) platforms are contributing to the rise of NFT Dapps. Additionally, NFT marketplaces have gained popularity, with many local players emerging to cater to the growing demand. As blockchain technology continues to evolve, India is becoming a major player in the NFT space, thanks to its strong emphasis on digital innovation and growing investment in NFT platforms.

What is contributing to Germany’s growth in the NFT Dapps market?

Germany is expected to see a CAGR of 29.1% in the NFT Dapps market, with significant growth driven by its robust blockchain ecosystem and tech-driven industries. The country’s strong interest in digital art and NFT-based collectibles is fueling the market, as German consumers and investors embrace the unique value propositions that NFTs offer in sectors like art, gaming, and virtual goods. Germany’s reputation as a leader in innovation and sustainability is also contributing to the growth of eco-friendly NFTs, made possible by energy-efficient blockchain solutions. Moreover, the increasing adoption of NFTs in the metaverse and virtual economies in Germany is accelerating the demand for NFT Dapps, where users can engage in the buying, selling, and trading of virtual assets. As the country continues to support blockchain innovation, Germany is poised to remain a major hub for NFT growth in Europe.

What factors are driving Brazil’s growth in the NFT Dapps market?

Brazil is projected to grow at a CAGR of 26.6% in the NFT Dapps market, driven by its increasing participation in the global digital economy. Brazil’s growing gaming community, along with a rising interest in NFT art and digital collectibles, is fueling demand for NFT platforms. As blockchain technology becomes more widely adopted, Brazil is seeing a surge in NFT transactions, with retail investors flocking to NFT marketplaces to engage in digital asset trading. Moreover, Brazil’s growing crypto market and expanding mobile internet access are contributing to the widespread adoption of NFT Dapps in virtual goods and social economy applications. The lower barriers to entry for local creators are also fostering a thriving market for NFT-based digital art. As more Brazilian consumers and entrepreneurs enter the space, Brazil is expected to continue its strong growth trajectory in the NFT market.

What is shaping the U.S. growth in the NFT Dapps market?

The U.S. is expected to grow at a CAGR of 24% in the NFT Dapps market, thanks to its advanced blockchain infrastructure and strong presence in the digital asset sector. The country remains a global leader in NFT platforms, with major marketplaces like OpenSea, Magic Eden, and Rarible driving widespread adoption of NFTs. Retail investors continue to dominate the market, while institutional interest is also increasing as NFTs are viewed as alternative assets. The U.S. is a key player in the development of the metaverse, where virtual assets and NFTs are integrated into gaming and digital entertainment. Additionally, the rise of NFT collectibles in industries like sports and fashion is further contributing to the market's growth. As the U.S. blockchain market evolves, the country’s regulatory clarity and growing institutional adoption will continue to shape the future of the NFT Dapps market.

What factors are influencing the U.K.'s growth in the NFT Dapps market?

The U.K. is projected to grow at a CAGR of 21.5% in the NFT Dapps market, with growth driven by the country’s strong digital art community and increasing interest in virtual economies. The U.K. has become a hub for NFT marketplaces and creative digital projects, where artists and creators use blockchain platforms to sell NFT art and collectibles. The growth of NFTs in gaming and the fan economy is also contributing to the market's expansion, as U.K. consumers embrace the opportunities offered by NFT Dapps to trade digital assets. Furthermore, institutional investors in the U.K. are showing increasing interest in NFTs as a means to diversify their portfolios. With the U.K.’s commitment to blockchain innovation, the country is well-positioned to maintain strong growth in the NFT Dapps market over the next several years.
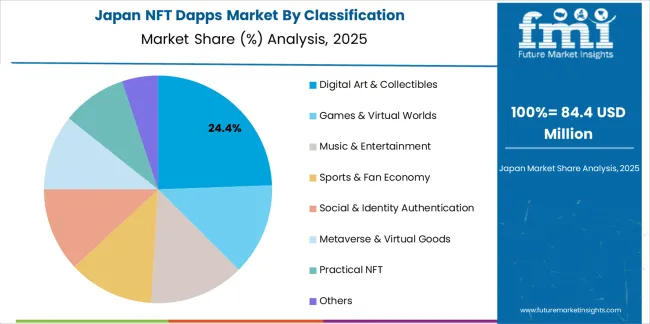
What factors are shaping Japan’s growth in the NFT Dapps market?

Nft Dapps Market Japan Market Share Analysis By Classification

Japan is expected to grow at a CAGR of 19% in the NFT Dapps market, driven by the country’s strong gaming culture and the rise of NFT collectibles in the entertainment and digital art sectors. Japan’s gaming industry, one of the largest in the world, is embracing NFTs as a way to enable users to own and trade virtual assets within games and virtual worlds. The growing interest in NFT art and digital collectibles in Japan is also contributing to the market's expansion. Additionally, Japan’s focus on technology and innovation, combined with increasing interest in the metaverse, is boosting the adoption of NFT Dapps. As Japan’s blockchain infrastructure continues to evolve and gain mainstream acceptance, the demand for NFT platforms and decentralized applications will continue to rise, making Japan a key player in the global NFT Dapps market.

What is the competitive landscape of the NFT Dapps market?

The NFT Dapps market is highly competitive, with leading platforms such as OpenSea, Magic Eden, and Rarible capturing a significant share of the market. OpenSea, which holds about 20% of the market, is the largest NFT marketplace, offering a wide range of digital assets from artworks to virtual real estate. Other key players such as Nifty Gateway, X2Y2, and DraftKings Marketplace focus on creating specialized platforms that cater to specific types of NFTs, including sports collectibles and exclusive art collections. As demand for NFT Dapps grows, these platforms are focusing on innovation, user experience, and expanding their ecosystem to stay ahead.

Regional players also play a key role in the competitive landscape, as local NFT platforms target specific geographic markets. Companies such as Hyperspace, Floor, and Superfarm are carving out niches in the market, particularly within gaming and virtual worlds, where NFT-based assets are integral. Partnerships and acquisitions in the NFT space are common, as companies strive to increase their product offerings and expand into new markets. As the market continues to grow, competition will intensify, with both established players and emerging startups seeking to dominate the NFT Dapps ecosystem.
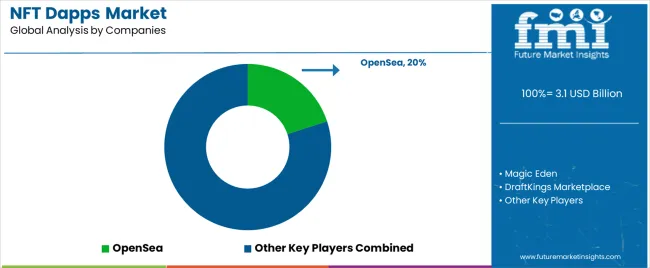
Key Players in the NFT Dapps Market

Nft Dapps Market Analysis By Company

  • OpenSea
  • Magic Eden
  • DraftKings Marketplace
  • Floor
  • Hyperspace
  • NiftyGateway
  • X2Y2
  • Exchange Art
  • Tensor
  • Superfarm
  • LooksRare
  • Genie
  • Frakt
  • Ethernity
  • 3six9
  • GME
  • OverHyped
  • Zora
  • trader.xyz
  • Rarible
  • Foundation
  • Sudoswap
  • Fractal
  • Solanart
  • Solsea
  • DigitalEyes
  • FormFunction
  • Alpha Art
  • MakersPlace
  • Mintable

Scope of the Report

Items Details
Quantitative Units USD Billion
Regions Covered China, India, Germany, Brazil, U.S., U.K., Japan
Classification Digital Art & Collectibles, Games & Virtual Worlds, Music & Entertainment, Sports & Fan Economy, Social & Identity Authentication, Metaverse & Virtual Goods, Practical NFT, Others
Application Retail Investors, Institutions, Others
Key Companies Profiled OpenSea, Magic Eden, DraftKings Marketplace, Floor, Hyperspace, NiftyGateway, X2Y2, Exchange Art, Tensor, Superfarm, LooksRare, Genie, Frakt, Ethernity, 3six9, GME, OverHyped, Zora, trader.xyz, Rarible, Foundation, Sudoswap, Fractal, Solanart, Solsea, DigitalEyes, FormFunction, Alpha Art, MakersPlace
Additional Attributes The market analysis includes dollar sales by classification and application categories. It also covers regional adoption trends across major markets like China, India, Germany, and the U.S. The competitive landscape features key players from the NFT Dapp ecosystem, focusing on innovations in digital art, collectibles, and gaming platforms. Trends in demand for NFT-based projects, as well as their integration into virtual worlds, social networks, and the metaverse, are also explored.

Key Segments of the NFT Dapps Market

Classification:

  • Digital Art & Collectibles
  • Games & Virtual Worlds
  • Music & Entertainment
  • Sports & Fan Economy
  • Social & Identity Authentication
  • Metaverse & Virtual Goods
  • Practical NFT
  • Others

Application:

  • Retail Investors
  • Institutions
  • Others

Region:

  • Asia Pacific
    • China
    • Japan
    • South Korea
    • India
    • Australia & New Zealand
    • ASEAN
    • Rest of Asia Pacific
  • Europe
    • Germany
    • United Kingdom
    • France
    • Italy
    • Spain
    • Nordic
    • BENELUX
    • Rest of Europe
  • North America
    • United States
    • Canada
    • Mexico
  • Latin America
    • Brazil
    • Chile
    • Rest of Latin America
  • Middle East & Africa
    • Kingdom of Saudi Arabia
    • Other GCC Countries
    • Turkey
    • South Africa
    • Other African Union
    • Rest of Middle East & Africa

Frequently Asked Questions

How big is the NFT dapps market in 2025?

The global NFT dapps market is estimated to be valued at USD 3.1 billion in 2025.

What will be the size of NFT dapps market in 2035?

The market size for the NFT dapps market is projected to reach USD 29.6 billion by 2035.

How much will be the NFT dapps market growth between 2025 and 2035?

The NFT dapps market is expected to grow at a 25.3% CAGR between 2025 and 2035.

What are the key product types in the NFT dapps market?

The key product types in NFT dapps market are digital art & collectibles, games & virtual worlds, music & entertainment, sports & fan economy, social & identity authentication, metaverse & virtual goods, practical NFT and others.

Which application segment to contribute significant share in the NFT dapps market in 2025?

In terms of application, retail investors segment to command 65.0% share in the NFT dapps market in 2025.

Table of Content

  1. Executive Summary
    • Global Market Outlook
    • Demand to side Trends
    • Supply to side Trends
    • Technology Roadmap Analysis
    • Analysis and Recommendations
  2. Market Overview
    • Market Coverage / Taxonomy
    • Market Definition / Scope / Limitations
  3. Market Background
    • Market Dynamics
      • Drivers
      • Restraints
      • Opportunity
      • Trends
    • Scenario Forecast
      • Demand in Optimistic Scenario
      • Demand in Likely Scenario
      • Demand in Conservative Scenario
    • Opportunity Map Analysis
    • Product Life Cycle Analysis
    • Supply Chain Analysis
    • Investment Feasibility Matrix
    • Value Chain Analysis
    • PESTLE and Porter’s Analysis
    • Regulatory Landscape
    • Regional Parent Market Outlook
    • Production and Consumption Statistics
    • Import and Export Statistics
  4. Global Market Analysis 2020 to 2024 and Forecast, 2025 to 2035
    • Historical Market Size Value (USD Million) Analysis, 2020 to 2024
    • Current and Future Market Size Value (USD Million) Projections, 2025 to 2035
      • Y to o to Y Growth Trend Analysis
      • Absolute $ Opportunity Analysis
  5. Global Market Pricing Analysis 2020 to 2024 and Forecast 2025 to 2035
  6. Global Market Analysis 2020 to 2024 and Forecast 2025 to 2035, By Classification
    • Introduction / Key Findings
    • Historical Market Size Value (USD Million) Analysis By Classification , 2020 to 2024
    • Current and Future Market Size Value (USD Million) Analysis and Forecast By Classification , 2025 to 2035
      • Digital Art & Collectibles
      • Games & Virtual Worlds
      • Music & Entertainment
      • Sports & Fan Economy
      • Social & Identity Authentication
      • Metaverse & Virtual Goods
      • Practical NFT
      • Others
    • Y to o to Y Growth Trend Analysis By Classification , 2020 to 2024
    • Absolute $ Opportunity Analysis By Classification , 2025 to 2035
  7. Global Market Analysis 2020 to 2024 and Forecast 2025 to 2035, By Application
    • Introduction / Key Findings
    • Historical Market Size Value (USD Million) Analysis By Application, 2020 to 2024
    • Current and Future Market Size Value (USD Million) Analysis and Forecast By Application, 2025 to 2035
      • Retail Investors
      • Institutions
      • Others
    • Y to o to Y Growth Trend Analysis By Application, 2020 to 2024
    • Absolute $ Opportunity Analysis By Application, 2025 to 2035
  8. Global Market Analysis 2020 to 2024 and Forecast 2025 to 2035, By Region
    • Introduction
    • Historical Market Size Value (USD Million) Analysis By Region, 2020 to 2024
    • Current Market Size Value (USD Million) Analysis and Forecast By Region, 2025 to 2035
      • North America
      • Latin America
      • Western Europe
      • Eastern Europe
      • East Asia
      • South Asia and Pacific
      • Middle East & Africa
    • Market Attractiveness Analysis By Region
  9. North America Market Analysis 2020 to 2024 and Forecast 2025 to 2035, By Country
    • Historical Market Size Value (USD Million) Trend Analysis By Market Taxonomy, 2020 to 2024
    • Market Size Value (USD Million) Forecast By Market Taxonomy, 2025 to 2035
      • By Country
        • USA
        • Canada
        • Mexico
      • By Classification
      • By Application
    • Market Attractiveness Analysis
      • By Country
      • By Classification
      • By Application
    • Key Takeaways
  10. Latin America Market Analysis 2020 to 2024 and Forecast 2025 to 2035, By Country
    • Historical Market Size Value (USD Million) Trend Analysis By Market Taxonomy, 2020 to 2024
    • Market Size Value (USD Million) Forecast By Market Taxonomy, 2025 to 2035
      • By Country
        • Brazil
        • Chile
        • Rest of Latin America
      • By Classification
      • By Application
    • Market Attractiveness Analysis
      • By Country
      • By Classification
      • By Application
    • Key Takeaways
  11. Western Europe Market Analysis 2020 to 2024 and Forecast 2025 to 2035, By Country
    • Historical Market Size Value (USD Million) Trend Analysis By Market Taxonomy, 2020 to 2024
    • Market Size Value (USD Million) Forecast By Market Taxonomy, 2025 to 2035
      • By Country
        • Germany
        • UK
        • Italy
        • Spain
        • France
        • Nordic
        • BENELUX
        • Rest of Western Europe
      • By Classification
      • By Application
    • Market Attractiveness Analysis
      • By Country
      • By Classification
      • By Application
    • Key Takeaways
  12. Eastern Europe Market Analysis 2020 to 2024 and Forecast 2025 to 2035, By Country
    • Historical Market Size Value (USD Million) Trend Analysis By Market Taxonomy, 2020 to 2024
    • Market Size Value (USD Million) Forecast By Market Taxonomy, 2025 to 2035
      • By Country
        • Russia
        • Poland
        • Hungary
        • Balkan & Baltic
        • Rest of Eastern Europe
      • By Classification
      • By Application
    • Market Attractiveness Analysis
      • By Country
      • By Classification
      • By Application
    • Key Takeaways
  13. East Asia Market Analysis 2020 to 2024 and Forecast 2025 to 2035, By Country
    • Historical Market Size Value (USD Million) Trend Analysis By Market Taxonomy, 2020 to 2024
    • Market Size Value (USD Million) Forecast By Market Taxonomy, 2025 to 2035
      • By Country
        • China
        • Japan
        • South Korea
      • By Classification
      • By Application
    • Market Attractiveness Analysis
      • By Country
      • By Classification
      • By Application
    • Key Takeaways
  14. South Asia and Pacific Market Analysis 2020 to 2024 and Forecast 2025 to 2035, By Country
    • Historical Market Size Value (USD Million) Trend Analysis By Market Taxonomy, 2020 to 2024
    • Market Size Value (USD Million) Forecast By Market Taxonomy, 2025 to 2035
      • By Country
        • India
        • ASEAN
        • Australia & New Zealand
        • Rest of South Asia and Pacific
      • By Classification
      • By Application
    • Market Attractiveness Analysis
      • By Country
      • By Classification
      • By Application
    • Key Takeaways
  15. Middle East & Africa Market Analysis 2020 to 2024 and Forecast 2025 to 2035, By Country
    • Historical Market Size Value (USD Million) Trend Analysis By Market Taxonomy, 2020 to 2024
    • Market Size Value (USD Million) Forecast By Market Taxonomy, 2025 to 2035
      • By Country
        • Kingdom of Saudi Arabia
        • Other GCC Countries
        • Turkiye
        • South Africa
        • Other African Union
        • Rest of Middle East & Africa
      • By Classification
      • By Application
    • Market Attractiveness Analysis
      • By Country
      • By Classification
      • By Application
    • Key Takeaways
  16. Key Countries Market Analysis
    • USA
      • Pricing Analysis
      • Market Share Analysis, 2024
        • By Classification
        • By Application
    • Canada
      • Pricing Analysis
      • Market Share Analysis, 2024
        • By Classification
        • By Application
    • Mexico
      • Pricing Analysis
      • Market Share Analysis, 2024
        • By Classification
        • By Application
    • Brazil
      • Pricing Analysis
      • Market Share Analysis, 2024
        • By Classification
        • By Application
    • Chile
      • Pricing Analysis
      • Market Share Analysis, 2024
        • By Classification
        • By Application
    • Germany
      • Pricing Analysis
      • Market Share Analysis, 2024
        • By Classification
        • By Application
    • UK
      • Pricing Analysis
      • Market Share Analysis, 2024
        • By Classification
        • By Application
    • Italy
      • Pricing Analysis
      • Market Share Analysis, 2024
        • By Classification
        • By Application
    • Spain
      • Pricing Analysis
      • Market Share Analysis, 2024
        • By Classification
        • By Application
    • France
      • Pricing Analysis
      • Market Share Analysis, 2024
        • By Classification
        • By Application
    • India
      • Pricing Analysis
      • Market Share Analysis, 2024
        • By Classification
        • By Application
    • ASEAN
      • Pricing Analysis
      • Market Share Analysis, 2024
        • By Classification
        • By Application
    • Australia & New Zealand
      • Pricing Analysis
      • Market Share Analysis, 2024
        • By Classification
        • By Application
    • China
      • Pricing Analysis
      • Market Share Analysis, 2024
        • By Classification
        • By Application
    • Japan
      • Pricing Analysis
      • Market Share Analysis, 2024
        • By Classification
        • By Application
    • South Korea
      • Pricing Analysis
      • Market Share Analysis, 2024
        • By Classification
        • By Application
    • Russia
      • Pricing Analysis
      • Market Share Analysis, 2024
        • By Classification
        • By Application
    • Poland
      • Pricing Analysis
      • Market Share Analysis, 2024
        • By Classification
        • By Application
    • Hungary
      • Pricing Analysis
      • Market Share Analysis, 2024
        • By Classification
        • By Application
    • Kingdom of Saudi Arabia
      • Pricing Analysis
      • Market Share Analysis, 2024
        • By Classification
        • By Application
    • Turkiye
      • Pricing Analysis
      • Market Share Analysis, 2024
        • By Classification
        • By Application
    • South Africa
      • Pricing Analysis
      • Market Share Analysis, 2024
        • By Classification
        • By Application
  17. Market Structure Analysis
    • Competition Dashboard
    • Competition Benchmarking
    • Market Share Analysis of Top Players
      • By Regional
      • By Classification
      • By Application
  18. Competition Analysis
    • Competition Deep Dive
      • OpenSea
        • Overview
        • Product Portfolio
        • Profitability by Market Segments (Product/Age /Sales Channel/Region)
        • Sales Footprint
        • Strategy Overview
          • Marketing Strategy
          • Product Strategy
          • Channel Strategy
      • Magic Eden
      • DraftKings Marketplace
      • Floor
      • Hyperspace
      • NiftyGateway
      • X2Y2
      • Exchange Art
      • Tensor
      • Superfarm
      • LooksRare
      • Genie
      • Frakt
      • Ethernity
      • 3six9
      • GME
      • OverHyped
      • Zora
      • trader.xyz
      • Rarible
  19. Assumptions & Acronyms Used
  20. Research Methodology

List of Tables

  • Table 1: Global Market Value (USD Million) Forecast by Region, 2020 to 2035
  • Table 2: Global Market Value (USD Million) Forecast by Classification , 2020 to 2035
  • Table 3: Global Market Value (USD Million) Forecast by Application, 2020 to 2035
  • Table 4: North America Market Value (USD Million) Forecast by Country, 2020 to 2035
  • Table 5: North America Market Value (USD Million) Forecast by Classification , 2020 to 2035
  • Table 6: North America Market Value (USD Million) Forecast by Application, 2020 to 2035
  • Table 7: Latin America Market Value (USD Million) Forecast by Country, 2020 to 2035
  • Table 8: Latin America Market Value (USD Million) Forecast by Classification , 2020 to 2035
  • Table 9: Latin America Market Value (USD Million) Forecast by Application, 2020 to 2035
  • Table 10: Western Europe Market Value (USD Million) Forecast by Country, 2020 to 2035
  • Table 11: Western Europe Market Value (USD Million) Forecast by Classification , 2020 to 2035
  • Table 12: Western Europe Market Value (USD Million) Forecast by Application, 2020 to 2035
  • Table 13: Eastern Europe Market Value (USD Million) Forecast by Country, 2020 to 2035
  • Table 14: Eastern Europe Market Value (USD Million) Forecast by Classification , 2020 to 2035
  • Table 15: Eastern Europe Market Value (USD Million) Forecast by Application, 2020 to 2035
  • Table 16: East Asia Market Value (USD Million) Forecast by Country, 2020 to 2035
  • Table 17: East Asia Market Value (USD Million) Forecast by Classification , 2020 to 2035
  • Table 18: East Asia Market Value (USD Million) Forecast by Application, 2020 to 2035
  • Table 19: South Asia and Pacific Market Value (USD Million) Forecast by Country, 2020 to 2035
  • Table 20: South Asia and Pacific Market Value (USD Million) Forecast by Classification , 2020 to 2035
  • Table 21: South Asia and Pacific Market Value (USD Million) Forecast by Application, 2020 to 2035
  • Table 22: Middle East & Africa Market Value (USD Million) Forecast by Country, 2020 to 2035
  • Table 23: Middle East & Africa Market Value (USD Million) Forecast by Classification , 2020 to 2035
  • Table 24: Middle East & Africa Market Value (USD Million) Forecast by Application, 2020 to 2035

List of Figures

  • Figure 1: Global Market Pricing Analysis
  • Figure 2: Global Market Value (USD Million) Forecast 2020-2035
  • Figure 3: Global Market Value Share and BPS Analysis by Classification , 2025 and 2035
  • Figure 4: Global Market Y-o-Y Growth Comparison by Classification , 2025-2035
  • Figure 5: Global Market Attractiveness Analysis by Classification
  • Figure 6: Global Market Value Share and BPS Analysis by Application, 2025 and 2035
  • Figure 7: Global Market Y-o-Y Growth Comparison by Application, 2025-2035
  • Figure 8: Global Market Attractiveness Analysis by Application
  • Figure 9: Global Market Value (USD Million) Share and BPS Analysis by Region, 2025 and 2035
  • Figure 10: Global Market Y-o-Y Growth Comparison by Region, 2025-2035
  • Figure 11: Global Market Attractiveness Analysis by Region
  • Figure 12: North America Market Incremental Dollar Opportunity, 2025-2035
  • Figure 13: Latin America Market Incremental Dollar Opportunity, 2025-2035
  • Figure 14: Western Europe Market Incremental Dollar Opportunity, 2025-2035
  • Figure 15: Eastern Europe Market Incremental Dollar Opportunity, 2025-2035
  • Figure 16: East Asia Market Incremental Dollar Opportunity, 2025-2035
  • Figure 17: South Asia and Pacific Market Incremental Dollar Opportunity, 2025-2035
  • Figure 18: Middle East & Africa Market Incremental Dollar Opportunity, 2025-2035
  • Figure 19: North America Market Value Share and BPS Analysis by Country, 2025 and 2035
  • Figure 20: North America Market Value Share and BPS Analysis by Classification , 2025 and 2035
  • Figure 21: North America Market Y-o-Y Growth Comparison by Classification , 2025-2035
  • Figure 22: North America Market Attractiveness Analysis by Classification
  • Figure 23: North America Market Value Share and BPS Analysis by Application, 2025 and 2035
  • Figure 24: North America Market Y-o-Y Growth Comparison by Application, 2025-2035
  • Figure 25: North America Market Attractiveness Analysis by Application
  • Figure 26: Latin America Market Value Share and BPS Analysis by Country, 2025 and 2035
  • Figure 27: Latin America Market Value Share and BPS Analysis by Classification , 2025 and 2035
  • Figure 28: Latin America Market Y-o-Y Growth Comparison by Classification , 2025-2035
  • Figure 29: Latin America Market Attractiveness Analysis by Classification
  • Figure 30: Latin America Market Value Share and BPS Analysis by Application, 2025 and 2035
  • Figure 31: Latin America Market Y-o-Y Growth Comparison by Application, 2025-2035
  • Figure 32: Latin America Market Attractiveness Analysis by Application
  • Figure 33: Western Europe Market Value Share and BPS Analysis by Country, 2025 and 2035
  • Figure 34: Western Europe Market Value Share and BPS Analysis by Classification , 2025 and 2035
  • Figure 35: Western Europe Market Y-o-Y Growth Comparison by Classification , 2025-2035
  • Figure 36: Western Europe Market Attractiveness Analysis by Classification
  • Figure 37: Western Europe Market Value Share and BPS Analysis by Application, 2025 and 2035
  • Figure 38: Western Europe Market Y-o-Y Growth Comparison by Application, 2025-2035
  • Figure 39: Western Europe Market Attractiveness Analysis by Application
  • Figure 40: Eastern Europe Market Value Share and BPS Analysis by Country, 2025 and 2035
  • Figure 41: Eastern Europe Market Value Share and BPS Analysis by Classification , 2025 and 2035
  • Figure 42: Eastern Europe Market Y-o-Y Growth Comparison by Classification , 2025-2035
  • Figure 43: Eastern Europe Market Attractiveness Analysis by Classification
  • Figure 44: Eastern Europe Market Value Share and BPS Analysis by Application, 2025 and 2035
  • Figure 45: Eastern Europe Market Y-o-Y Growth Comparison by Application, 2025-2035
  • Figure 46: Eastern Europe Market Attractiveness Analysis by Application
  • Figure 47: East Asia Market Value Share and BPS Analysis by Country, 2025 and 2035
  • Figure 48: East Asia Market Value Share and BPS Analysis by Classification , 2025 and 2035
  • Figure 49: East Asia Market Y-o-Y Growth Comparison by Classification , 2025-2035
  • Figure 50: East Asia Market Attractiveness Analysis by Classification
  • Figure 51: East Asia Market Value Share and BPS Analysis by Application, 2025 and 2035
  • Figure 52: East Asia Market Y-o-Y Growth Comparison by Application, 2025-2035
  • Figure 53: East Asia Market Attractiveness Analysis by Application
  • Figure 54: South Asia and Pacific Market Value Share and BPS Analysis by Country, 2025 and 2035
  • Figure 55: South Asia and Pacific Market Value Share and BPS Analysis by Classification , 2025 and 2035
  • Figure 56: South Asia and Pacific Market Y-o-Y Growth Comparison by Classification , 2025-2035
  • Figure 57: South Asia and Pacific Market Attractiveness Analysis by Classification
  • Figure 58: South Asia and Pacific Market Value Share and BPS Analysis by Application, 2025 and 2035
  • Figure 59: South Asia and Pacific Market Y-o-Y Growth Comparison by Application, 2025-2035
  • Figure 60: South Asia and Pacific Market Attractiveness Analysis by Application
  • Figure 61: Middle East & Africa Market Value Share and BPS Analysis by Country, 2025 and 2035
  • Figure 62: Middle East & Africa Market Value Share and BPS Analysis by Classification , 2025 and 2035
  • Figure 63: Middle East & Africa Market Y-o-Y Growth Comparison by Classification , 2025-2035
  • Figure 64: Middle East & Africa Market Attractiveness Analysis by Classification
  • Figure 65: Middle East & Africa Market Value Share and BPS Analysis by Application, 2025 and 2035
  • Figure 66: Middle East & Africa Market Y-o-Y Growth Comparison by Application, 2025-2035
  • Figure 67: Middle East & Africa Market Attractiveness Analysis by Application
  • Figure 68: Global Market - Tier Structure Analysis
  • Figure 69: Global Market - Company Share Analysis
Dashboard
Dashboard
Dashboard
Dashboard
Dashboard
Dashboard

Our Research Products

Full Research Suite

The "Full Research Suite" delivers actionable market intel, deep dives on markets or technologies, so clients act faster, cut risk, and unlock growth.

Competitor Leaderboard Report

The Leaderboard benchmarks and ranks top vendors, classifying them as Established Leaders, Leading Challengers, or Disruptors & Challengers.

Future Leaders Index

Locates where complements amplify value and substitutes erode it, forecasting net impact by horizon

Market Data & Forecasts

We deliver granular, decision-grade intel: market sizing, 5-year forecasts, pricing, adoption, usage, revenue, and operational KPIs—plus competitor tracking, regulation, and value chains—across 60 countries broadly.

Market Focus Report

Spot the shifts before they hit your P&L. We track inflection points, adoption curves, pricing moves, and ecosystem plays to show where demand is heading, why it is changing, and what to do next across high-growth markets and disruptive tech

Survey Report

Real-time reads of user behavior. We track shifting priorities, perceptions of today’s and next-gen services, and provider experience, then pace how fast tech moves from trial to adoption, blending buyer, consumer, and channel inputs with social signals (#WhySwitch, #UX).

Bespoke Reports

Partner with our analyst team to build a custom report designed around your business priorities. From analysing market trends to assessing competitors or crafting bespoke datasets, we tailor insights to your needs.

Supplier Intelligence

Discovery & Profiling

Capacity & Footprint

Performance & Risk

Compliance & Governance

Commercial Readiness

Who Supplies Whom

Scorecards & Shortlists

Playbooks & Docs

Category Intelligence

Definition & Scope

Demand & Use Cases

Cost Drivers

Market Structure

Supply Chain Map

Trade & Policy

Operating Norms

Deliverables

Buyer Intelligence

Account Basics

Spend & Scope

Procurement Model

Vendor Requirements

Terms & Policies

Entry Strategy

Pain Points & Triggers

Outputs

Pricing Analysis

Benchmarks

Trends

Should-Cost

Indexation

Landed Cost

Commercial Terms

Deliverables

Brand Analysis

Positioning & Value Prop

Share & Presence

Customer Evidence

Go-to-Market

Digital & Reputation

Compliance & Trust

KPIs & Gaps

Outputs

Full Research Suite comprises of:

Market outlook & trends analysis

Market outlook & trends analysis

Interviews & case studies

Interviews & case studies

Strategic recommendations

Strategic recommendations

Vendor profiles & capabilities analysis

Vendor profiles & capabilities analysis

5-year forecasts

5-year forecasts

8 regions and 60+ country-level data splits

8 regions and 60+ country-level data splits

Market segment data splits

Market segment data splits

12 months of continuous data updates

12 months of continuous data updates

DELIVERED AS:

PDF EXCEL ONLINE

Full Research Suite


$5000

$7500

$10000

Buy Report Now
Similar Industry Reports

Similar Industry Reports

NFT Lending Dapps Market

NFT Lending Dapps Market Size and Share Forecast Outlook 2025 to 2035

NFT-Backed Loans Market

NFT-Backed Loans Market Size and Share Forecast Outlook 2025 to 2035

NFT Analytics Tools Market

NFT Analytics Tools Market Size and Share Forecast Outlook 2025 to 2035

Cross-chain NFT Market

Cross-chain NFT Market Size and Share Forecast Outlook 2025 to 2035

Future Market Insights

NFT Dapps Market

Chat With MaRIA

Chat With

MaRIA

Hi There, I am MaRIA, Your Market Research Intelligence Assistant. How may I help you?