The Spatial Mass Spectrometry Market is estimated to be valued at USD 385.5 million in 2025 and is projected to reach USD 1532.7 million by 2035, registering a compound annual growth rate (CAGR) of 14.8% over the forecast period.
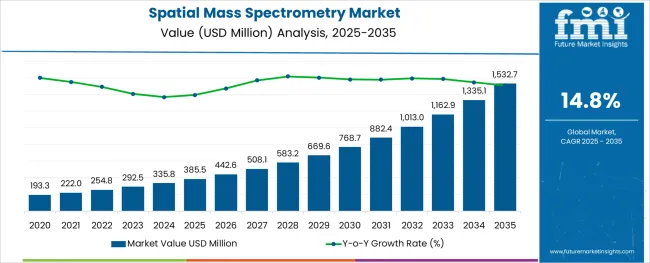
The spatial mass spectrometry market is expanding rapidly due to the increasing need for detailed molecular mapping in biological and clinical research. Advances in imaging and mass spectrometry technologies have enhanced the ability to analyze proteins and other biomolecules within tissue contexts, offering new insights into disease mechanisms and drug development.
Growing investments in proteomics research and personalized medicine have driven demand for sophisticated instruments that provide high spatial resolution and sensitivity. Academic and pharmaceutical research sectors are increasingly adopting spatial mass spectrometry for biomarker discovery and therapeutic target validation.
The integration of spatial proteomics with other omics data and digital analysis workflows is improving data accuracy and interpretability. As research complexity grows and demand for precise molecular imaging increases, market growth is expected to continue. Segmental growth is anticipated to be led by spatial proteomics technology, instruments as the primary product type, and instrumental analysis workflows which enable comprehensive molecular profiling.
The market is segmented by Technology, Product Type, Workflow, and Sample Type and region. By Technology, the market is divided into Spatial Proteomics, Spatial Transcriptomics, and Spatial Genomics. In terms of Product Type, the market is classified into Instruments, Consumables, and Software. Based on Workflow, the market is segmented into Instrumental Analysis, Sample Preparation, and Data Analysis. By Sample Type, the market is divided into FFPE and Fresh Frozen. Regionally, the market is classified into North America, Latin America, Western Europe, Eastern Europe, Balkan & Baltic Countries, Russia & Belarus, Central Asia, East Asia, South Asia & Pacific, and the Middle East & Africa.
Insights into the Technology Segment: Spatial Proteomics
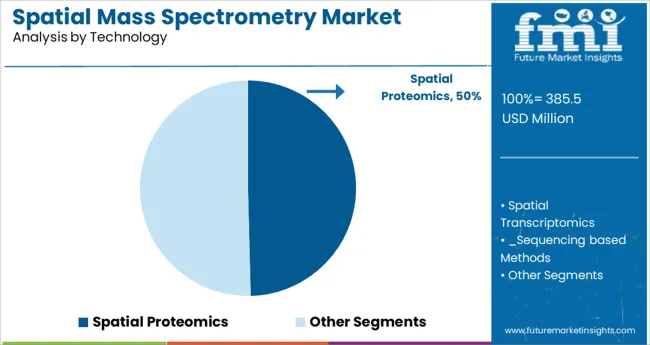
The Spatial Proteomics segment is projected to hold 49.6% of the spatial mass spectrometry market revenue in 2025, establishing itself as the leading technology. This segment has grown due to its ability to map proteins directly within biological tissues, providing critical spatial context that informs understanding of cellular functions and disease progression.
Researchers have increasingly utilized spatial proteomics to study heterogeneous tissue environments and identify localized molecular changes. The segment benefits from advancements in mass spectrometry imaging techniques that enhance resolution and throughput.
As biomedical research focuses on multi-omics integration and precision medicine, spatial proteomics is expected to remain the most sought-after technology for spatial molecular analysis.
spatial-mass-spectrometry-market-analysis-by-product-type

The Instruments segment is expected to contribute 52.3% of the spatial mass spectrometry market revenue in 2025, maintaining its lead among product types. Growth in this segment has been driven by the demand for high-performance mass spectrometers capable of spatially resolved analyses.
These instruments are essential for capturing accurate molecular data at cellular and subcellular levels. Continuous innovation in instrument sensitivity, speed, and imaging capabilities has expanded their application scope.
Investments in upgrading laboratory infrastructure and the increasing complexity of biological research have further supported instrument sales. As the foundation of spatial mass spectrometry workflows, instruments will continue to dominate the product landscape.
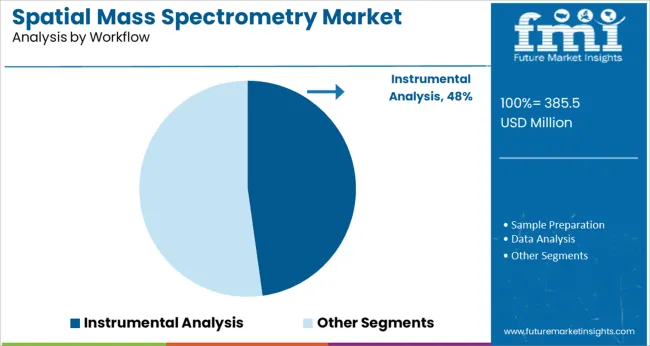
The Instrumental Analysis workflow segment is projected to hold 47.8% of the market revenue in 2025, underscoring its importance in spatial mass spectrometry applications. This workflow focuses on the direct acquisition and processing of mass spectral data from tissue samples, enabling detailed molecular characterization.
The segment growth is supported by advancements in data processing software and integration with imaging platforms, facilitating more precise and interpretable results. Instrumental analysis is favored for its ability to provide comprehensive molecular profiles critical for biomarker discovery and therapeutic research.
As workflows evolve to handle larger datasets and complex biological questions, instrumental analysis will remain central to the spatial mass spectrometry market.
As per the Spatial Mass Spectrometry Market research by Future Market Insights - a market research and competitive intelligence provider, historically, from 202032.77 to 2024532.7, market value of the Spatial Mass Spectrometry Market increased at around 1532.72.7% CAGR.
The factors pushing the Spatial Mass Spectrometry Market growth include the growing cancer prevalence and incidence rates. Geographical omics combines molecular analysis with geographical data on the location of a cell within a tissue.
Omics is a broad term that includes epigenomics, genomics, transcriptomics, lipidomics, proteomics, and metabolomics, among other studies. One of the key incentives for Spatial Mass Spectrometry is its high potential as diagnostic tools, notably in oncology.
The market's modest acceleration is attributable to technological advancements in Spatial Mass Spectrometry combined with aggressive spatial penetration expansion. Geographical analysis provides for improved molecular research regarding spatial information.
New Spatial Mass Spectrometry solutions and products are continually being developed by startups, established players, and expanding enterprises in the market. They're also participating in mergers and acquisitions, which is hastening the implementation of Spatial Mass Spectrometry around the world.
Companies are employing Spatial Mass Spectrometry to better comprehend molecules during clinical trial investigations. The usage of Spatial Mass Spectrometry in pharmaceutical research and discovery phases promotes substantial growth in the Spatial Mass Spectrometry market.
The rising adoption of spatial genomics and transcriptomics approaches for drug discovery and development, as well as increased R&D investments and public-private funding, are some of the primary drivers of the spatial genomics and transcriptomics market. In addition, the advent of technologically improved devices for spatial genomics analysis is fueling market expansion.
The market for spatial genomics and transcriptomics will grow fast as the potential of spatial genomic analysis with the growth in cancer diagnosis tools, and the arrival of the fourth generation of sequencing. Genome positioning is an intriguing novel biomarker that is required in a range of cancer types.
For a range of medical conditions, spatial patterns in the genome have been uncovered, leading to the use of spatial information as a diagnostic biomarker for a variety of diseases. Biomarkers are in high demand because they make it easier to distinguish between benign and malignant tumours. As a result, there is a growing demand for spatial genomics analysis as a cancer detection tool.
A variety of spatial transcriptomics techniques have been developed and successfully implemented to fulfil the growing demand for a deeper understanding of tissue profiling.
The use of Spatial Omics in drug discovery and development is becoming more common. During clinical trial investigations, companies are using Spatial Mass Spectrometry to better understand molecules. The use of Spatial Mass Spectrometry in medication development and discovery phases supports huge growth in the Spatial Mass Spectrometry market today and in the near future.
The market for Spatial Mass Spectrometry will expand owing to the upcoming Spatial Mass Spectrometry technologies and improvements. For example, Spatial Transcriptomics, for example, is an in situ capture technology that allows for the quantification and visualization of transcriptomes in particular tissue slices.
The use of Spatial Mass Spectrometry techniques in cancer diagnostics is expected to yield significant results in the near future.
North America leads the Spatial Mass Spectrometry market, owing to the development of technology to discover illness biomarkers. The market is growing due to rising demand for cancer treatment and the occurrence of cancer in North America, where around 1.2 Million women get biopsies each year.
And about 20% of them have been told they have breast cancer. Furthermore, the market's expansion would be aided by the availability of qualified experts and healthcare facilities equipped with cutting-edge diagnostic procedures and medicines throughout the projection period.
In the Spatial Mass Spectrometry market, Asia Pacific held a sizable proportion of the global market. Factors contributing to the region's growth include an increase in the number of enterprises entering the market, as well as biological activities and research studies, all of which are expected to promote the use of Spatial Mass Spectrometry tools throughout the forecast period.
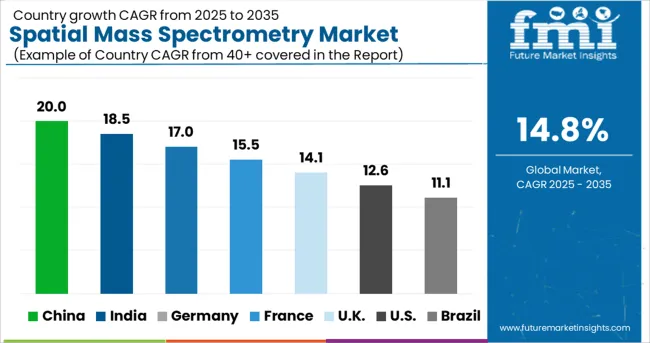
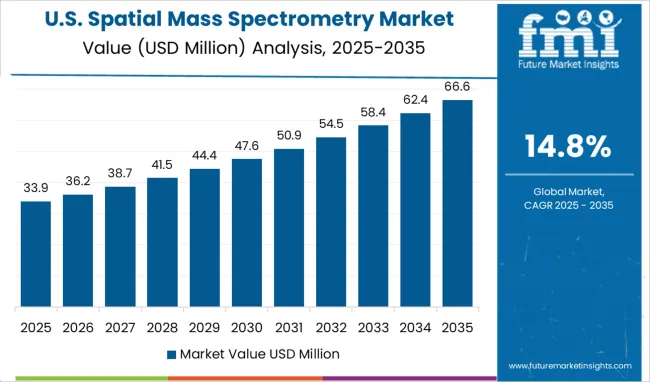
The United States is expected to have the highest market share of USD 1532.7 Million by the end of 2035. In 2024, the United States had the highest revenue share of over 35%. The market is expanding as the prevalence of chronic diseases including cancer and heart disease rises. Cancer is one of the leading causes of death in the United States. In 2020, around 1,735,350 new cancer diagnoses and 609,640 cancer-related deaths were recorded.
The Spatial Transcriptomics segment is forecasted to grow at the highest CAGR of over 16.6% during 2025 to 2035. This segment's growth is fuelled by the introduction of novel tools and instruments. Through this procedure, the technology may aid in the discovery of the subcellular localization of mRNA molecules.
Furthermore, the technology makes the process of studying genomic analysis much easier. This could potentially meet the needs of biological specimens of nucleic acid or single cells. Market growth is expected to be aided by these factors.
These techniques generally promote fields in molecular genetics and biochemistry associated with structure-oriented fields such as embryology and histology. This allows the genomics segment to grow at a faster rate than the rest of the market over the forecasted timeframe.
The FFPE segment is forecasted to grow at the highest CAGR of over 15.8% during 2025 to 2035. The FFPE sector has the largest market share of around 55% due to breakthroughs in the examination, experimental research, and diagnostic progress. Furthermore, the fresh frozen segment is predicted to grow at the fastest rate due to increased demand.
Among the leading Spatial Mass Spectrometry companies are 10x Genomics, Dovetail Genomics, S2 Genomics Inc, NanoString Technologies Inc, and Seven Bridges Genomics. To gain a competitive advantage in the industry, these market players are investing in partnerships, mergers and acquisitions, and expansion.
Some of the recent developments of key Spatial Mass Spectrometry providers are as follows:
Similarly, recent developments related to companies Spatial Mass Spectrometry services have been tracked by the team at Future Market Insights, which are available in the full report.
| Attributes | Details |
|---|---|
| Forecast Period | 2025 to 2035 |
| Historical Data Available for | 2020 to 2024 |
| Market Analysis | million for Value |
| Key Regions Covered | North America; Europe; Asia Pacific; Middle East & Africa; Latin America |
| Key Countries Covered | United States, UK, China, South Korea, Japan |
| Key Market Segments Covered | Technology, Product Type, Workflow, Sample Type |
| Key Companies Profiled | 10x Genomics; Dovetail Genomics; S2 Genomics Inc; NanoString Technologies Inc; Seven Bridges Genomics; PerkinElmer, Inc.; Bio-Techne; Danaher Corporation; IonPath, Inc.; Millennium Science Pty Ltd.; Akoya Biosciences, Ltd.; Fluidigm Corporation; Diagenode Diagnostics; Biognosys AG; Rebus Biosystems; Ultivue, Inc.; Vizgen Corp.; BioSpyder Technologies; Bruker; Brooks Automation, Inc. |
| Pricing | Available upon Request |
The global spatial mass spectrometry market is estimated to be valued at USD 385.5 million in 2025.
It is projected to reach USD 1,532.7 million by 2035.
The market is expected to grow at a 14.8% CAGR between 2025 and 2035.
The key product types are spatial proteomics, spatial transcriptomics, _sequencing based methods, _ ihc, _microscopy based rna imaging techniques, spatial genomics, _fish, _microscopy based live dna imaging, _genome perturbation tools, _massively parallel sequencing, _other spatial genomics, _centrifugation techniques, _spatial proteomics, _ imaging techniques, _mass spectrometry, _ immunofluorescence techniques, _centrifugation techniques and _other spatial proteomics.
instruments segment is expected to dominate with a 52.3% industry share in 2025.


Our Research Products

The "Full Research Suite" delivers actionable market intel, deep dives on markets or technologies, so clients act faster, cut risk, and unlock growth.

The Leaderboard benchmarks and ranks top vendors, classifying them as Established Leaders, Leading Challengers, or Disruptors & Challengers.

Locates where complements amplify value and substitutes erode it, forecasting net impact by horizon

We deliver granular, decision-grade intel: market sizing, 5-year forecasts, pricing, adoption, usage, revenue, and operational KPIs—plus competitor tracking, regulation, and value chains—across 60 countries broadly.

Spot the shifts before they hit your P&L. We track inflection points, adoption curves, pricing moves, and ecosystem plays to show where demand is heading, why it is changing, and what to do next across high-growth markets and disruptive tech

Real-time reads of user behavior. We track shifting priorities, perceptions of today’s and next-gen services, and provider experience, then pace how fast tech moves from trial to adoption, blending buyer, consumer, and channel inputs with social signals (#WhySwitch, #UX).

Partner with our analyst team to build a custom report designed around your business priorities. From analysing market trends to assessing competitors or crafting bespoke datasets, we tailor insights to your needs.
Supplier Intelligence
Discovery & Profiling
Capacity & Footprint
Performance & Risk
Compliance & Governance
Commercial Readiness
Who Supplies Whom
Scorecards & Shortlists
Playbooks & Docs
Category Intelligence
Definition & Scope
Demand & Use Cases
Cost Drivers
Market Structure
Supply Chain Map
Trade & Policy
Operating Norms
Deliverables
Buyer Intelligence
Account Basics
Spend & Scope
Procurement Model
Vendor Requirements
Terms & Policies
Entry Strategy
Pain Points & Triggers
Outputs
Pricing Analysis
Benchmarks
Trends
Should-Cost
Indexation
Landed Cost
Commercial Terms
Deliverables
Brand Analysis
Positioning & Value Prop
Share & Presence
Customer Evidence
Go-to-Market
Digital & Reputation
Compliance & Trust
KPIs & Gaps
Outputs
Full Research Suite comprises of:
Market outlook & trends analysis
Interviews & case studies
Strategic recommendations
Vendor profiles & capabilities analysis
5-year forecasts
8 regions and 60+ country-level data splits
Market segment data splits
12 months of continuous data updates
DELIVERED AS:
PDF EXCEL ONLINE
Spatial Computing Market Size and Share Forecast Outlook 2025 to 2035
Spatial Light Modulator Market Analysis - Growth, Demand & Forecast 2025 to 2035
Geospatial Imagery Analytics Market Size and Share Forecast Outlook 2025 to 2035
Geospatial Solution Market Analysis - Size, Share, and Forecast Outlook for 2025 to 2035
Geospatial Analytics Market Growth – Trends & Forecast through 2034
Sequencing and Spatial Omics Platform Market Size and Share Forecast Outlook 2025 to 2035
Massoia Bark Essential Oil Market Size and Share Forecast Outlook 2025 to 2035
Mass Transfer Trays Market Size and Share Forecast Outlook 2025 to 2035
Mass Loaded Vinyl (MLV) Market Size and Share Forecast Outlook 2025 to 2035
Mass Notification System in Healthcare Market Size and Share Forecast Outlook 2025 to 2035
Mass Finishing Consumables Market Size and Share Forecast Outlook 2025 to 2035
Massage Therapy Service Market - Growth & Forecast 2025 to 2035
Massage Guns Market Analysis – Demand, Growth & Forecast 2025–2035
Massive Open Online Course Market Analysis – Growth, Trends & Forecast 2025 to 2035
Industry Share Analysis for Massage Therapy Service Providers
Mass Notification Systems Market Analysis by Component, Solution, Application, and Industry, and Region Through 2035
Massive MIMO Market
Massage Equipment Market
Biomass Hot Air Generator Furnace Market Size and Share Forecast Outlook 2025 to 2035
Biomass Pellets Market Size and Share Forecast Outlook 2025 to 2035

Thank you!
You will receive an email from our Business Development Manager. Please be sure to check your SPAM/JUNK folder too.
Chat With
MaRIA