Proteomics Market
Analyze FMI's extensive coverage of the Proteomics Market to obtain Exhaustive Analyses of Key Segments
Proteomics Market by Service, Application, Equipment & Region | Forecast 2022 to 2032.
Proteomics Market Outlook (2022 to 2032)
The global Proteomics market size reached a valuation of US$ 30,825.04 Million in 2022. Increasing adoption of precision medicine and sophisticated diagnostics in specific target disease treatment, as well as the increased concentration of target diseases, are significant drivers of growth prospects.
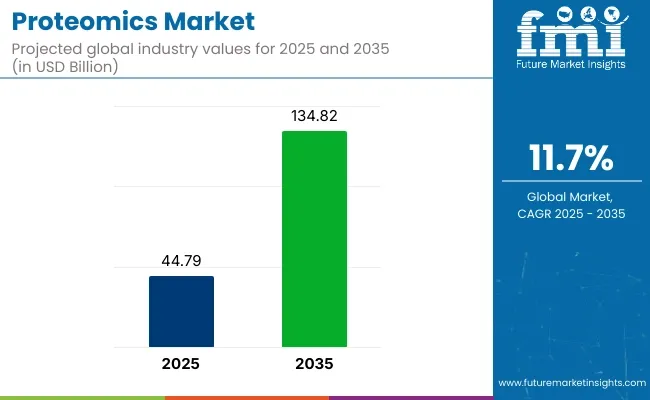
Demand for Proteomics is projected to grow at a robust CAGR of 13.5% between 2022 and 2032, totaling around US$ 109,485.7 Million by the end of 2032.
Data Points |
Key Statistics |
Proteomics Market Size (2022) |
US$ 30,825.04 Million |
Proteomics Market Revenue Forecast (2032) |
US$ 109,485.7 Million |
Proteomics Market Growth Rate (2022 to 2032) |
13.5% CAGR |
North America Market Share |
35% |
A proteome is the complete set of proteins produced by a system or organism. It can transform based on the time, specifications, and stresses that an organism is confined to. Proteomic research refers to the systematic study of proteins on a large scale. Because proteins are the fundamental units of cells, proteomic research aims to answer all questionnaires about them.
Breakthroughs in mass spectrometry and protein and DNA sequence databases can assist proteomics research. Proteomics necessitates a wide range of instruments, machinery, reagents, media, and software for protein identification, quantitative determination, and recognition of protein interactions.
Let us know your requirement to get
100% FREE customization
Which Factors Are Driving The Growth Of The Proteomics Market?
Continued growth for personalized medicine, technical progress, and innovation, as well as enhanced funding opportunities from both the public and private sectors for proteomics, are among the most crucial driving factors in the proteomics industry.
Because the pharmaceutical and biopharmaceutical markets are expanding rapidly, the clamor for proteomics has accelerated. Furthermore, the global industry is anticipated to expand rapidly in the coming decades as an outcome of technological advancements, extensive research funding, escalating healthcare costs, rising numbers for tailored medication, and price inflation of genetic illnesses.
Another factor expected to propel overall growth is the higher incidence of chronic diseases such as cancer, Cardiovascular Diseases (CVDs), respiratory diseases, CKD, and others. As per Globocan, there were 19.3 million new cancer patients and 10 million cancer-related deaths globally in December 2020. Similarly, CVDs are among the world's most prevalent causes of death.
Which Factors Are Restraining The Growth Of The Proteomics Market?
Despite its numerous benefits and wonderful features, proteomics also has a few drawbacks. The high price of medicines and equipment, as well as a scarcity of research scholars, are stifling the proteomics market.
Find your sweet spots for generating winning opportunities in this market.
Talk to AnalystHow Will Growth Unfold In The North America Proteomics Market?
North America dominated the market in 2021, with a 46% revenue share. This is due to higher investments in the innovation of structure-based drug design, advancement in omics research, the requirement for high-quality research tools for data replicability, and a focus on the creation of tailored treatments. Agreements and collaborations among major corporations in this region are also assisting in the advancement of this market.
For example, Thermo Fisher Scientific Inc. and Symphogen collaborated to create validated platform mechanisms for the streamlined classification and monitoring, and management of complex protein therapeutics. North America is accounting for a market share of 35% of the global Proteomics market.
Which Factors Are Pushing The Proteomics Demand In The Asia Pacific?
Rapid growth for personalized medicines, as well as increased research and development in proteomics, are acting as a catalyst in the market. The clamor for spectroscopy proteomics is likely to increase as the prevalence of breast cancer rises. This is expected to aid the advancement of the Asia-Pacific proteomics market.
These are the primary drivers that will continue to fuel the biopharmaceutical firm's endeavor of blockbuster drugs, as well as the latest technological advancements in gene and protein research.
Because it is challenging for organizations to find all of the required expertise to encompass all of the activities associated with proteomics, alliances seem to become progressively crucial in this field. Many manufacturers, for example, are cooperating with mass spectrometry, and both automakers and end-user labs are partnering with protein chip-related companies.

A unified Market Research Subscription Platform, built for today's disparate research needs.
How Will Growth Unfold In The European Proteomics Market?
The global market for personalized medicine in Europe, as well as the existence of major market players such as Merck KGaA, are expected to propel growth in the region. Additionally, proactive support from European local governments and approaches by research organizations to develop proteomics technologies such as chemo proteomics and spectrometry is expected to fuel market growth.
Rising research grants and active projects by European research institutes and big players, especially in the United Kingdom, drive demand in the researched market.
For example, in December 2020, the United Kingdom Biobank collaborated on the Pharma Proteomics Project with the Biopharma Consortium, which included ten biopharmaceutical enterprises. Europe is accounting for a market share of 23.1% of the global proteomics market.
Category-Wise Analysis
Which Segments Dominate the Global Proteomics Market?
In 2021, the spectroscopy segment had the largest share of revenue at more than 46.9%. During the projected timeline, it is presumed to accelerate at the fastest rate. The pervasive use of spectroscopy-based technological innovations in many application domains, such as drug development procedures, proteomics, metabolomics, forensic investigation, and pharmacological analysis, is one of the major drivers of segment growth.
In 2021, the clinical diagnostics segment led the industry with a market share of more than 52%. This is due to the extensive use of protein analysis by clinical researchers to identify disease biomarkers for early recognition and specific risk factors.
This is anticipated to open up new avenues for ailment early detection and prevention. It is possible to discover potential biomarkers and nutrient expression patterns that can be utilized to classify and anticipate tumors, as well as ascertain their prognosis, using proteomics-based medical assessment, which contributes significantly to the segment's development.
The Start-up Ecosystem
How key Players are opening Frontiers for Future Growth?
Manufacturers are adopting various marketing strategies such as new product launches, geographical expansion, mergers and acquisitions, partnerships, and collaboration to identify the interest of potential buyers and create a larger customer base.
For instance,
- Fastbase Solutions was established in 2015. Fastbase Solutions, a development company of proteomic technology, and Lambert Instruments BV, a creator of imaging solutions, recently announced a strategic agreement to launch a new cancer diagnostics platform.
- Evosep was established in 2016. SCIEX and Evosep declared a partnership deal in November 2022 to co-market products designed to enhance robust, high-throughput proteomics workflows for personalized medicine.
Who are the Leading Players in Proteomics Market?
Some of the leading Proteomics manufacturers include Agilent Technologies, Thermo Fisher Scientific Inc., Danaher Corporation, Genzyme Corporation, GE Healthcare, Bio-Rad Laboratories, Inc., Affymetrix Inc, Seer, SCIEX, and SomaLogic.
These key proteomics providers are adopting various strategies such as new product launches and approvals, partnerships, collaborations, acquisitions, mergers, etc. to increase their sales and gain a competitive edge in the global proteomics market.
For instance,
- Seer Corporation announced the broad commercial release of the Proteograph Product Suite and the Centers of Excellence program in January 2022.
- The clinical trial to assess the diagnosis of disseminated Lyme borreliosis by focused proteomics began in February 2021 at University Hospital in Strasbourg, France.
- SCIEX (Danaher Corporation) released the next-generation mass spectrometer, the SCIEX Triple Quad 7500 LC-MS/MS System - QTRAP Ready, in July 2020.
- SomaLogic raised an additional US$ 80 million in investment as part of its Series A financing round in December 2020. The influx of fundraising in the field of proteomics is expected to accelerate the proteomics market over the coming years.
Report Scope
Report Attribute |
Details |
Growth Rate |
CAGR of 13.5% from 2022 to 2032 |
Market Value in 2022 |
US$ 30,825.04 Million |
Market Value in 2032 |
US$ 109,485.7 Million |
Base Year for Estimates |
2021 |
Historical Data |
2016 to 2021 |
Forecast Period |
2022 to 2032 |
Quantitative Units |
Revenue in US$ Million and CAGR from 2022 to 2032 |
Report Coverage |
Revenue Forecast, Company Ranking, Competitive Landscape, Growth Factors, Trends, and Pricing Analysis |
Segments Covered |
|
Regions Covered |
|
Key Countries Profiled |
|
Key Companies Profiled |
Agilent Technologies, Thermo Fisher Scientific Inc., Danaher Corporation, Genzyme Corporation, GE Healthcare, Bio-Rad Laboratories, Inc., Affymetrix Inc., Seer, SCIEX, SomaLogic. |
Report Customization & Pricing |
Available upon Request |
Proteomics Market: Segmentation
By Equipment:
- Chromatography
- Mass Spectroscopy
- Protein Microarray
- X-ray Crystallography
- Protein fractionation
- Others
By Services:
- Laboratory Service
- Data Analysis and Services
By Application:
- Drug Discovery
- Clinical Diagnosis
- Others
Frequently Asked Questions
What is the current valuation of Proteomics market?
The global Proteomics market reached US$ 30825.04 Million in 2022.
What is the anticipated growth rate for Proteomics during the projected period?
As per FMI, the Proteomics industry is expected to grow at a CAGR of 13.5% throughout the forecast period (2022 to 2032).
What is the projected valuation for Proteomics market by 2032?
The global sales of Proteomics are anticipated to total a valuation of US$ 109485.7 Million by 2032.
Who are the prominent Proteomics providers?
Some of the leading manufacturers include Agilent Technologies, Thermo Fisher Scientific Inc., Danaher Corporation, Genzyme Corporation, GE Healthcare, Bio-Rad Laboratories, Inc., Affymetrix Inc, Seer, SCIEX, and SomaLogic.
Which is the leading market for Proteomics?
North America will continue to remain the most lucrative market for proteomics, accounting for a share of 35% of the global Proteomics market in 2022.
Table of Content
1. Executive Summary | Proteomics Market 1.1. Global Market Outlook 1.2. Demand-side Trends 1.3. Supply-side Trends 1.4. Technology Roadmap Analysis 1.5. Analysis and Recommendations 2. Market Overview 2.1. Market Coverage / Taxonomy 2.2. Market Definition / Scope / Limitations 3. Market Background 3.1. Market Dynamics 3.1.1. Drivers 3.1.2. Restraints 3.1.3. Opportunity 3.1.4. Trends 3.2. Scenario Forecast 3.2.1. Demand in Optimistic Scenario 3.2.2. Demand in Likely Scenario 3.2.3. Demand in Conservative Scenario 3.3. Opportunity Map Analysis 3.4. Investment Feasibility Matrix 3.5. PESTLE and Porter’s Analysis 3.6. Regulatory Landscape 3.6.1. By Key Regions 3.6.2. By Key Countries 3.7. Regional Parent Market Outlook 4. Global Market Analysis 2016 to 2021 and Forecast, 2022 to 2032 4.1. Historical Market Size Value (US$ Million) Analysis, 2016 to 2021 4.2. Current and Future Market Size Value (US$ Million) Projections, 2022 to 2032 4.2.1. Y-o-Y Growth Trend Analysis 4.2.2. Absolute $ Opportunity Analysis 5. Global Market Analysis 2016 to 2021 and Forecast 2022 to 2032, By Equipment 5.1. Introduction / Key Findings 5.2. Historical Market Size Value (US$ Million) Analysis By Equipment, 2016 to 2021 5.3. Current and Future Market Size Value (US$ Million) Analysis and Forecast By Equipment, 2022 to 2032 5.3.1. Chromatography 5.3.2. Mass Spectroscopy 5.3.3. Protein Microarray 5.3.4. X-ray Crystallography 5.3.5. Protein fractionation 5.3.6. Others 5.4. Y-o-Y Growth Trend Analysis By Equipment, 2016 to 2021 5.5. Absolute $ Opportunity Analysis By Equipment, 2022 to 2032 6. Global Market Analysis 2016 to 2021 and Forecast 2022 to 2032, By Services 6.1. Introduction / Key Findings 6.2. Historical Market Size Value (US$ Million) Analysis By Services, 2016 to 2021 6.3. Current and Future Market Size Value (US$ Million) Analysis and Forecast By Services, 2022 to 2032 6.3.1. Laboratory Service 6.3.2. Data Analysis and Services 6.4. Y-o-Y Growth Trend Analysis By Services, 2016 to 2021 6.5. Absolute $ Opportunity Analysis By Services, 2022 to 2032 7. Global Market Analysis 2016 to 2021 and Forecast 2022 to 2032, By Application 7.1. Introduction / Key Findings 7.2. Historical Market Size Value (US$ Million) Analysis By Application, 2016 to 2021 7.3. Current and Future Market Size Value (US$ Million) Analysis and Forecast By Application, 2022 to 2032 7.3.1. Drug discovery 7.3.2. Clinical Diagnosis 7.3.3. Others 7.4. Y-o-Y Growth Trend Analysis By Application, 2016 to 2021 7.5. Absolute $ Opportunity Analysis By Application, 2022 to 2032 8. Global Market Analysis 2016 to 2021 and Forecast 2022 to 2032, By Region 8.1. Introduction 8.2. Historical Market Size Value (US$ Million) Analysis By Region, 2016 to 2021 8.3. Current Market Size Value (US$ Million) Analysis and Forecast By Region, 2022 to 2032 8.3.1. North America 8.3.2. Latin America 8.3.3. Europe 8.3.4. South Asia 8.3.5. East Asia 8.3.6. Oceania 8.3.7. Middle East and Africa 8.4. Market Attractiveness Analysis By Region 9. North America Market Analysis 2016 to 2021 and Forecast 2022 to 2032, By Country 9.1. Historical Market Size Value (US$ Million) Trend Analysis By Market Taxonomy, 2016 to 2021 9.2. Market Size Value (US$ Million) Forecast By Market Taxonomy, 2022 to 2032 9.2.1. By Country 9.2.1.1. USA 9.2.1.2. Canada 9.2.2. By Equipment 9.2.3. By Services 9.2.4. By Application 9.3. Market Attractiveness Analysis 9.3.1. By Country 9.3.2. By Equipment 9.3.3. By Services 9.3.4. By Application 9.4. Key Takeaways 10. Latin America Market Analysis 2016 to 2021 and Forecast 2022 to 2032, By Country 10.1. Historical Market Size Value (US$ Million) Trend Analysis By Market Taxonomy, 2016 to 2021 10.2. Market Size Value (US$ Million) Forecast By Market Taxonomy, 2022 to 2032 10.2.1. By Country 10.2.1.1. Brazil 10.2.1.2. Mexico 10.2.1.3. Rest of Latin America 10.2.2. By Equipment 10.2.3. By Services 10.2.4. By Application 10.3. Market Attractiveness Analysis 10.3.1. By Country 10.3.2. By Equipment 10.3.3. By Services 10.3.4. By Application 10.4. Key Takeaways 11. Europe Market Analysis 2016 to 2021 and Forecast 2022 to 2032, By Country 11.1. Historical Market Size Value (US$ Million) Trend Analysis By Market Taxonomy, 2016 to 2021 11.2. Market Size Value (US$ Million) Forecast By Market Taxonomy, 2022 to 2032 11.2.1. By Country 11.2.1.1. Germany 11.2.1.2. United Kingdom 11.2.1.3. France 11.2.1.4. Spain 11.2.1.5. Italy 11.2.1.6. Rest of Europe 11.2.2. By Equipment 11.2.3. By Services 11.2.4. By Application 11.3. Market Attractiveness Analysis 11.3.1. By Country 11.3.2. By Equipment 11.3.3. By Services 11.3.4. By Application 11.4. Key Takeaways 12. South Asia Market Analysis 2016 to 2021 and Forecast 2022 to 2032, By Country 12.1. Historical Market Size Value (US$ Million) Trend Analysis By Market Taxonomy, 2016 to 2021 12.2. Market Size Value (US$ Million) Forecast By Market Taxonomy, 2022 to 2032 12.2.1. By Country 12.2.1.1. India 12.2.1.2. Malaysia 12.2.1.3. Singapore 12.2.1.4. Thailand 12.2.1.5. Rest of South Asia 12.2.2. By Equipment 12.2.3. By Services 12.2.4. By Application 12.3. Market Attractiveness Analysis 12.3.1. By Country 12.3.2. By Equipment 12.3.3. By Services 12.3.4. By Application 12.4. Key Takeaways 13. East Asia Market Analysis 2016 to 2021 and Forecast 2022 to 2032, By Country 13.1. Historical Market Size Value (US$ Million) Trend Analysis By Market Taxonomy, 2016 to 2021 13.2. Market Size Value (US$ Million) Forecast By Market Taxonomy, 2022 to 2032 13.2.1. By Country 13.2.1.1. China 13.2.1.2. Japan 13.2.1.3. South Korea 13.2.2. By Equipment 13.2.3. By Services 13.2.4. By Application 13.3. Market Attractiveness Analysis 13.3.1. By Country 13.3.2. By Equipment 13.3.3. By Services 13.3.4. By Application 13.4. Key Takeaways 14. Oceania Market Analysis 2016 to 2021 and Forecast 2022 to 2032, By Country 14.1. Historical Market Size Value (US$ Million) Trend Analysis By Market Taxonomy, 2016 to 2021 14.2. Market Size Value (US$ Million) Forecast By Market Taxonomy, 2022 to 2032 14.2.1. By Country 14.2.1.1. Australia 14.2.1.2. New Zealand 14.2.2. By Equipment 14.2.3. By Services 14.2.4. By Application 14.3. Market Attractiveness Analysis 14.3.1. By Country 14.3.2. By Equipment 14.3.3. By Services 14.3.4. By Application 14.4. Key Takeaways 15. Middle East and Africa Market Analysis 2016 to 2021 and Forecast 2022 to 2032, By Country 15.1. Historical Market Size Value (US$ Million) Trend Analysis By Market Taxonomy, 2016 to 2021 15.2. Market Size Value (US$ Million) Forecast By Market Taxonomy, 2022 to 2032 15.2.1. By Country 15.2.1.1. GCC Countries 15.2.1.2. South Africa 15.2.1.3. Israel 15.2.1.4. Rest of Middle East and Africa 15.2.2. By Equipment 15.2.3. By Services 15.2.4. By Application 15.3. Market Attractiveness Analysis 15.3.1. By Country 15.3.2. By Equipment 15.3.3. By Services 15.3.4. By Application 15.4. Key Takeaways 16. Key Countries Market Analysis 16.1. USA 16.1.1. Pricing Analysis 16.1.2. Market Share Analysis, 2021 16.1.2.1. By Equipment 16.1.2.2. By Services 16.1.2.3. By Application 16.2. Canada 16.2.1. Pricing Analysis 16.2.2. Market Share Analysis, 2021 16.2.2.1. By Equipment 16.2.2.2. By Services 16.2.2.3. By Application 16.3. Brazil 16.3.1. Pricing Analysis 16.3.2. Market Share Analysis, 2021 16.3.2.1. By Equipment 16.3.2.2. By Services 16.3.2.3. By Application 16.4. Mexico 16.4.1. Pricing Analysis 16.4.2. Market Share Analysis, 2021 16.4.2.1. By Equipment 16.4.2.2. By Services 16.4.2.3. By Application 16.5. Germany 16.5.1. Pricing Analysis 16.5.2. Market Share Analysis, 2021 16.5.2.1. By Equipment 16.5.2.2. By Services 16.5.2.3. By Application 16.6. United Kingdom 16.6.1. Pricing Analysis 16.6.2. Market Share Analysis, 2021 16.6.2.1. By Equipment 16.6.2.2. By Services 16.6.2.3. By Application 16.7. France 16.7.1. Pricing Analysis 16.7.2. Market Share Analysis, 2021 16.7.2.1. By Equipment 16.7.2.2. By Services 16.7.2.3. By Application 16.8. Spain 16.8.1. Pricing Analysis 16.8.2. Market Share Analysis, 2021 16.8.2.1. By Equipment 16.8.2.2. By Services 16.8.2.3. By Application 16.9. Italy 16.9.1. Pricing Analysis 16.9.2. Market Share Analysis, 2021 16.9.2.1. By Equipment 16.9.2.2. By Services 16.9.2.3. By Application 16.10. India 16.10.1. Pricing Analysis 16.10.2. Market Share Analysis, 2021 16.10.2.1. By Equipment 16.10.2.2. By Services 16.10.2.3. By Application 16.11. Malaysia 16.11.1. Pricing Analysis 16.11.2. Market Share Analysis, 2021 16.11.2.1. By Equipment 16.11.2.2. By Services 16.11.2.3. By Application 16.12. Singapore 16.12.1. Pricing Analysis 16.12.2. Market Share Analysis, 2021 16.12.2.1. By Equipment 16.12.2.2. By Services 16.12.2.3. By Application 16.13. Thailand 16.13.1. Pricing Analysis 16.13.2. Market Share Analysis, 2021 16.13.2.1. By Equipment 16.13.2.2. By Services 16.13.2.3. By Application 16.14. China 16.14.1. Pricing Analysis 16.14.2. Market Share Analysis, 2021 16.14.2.1. By Equipment 16.14.2.2. By Services 16.14.2.3. By Application 16.15. Japan 16.15.1. Pricing Analysis 16.15.2. Market Share Analysis, 2021 16.15.2.1. By Equipment 16.15.2.2. By Services 16.15.2.3. By Application 16.16. South Korea 16.16.1. Pricing Analysis 16.16.2. Market Share Analysis, 2021 16.16.2.1. By Equipment 16.16.2.2. By Services 16.16.2.3. By Application 16.17. Australia 16.17.1. Pricing Analysis 16.17.2. Market Share Analysis, 2021 16.17.2.1. By Equipment 16.17.2.2. By Services 16.17.2.3. By Application 16.18. New Zealand 16.18.1. Pricing Analysis 16.18.2. Market Share Analysis, 2021 16.18.2.1. By Equipment 16.18.2.2. By Services 16.18.2.3. By Application 16.19. GCC Countries 16.19.1. Pricing Analysis 16.19.2. Market Share Analysis, 2021 16.19.2.1. By Equipment 16.19.2.2. By Services 16.19.2.3. By Application 16.20. South Africa 16.20.1. Pricing Analysis 16.20.2. Market Share Analysis, 2021 16.20.2.1. By Equipment 16.20.2.2. By Services 16.20.2.3. By Application 16.21. Israel 16.21.1. Pricing Analysis 16.21.2. Market Share Analysis, 2021 16.21.2.1. By Equipment 16.21.2.2. By Services 16.21.2.3. By Application 17. Market Structure Analysis 17.1. Competition Dashboard 17.2. Competition Benchmarking 17.3. Market Share Analysis of Top Players 17.3.1. By Regional 17.3.2. By Equipment 17.3.3. By Services 17.3.4. By Application 18. Competition Analysis 18.1. Competition Deep Dive 18.1.1. Agilent Technologies 18.1.1.1. Overview 18.1.1.2. Product Portfolio 18.1.1.3. Profitability by Market Segments 18.1.1.4. Sales Footprint 18.1.1.5. Strategy Overview 18.1.1.5.1. Marketing Strategy 18.1.2. Thermo Fisher Scientific Inc. 18.1.2.1. Overview 18.1.2.2. Product Portfolio 18.1.2.3. Profitability by Market Segments 18.1.2.4. Sales Footprint 18.1.2.5. Strategy Overview 18.1.2.5.1. Marketing Strategy 18.1.3. Danaher Corporation 18.1.3.1. Overview 18.1.3.2. Product Portfolio 18.1.3.3. Profitability by Market Segments 18.1.3.4. Sales Footprint 18.1.3.5. Strategy Overview 18.1.3.5.1. Marketing Strategy 18.1.4. Genzyme Corporation 18.1.4.1. Overview 18.1.4.2. Product Portfolio 18.1.4.3. Profitability by Market Segments 18.1.4.4. Sales Footprint 18.1.4.5. Strategy Overview 18.1.4.5.1. Marketing Strategy 18.1.5. GE Healthcare 18.1.5.1. Overview 18.1.5.2. Product Portfolio 18.1.5.3. Profitability by Market Segments 18.1.5.4. Sales Footprint 18.1.5.5. Strategy Overview 18.1.5.5.1. Marketing Strategy 18.1.6. Bio-Rad Laboratories, Inc. 18.1.6.1. Overview 18.1.6.2. Product Portfolio 18.1.6.3. Profitability by Market Segments 18.1.6.4. Sales Footprint 18.1.6.5. Strategy Overview 18.1.6.5.1. Marketing Strategy 18.1.7. Affymetrix Inc. 18.1.7.1. Overview 18.1.7.2. Product Portfolio 18.1.7.3. Profitability by Market Segments 18.1.7.4. Sales Footprint 18.1.7.5. Strategy Overview 18.1.7.5.1. Marketing Strategy 18.1.8. Bruker Corporation 18.1.8.1. Overview 18.1.8.2. Product Portfolio 18.1.8.3. Profitability by Market Segments 18.1.8.4. Sales Footprint 18.1.8.5. Strategy Overview 18.1.8.5.1. Marketing Strategy 18.1.9. Horiba, Ltd. 18.1.9.1. Overview 18.1.9.2. Product Portfolio 18.1.9.3. Profitability by Market Segments 18.1.9.4. Sales Footprint 18.1.9.5. Strategy Overview 18.1.9.5.1. Marketing Strategy 18.1.10. Waters Corporation 18.1.10.1. Overview 18.1.10.2. Product Portfolio 18.1.10.3. Profitability by Market Segments 18.1.10.4. Sales Footprint 18.1.10.5. Strategy Overview 18.1.10.5.1. Marketing Strategy 19. Assumptions & Acronyms Used 20. Research Methodology
Let us know your requirement to get
100% FREE customization
List of Tables
Table 01: Global Market Value (US$ Million) Forecast by Region, 2016 to 2032 Table 02: Global Market Value (US$ Million) Forecast by Equipment, 2016 to 2032 Table 03: Global Market Value (US$ Million) Forecast by Services, 2016 to 2032 Table 04: Global Market Value (US$ Million) Forecast by Application, 2016 to 2032 Table 05: North America Market Value (US$ Million) Forecast by Country, 2016 to 2032 Table 06: North America Market Value (US$ Million) Forecast by Equipment, 2016 to 2032 Table 07: North America Market Value (US$ Million) Forecast by Services, 2016 to 2032 Table 08: North America Market Value (US$ Million) Forecast by Application, 2016 to 2032 Table 09: Latin America Market Value (US$ Million) Forecast by Country, 2016 to 2032 Table 10: Latin America Market Value (US$ Million) Forecast by Equipment, 2016 to 2032 Table 11: Latin America Market Value (US$ Million) Forecast by Services, 2016 to 2032 Table 12: Latin America Market Value (US$ Million) Forecast by Application, 2016 to 2032 Table 13: Europe Market Value (US$ Million) Forecast by Country, 2016 to 2032 Table 14: Europe Market Value (US$ Million) Forecast by Equipment, 2016 to 2032 Table 15: Europe Market Value (US$ Million) Forecast by Services, 2016 to 2032 Table 16: Europe Market Value (US$ Million) Forecast by Application, 2016 to 2032 Table 17: South Asia Market Value (US$ Million) Forecast by Country, 2016 to 2032 Table 18: South Asia Market Value (US$ Million) Forecast by Equipment, 2016 to 2032 Table 19: South Asia Market Value (US$ Million) Forecast by Services, 2016 to 2032 Table 20: South Asia Market Value (US$ Million) Forecast by Application, 2016 to 2032 Table 21: East Asia Market Value (US$ Million) Forecast by Country, 2016 to 2032 Table 22: East Asia Market Value (US$ Million) Forecast by Equipment, 2016 to 2032 Table 23: East Asia Market Value (US$ Million) Forecast by Services, 2016 to 2032 Table 24: East Asia Market Value (US$ Million) Forecast by Application, 2016 to 2032 Table 25: Oceania Market Value (US$ Million) Forecast by Country, 2016 to 2032 Table 26: Oceania Market Value (US$ Million) Forecast by Equipment, 2016 to 2032 Table 27: Oceania Market Value (US$ Million) Forecast by Services, 2016 to 2032 Table 28: Oceania Market Value (US$ Million) Forecast by Application, 2016 to 2032 Table 29: Middle East and Africa Market Value (US$ Million) Forecast by Country, 2016 to 2032 Table 30: Middle East and Africa Market Value (US$ Million) Forecast by Equipment, 2016 to 2032 Table 31: Middle East and Africa Market Value (US$ Million) Forecast by Services, 2016 to 2032 Table 32: Middle East and Africa Market Value (US$ Million) Forecast by Application, 2016 to 2032
Find your sweet spots for generating winning opportunities in this market.
Talk to AnalystList of Charts
Figure 01: Global Market Value (US$ Million) by Equipment, 2022 to 2032 Figure 02: Global Market Value (US$ Million) by Services, 2022 to 2032 Figure 03: Global Market Value (US$ Million) by Application, 2022 to 2032 Figure 04: Global Market Value (US$ Million) by Region, 2022 to 2032 Figure 05: Global Market Value (US$ Million) Analysis by Region, 2016 to 2032 Figure 06: Global Market Value Share (%) and BPS Analysis by Region, 2022 to 2032 Figure 07: Global Market Y-o-Y Growth (%) Projections by Region, 2022 to 2032 Figure 08: Global Market Value (US$ Million) Analysis by Equipment, 2016 to 2032 Figure 09: Global Market Value Share (%) and BPS Analysis by Equipment, 2022 to 2032 Figure 10: Global Market Y-o-Y Growth (%) Projections by Equipment, 2022 to 2032 Figure 11: Global Market Value (US$ Million) Analysis by Services, 2016 to 2032 Figure 12: Global Market Value Share (%) and BPS Analysis by Services, 2022 to 2032 Figure 13: Global Market Y-o-Y Growth (%) Projections by Services, 2022 to 2032 Figure 14: Global Market Value (US$ Million) Analysis by Application, 2016 to 2032 Figure 15: Global Market Value Share (%) and BPS Analysis by Application, 2022 to 2032 Figure 16: Global Market Y-o-Y Growth (%) Projections by Application, 2022 to 2032 Figure 17: Global Market Attractiveness by Equipment, 2022 to 2032 Figure 18: Global Market Attractiveness by Services, 2022 to 2032 Figure 19: Global Market Attractiveness by Application, 2022 to 2032 Figure 20: Global Market Attractiveness by Region, 2022 to 2032 Figure 21: North America Market Value (US$ Million) by Equipment, 2022 to 2032 Figure 22: North America Market Value (US$ Million) by Services, 2022 to 2032 Figure 23: North America Market Value (US$ Million) by Application, 2022 to 2032 Figure 24: North America Market Value (US$ Million) by Country, 2022 to 2032 Figure 25: North America Market Value (US$ Million) Analysis by Country, 2016 to 2032 Figure 26: North America Market Value Share (%) and BPS Analysis by Country, 2022 to 2032 Figure 27: North America Market Y-o-Y Growth (%) Projections by Country, 2022 to 2032 Figure 28: North America Market Value (US$ Million) Analysis by Equipment, 2016 to 2032 Figure 29: North America Market Value Share (%) and BPS Analysis by Equipment, 2022 to 2032 Figure 30: North America Market Y-o-Y Growth (%) Projections by Equipment, 2022 to 2032 Figure 31: North America Market Value (US$ Million) Analysis by Services, 2016 to 2032 Figure 32: North America Market Value Share (%) and BPS Analysis by Services, 2022 to 2032 Figure 33: North America Market Y-o-Y Growth (%) Projections by Services, 2022 to 2032 Figure 34: North America Market Value (US$ Million) Analysis by Application, 2016 to 2032 Figure 35: North America Market Value Share (%) and BPS Analysis by Application, 2022 to 2032 Figure 36: North America Market Y-o-Y Growth (%) Projections by Application, 2022 to 2032 Figure 37: North America Market Attractiveness by Equipment, 2022 to 2032 Figure 38: North America Market Attractiveness by Services, 2022 to 2032 Figure 39: North America Market Attractiveness by Application, 2022 to 2032 Figure 40: North America Market Attractiveness by Country, 2022 to 2032 Figure 41: Latin America Market Value (US$ Million) by Equipment, 2022 to 2032 Figure 42: Latin America Market Value (US$ Million) by Services, 2022 to 2032 Figure 43: Latin America Market Value (US$ Million) by Application, 2022 to 2032 Figure 44: Latin America Market Value (US$ Million) by Country, 2022 to 2032 Figure 45: Latin America Market Value (US$ Million) Analysis by Country, 2016 to 2032 Figure 46: Latin America Market Value Share (%) and BPS Analysis by Country, 2022 to 2032 Figure 47: Latin America Market Y-o-Y Growth (%) Projections by Country, 2022 to 2032 Figure 48: Latin America Market Value (US$ Million) Analysis by Equipment, 2016 to 2032 Figure 49: Latin America Market Value Share (%) and BPS Analysis by Equipment, 2022 to 2032 Figure 50: Latin America Market Y-o-Y Growth (%) Projections by Equipment, 2022 to 2032 Figure 51: Latin America Market Value (US$ Million) Analysis by Services, 2016 to 2032 Figure 52: Latin America Market Value Share (%) and BPS Analysis by Services, 2022 to 2032 Figure 53: Latin America Market Y-o-Y Growth (%) Projections by Services, 2022 to 2032 Figure 54: Latin America Market Value (US$ Million) Analysis by Application, 2016 to 2032 Figure 55: Latin America Market Value Share (%) and BPS Analysis by Application, 2022 to 2032 Figure 56: Latin America Market Y-o-Y Growth (%) Projections by Application, 2022 to 2032 Figure 57: Latin America Market Attractiveness by Equipment, 2022 to 2032 Figure 58: Latin America Market Attractiveness by Services, 2022 to 2032 Figure 59: Latin America Market Attractiveness by Application, 2022 to 2032 Figure 60: Latin America Market Attractiveness by Country, 2022 to 2032 Figure 61: Europe Market Value (US$ Million) by Equipment, 2022 to 2032 Figure 62: Europe Market Value (US$ Million) by Services, 2022 to 2032 Figure 63: Europe Market Value (US$ Million) by Application, 2022 to 2032 Figure 64: Europe Market Value (US$ Million) by Country, 2022 to 2032 Figure 65: Europe Market Value (US$ Million) Analysis by Country, 2016 to 2032 Figure 66: Europe Market Value Share (%) and BPS Analysis by Country, 2022 to 2032 Figure 67: Europe Market Y-o-Y Growth (%) Projections by Country, 2022 to 2032 Figure 68: Europe Market Value (US$ Million) Analysis by Equipment, 2016 to 2032 Figure 69: Europe Market Value Share (%) and BPS Analysis by Equipment, 2022 to 2032 Figure 70: Europe Market Y-o-Y Growth (%) Projections by Equipment, 2022 to 2032 Figure 71: Europe Market Value (US$ Million) Analysis by Services, 2016 to 2032 Figure 72: Europe Market Value Share (%) and BPS Analysis by Services, 2022 to 2032 Figure 73: Europe Market Y-o-Y Growth (%) Projections by Services, 2022 to 2032 Figure 74: Europe Market Value (US$ Million) Analysis by Application, 2016 to 2032 Figure 75: Europe Market Value Share (%) and BPS Analysis by Application, 2022 to 2032 Figure 76: Europe Market Y-o-Y Growth (%) Projections by Application, 2022 to 2032 Figure 77: Europe Market Attractiveness by Equipment, 2022 to 2032 Figure 78: Europe Market Attractiveness by Services, 2022 to 2032 Figure 79: Europe Market Attractiveness by Application, 2022 to 2032 Figure 80: Europe Market Attractiveness by Country, 2022 to 2032 Figure 81: South Asia Market Value (US$ Million) by Equipment, 2022 to 2032 Figure 82: South Asia Market Value (US$ Million) by Services, 2022 to 2032 Figure 83: South Asia Market Value (US$ Million) by Application, 2022 to 2032 Figure 84: South Asia Market Value (US$ Million) by Country, 2022 to 2032 Figure 85: South Asia Market Value (US$ Million) Analysis by Country, 2016 to 2032 Figure 86: South Asia Market Value Share (%) and BPS Analysis by Country, 2022 to 2032 Figure 87: South Asia Market Y-o-Y Growth (%) Projections by Country, 2022 to 2032 Figure 88: South Asia Market Value (US$ Million) Analysis by Equipment, 2016 to 2032 Figure 89: South Asia Market Value Share (%) and BPS Analysis by Equipment, 2022 to 2032 Figure 90: South Asia Market Y-o-Y Growth (%) Projections by Equipment, 2022 to 2032 Figure 91: South Asia Market Value (US$ Million) Analysis by Services, 2016 to 2032 Figure 92: South Asia Market Value Share (%) and BPS Analysis by Services, 2022 to 2032 Figure 93: South Asia Market Y-o-Y Growth (%) Projections by Services, 2022 to 2032 Figure 94: South Asia Market Value (US$ Million) Analysis by Application, 2016 to 2032 Figure 95: South Asia Market Value Share (%) and BPS Analysis by Application, 2022 to 2032 Figure 96: South Asia Market Y-o-Y Growth (%) Projections by Application, 2022 to 2032 Figure 97: South Asia Market Attractiveness by Equipment, 2022 to 2032 Figure 98: South Asia Market Attractiveness by Services, 2022 to 2032 Figure 99: South Asia Market Attractiveness by Application, 2022 to 2032 Figure 100: South Asia Market Attractiveness by Country, 2022 to 2032 Figure 101: East Asia Market Value (US$ Million) by Equipment, 2022 to 2032 Figure 102: East Asia Market Value (US$ Million) by Services, 2022 to 2032 Figure 103: East Asia Market Value (US$ Million) by Application, 2022 to 2032 Figure 104: East Asia Market Value (US$ Million) by Country, 2022 to 2032 Figure 105: East Asia Market Value (US$ Million) Analysis by Country, 2016 to 2032 Figure 106: East Asia Market Value Share (%) and BPS Analysis by Country, 2022 to 2032 Figure 107: East Asia Market Y-o-Y Growth (%) Projections by Country, 2022 to 2032 Figure 108: East Asia Market Value (US$ Million) Analysis by Equipment, 2016 to 2032 Figure 109: East Asia Market Value Share (%) and BPS Analysis by Equipment, 2022 to 2032 Figure 110: East Asia Market Y-o-Y Growth (%) Projections by Equipment, 2022 to 2032 Figure 111: East Asia Market Value (US$ Million) Analysis by Services, 2016 to 2032 Figure 112: East Asia Market Value Share (%) and BPS Analysis by Services, 2022 to 2032 Figure 113: East Asia Market Y-o-Y Growth (%) Projections by Services, 2022 to 2032 Figure 114: East Asia Market Value (US$ Million) Analysis by Application, 2016 to 2032 Figure 115: East Asia Market Value Share (%) and BPS Analysis by Application, 2022 to 2032 Figure 116: East Asia Market Y-o-Y Growth (%) Projections by Application, 2022 to 2032 Figure 117: East Asia Market Attractiveness by Equipment, 2022 to 2032 Figure 118: East Asia Market Attractiveness by Services, 2022 to 2032 Figure 119: East Asia Market Attractiveness by Application, 2022 to 2032 Figure 120: East Asia Market Attractiveness by Country, 2022 to 2032 Figure 121: Oceania Market Value (US$ Million) by Equipment, 2022 to 2032 Figure 122: Oceania Market Value (US$ Million) by Services, 2022 to 2032 Figure 123: Oceania Market Value (US$ Million) by Application, 2022 to 2032 Figure 124: Oceania Market Value (US$ Million) by Country, 2022 to 2032 Figure 125: Oceania Market Value (US$ Million) Analysis by Country, 2016 to 2032 Figure 126: Oceania Market Value Share (%) and BPS Analysis by Country, 2022 to 2032 Figure 127: Oceania Market Y-o-Y Growth (%) Projections by Country, 2022 to 2032 Figure 128: Oceania Market Value (US$ Million) Analysis by Equipment, 2016 to 2032 Figure 129: Oceania Market Value Share (%) and BPS Analysis by Equipment, 2022 to 2032 Figure 130: Oceania Market Y-o-Y Growth (%) Projections by Equipment, 2022 to 2032 Figure 131: Oceania Market Value (US$ Million) Analysis by Services, 2016 to 2032 Figure 132: Oceania Market Value Share (%) and BPS Analysis by Services, 2022 to 2032 Figure 133: Oceania Market Y-o-Y Growth (%) Projections by Services, 2022 to 2032 Figure 134: Oceania Market Value (US$ Million) Analysis by Application, 2016 to 2032 Figure 135: Oceania Market Value Share (%) and BPS Analysis by Application, 2022 to 2032 Figure 136: Oceania Market Y-o-Y Growth (%) Projections by Application, 2022 to 2032 Figure 137: Oceania Market Attractiveness by Equipment, 2022 to 2032 Figure 138: Oceania Market Attractiveness by Services, 2022 to 2032 Figure 139: Oceania Market Attractiveness by Application, 2022 to 2032 Figure 140: Oceania Market Attractiveness by Country, 2022 to 2032 Figure 141: Middle East and Africa Market Value (US$ Million) by Equipment, 2022 to 2032 Figure 142: Middle East and Africa Market Value (US$ Million) by Services, 2022 to 2032 Figure 143: Middle East and Africa Market Value (US$ Million) by Application, 2022 to 2032 Figure 144: Middle East and Africa Market Value (US$ Million) by Country, 2022 to 2032 Figure 145: Middle East and Africa Market Value (US$ Million) Analysis by Country, 2016 to 2032 Figure 146: Middle East and Africa Market Value Share (%) and BPS Analysis by Country, 2022 to 2032 Figure 147: Middle East and Africa Market Y-o-Y Growth (%) Projections by Country, 2022 to 2032 Figure 148: Middle East and Africa Market Value (US$ Million) Analysis by Equipment, 2016 to 2032 Figure 149: Middle East and Africa Market Value Share (%) and BPS Analysis by Equipment, 2022 to 2032 Figure 150: Middle East and Africa Market Y-o-Y Growth (%) Projections by Equipment, 2022 to 2032 Figure 151: Middle East and Africa Market Value (US$ Million) Analysis by Services, 2016 to 2032 Figure 152: Middle East and Africa Market Value Share (%) and BPS Analysis by Services, 2022 to 2032 Figure 153: Middle East and Africa Market Y-o-Y Growth (%) Projections by Services, 2022 to 2032 Figure 154: Middle East and Africa Market Value (US$ Million) Analysis by Application, 2016 to 2032 Figure 155: Middle East and Africa Market Value Share (%) and BPS Analysis by Application, 2022 to 2032 Figure 156: Middle East and Africa Market Y-o-Y Growth (%) Projections by Application, 2022 to 2032 Figure 157: Middle East and Africa Market Attractiveness by Equipment, 2022 to 2032 Figure 158: Middle East and Africa Market Attractiveness by Services, 2022 to 2032 Figure 159: Middle East and Africa Market Attractiveness by Application, 2022 to 2032 Figure 160: Middle East and Africa Market Attractiveness by Country, 2022 to 2032
Need specific information?
Request CustomizationExplore Healthcare Insights
View Reports