Proteomics Outsourcing Market Size and Share Forecast Outlook 2025 to 2035

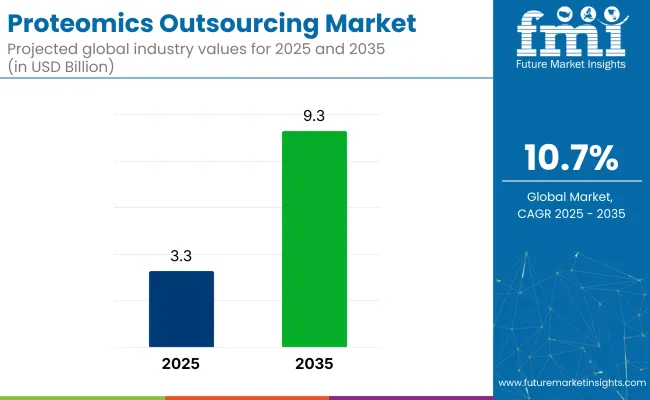
The proteomics outsourcing market is experiencing rapid expansion, projected to grow from USD 3.3 billion in 2025 to USD 9.3 billion by 2035, reflecting a CAGR of 10.7%.
Quick Stats for the Proteomics Outsourcing Market

  • Market Value (2025): USD 3.3 billion
  • Forecast Value (2035): USD 9.3 billion
  • Market Analysis CAGR: 10.7%
  • Leading Segment in 2035: Drug Discovery & Development (52% share)
  • Key Growth Region: Asia-Pacific (China)
  • Key Players: Charles River Laboratories, Thermo Fisher Scientific, Creative Proteomics, LABTOO, VProteomics, OHMX.bio, ICON plc

Proteomics Outsourcing Market

China, with a 13.2% CAGR, is expected to be the fastest-growing region, driven by increasing investment in healthcare infrastructure and biotechnology. This growth is driven by the increasing complexity of proteomics research, the rising demand for personalized medicine, and the need for cost-effective, high-quality outsourcing solutions.

The industry holds a specialized share within its parent markets. In the biotechnology market, its share is around 3-5%, as proteomics plays a crucial role in drug development, but is just one aspect of biotechnology. Within the pharmaceutical market, it accounts for approximately 6-8%, driven by the increasing reliance on proteomics for biomarker discovery and drug discovery.

In the Contract Research Organization (CRO) market, proteomics outsourcing holds about 10-12%, as CROs are often contracted to handle proteomics research for drug development and clinical trials. Within the clinical research market, its share is around 2-3%, mainly supporting diagnostic and clinical trial applications. In the life sciences research market, proteomics outsourcing contributes approximately 5-7%, due to its importance in advanced biological studies.

In the 2024 annual results, Christopher Pearce, Executive Chairman of Proteome Sciences plc, expressed optimism about the future of the industry, stating, “We are optimistic that our proteomics business has gone through a significant inflection point and that it can deliver substantial increases and returns in the future.” This reflects the company's confidence in the growth and potential of the sector, highlighting a pivotal moment for their business.

Analyzing Proteomics Outsourcing Market by Top Investment Segments

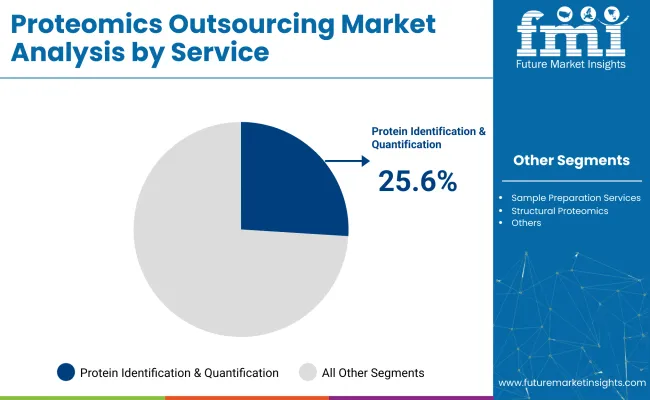
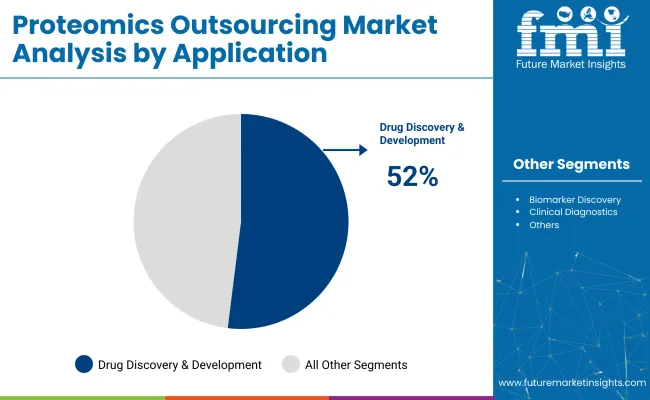
The global industry is set for significant growth through 2035. By 2025, protein identification & quantification will capture 25.6%, drug discovery & development will dominate with 52%, and pharmaceutical companies will lead the end-user segment with 36.7% in 2025. Major players include Thermo Fisher Scientific, Agilent Technologies, and Charles River Laboratories.

Protein Identification & Quantification Segment Leads with 25.6% Market Share

The protein identification & quantification segment is expected to capture 25.6% of the industry share in 2025. This service is essential for understanding the protein composition in biological samples, which is pivotal for drug discovery, disease research, and biomarker identification.

Companies like Thermo Fisher Scientific and Agilent Technologies are at the forefront, offering mass spectrometry and chromatography solutions that provide accurate protein analysis. The growing demand for proteomics in biomarker discovery, diagnostics, and personalized medicine continues to drive this segment’s growth. As proteomics becomes integral to pharmaceutical and biotechnology research, the industry for these services is poised for significant expansion.
  • Critical for drug discovery, disease research, and biomarker identification
  • Increasing reliance on mass spectrometry and chromatography for protein analysis
  • Expanding industry due to the growing focus on personalized medicine and diagnostics

Proteomics Outsourcing Market Analysis By Service

Drug Discovery & Development Segment Drives Market with 52% Share

The drug discovery & development segment is projected to lead the industry, holding 52% of the industry share in 2025. Proteomics is becoming a core component of the drug discovery process, aiding in the identification of new drug targets, the evaluation of drug efficacy, and the monitoring of clinical outcomes.

Outsourcing proteomics services allows pharmaceutical companies to access cutting-edge technology and specialized expertise without the need for significant in-house investment. This reduces time-to-market and enhances the probability of successful outcomes, particularly as pharmaceutical companies focus on biologics, targeted therapies, and personalized medicine.
  • Key role in drug target identification, drug efficacy evaluation, and clinical monitoring
  • Outsourcing enables faster development with reduced investment in in-house capabilities
  • Growing demand for proteomics in biologics, personalized medicine, and targeted therapies

Proteomics Outsourcing Market Analysis By Application

Pharmaceutical Companies Lead with 36.7% Market Share in End-User Segment

Pharmaceutical companies are expected to dominate the industry, capturing 36.7% of the industry share in 2025. These companies leverage outsourcing services to accelerate drug development, precision medicine, and biomarker discovery. By outsourcing proteomics work, pharmaceutical companies gain access to specialized expertise and high-end technology, enabling more efficient research processes without the need to invest heavily in in-house capabilities.

The increasing focus on personalized medicine, biologics, and targeted therapies will continue to drive pharmaceutical companies’ reliance on proteomics outsourcing services, further solidifying their position as the largest end-user segment in the industry.

  • Outsourcing provides access to specialized expertise and advanced technology
  • Drives faster, more efficient research processes for drug development and biomarker discovery
  • Continued growth driven by focus on personalized medicine, biologics, and precision therapies

Top Proteomics Outsourcing Market Dynamics

The industry is expanding, driven by increasing demand for advanced research in biotechnology and pharmaceuticals. However, challenges such as data security concerns and high outsourcing costs are limiting growth, especially for smaller organizations seeking specialized services.

Rising Demand for Advanced Proteomics Research in Biotechnology and Pharmaceuticals

The growing demand for proteomics services in biotechnology and pharmaceutical research is a major driver of the industry. As drug discovery, biomarker identification, and personalized medicine gain momentum, proteomics becomes critical in understanding protein functions, structures, and interactions. With increasing R&D investments in these sectors, many organizations opt to outsource to reduce costs and access specialized technologies. This enables faster, more accurate results and enhances the overall efficiency of research processes.

  • The demand for drug discovery and biomarker identification drives the need for proteomics outsourcing.
  • Outsourcing allows organizations to access specialized technologies and expertise, improving research efficiency.
  • Proteomics plays a pivotal role in advancing personalized medicine by enhancing protein research.

Data Security Concerns and High Outsourcing Costs Limit Market Growth

Despite strong demand, the industry faces challenges related to data security and the high cost of services. Proteomics research involves sensitive biological data, making data protection crucial. Unauthorized access or data breaches could lead to significant legal and financial consequences, causing hesitation among potential clients. Outsourcing can be expensive, particularly for smaller organizations that struggle to afford state-of-the-art technology and specialized personnel, making it a significant financial burden.

  • Data security and confidentiality concerns are critical challenges in outsourcing proteomics services.
  • Outsourcing can be cost-prohibitive for small to medium-sized organizations due to high service fees.
  • The need for specialized personnel and cutting-edge technology increases the overall cost of outsourcing.

Analyzing Top Countries Providing, Distributing, and Supplying Proteomics Outsourcing

Countries CAGR (2025 to 2035)
United States 8.7%
Germany 10.6%
China 13.2%
Japan 7.9%
United Kingdom 11.2%

The global industry is expected to grow at a CAGR of 10.7% from 2025 to 2035. The United States, with a CAGR of 8.7%, demonstrates steady growth, driven by a strong demand for proteomics services in drug discovery, diagnostics, and biotechnology. Germany, at 10.6%, shows stable growth, supported by its well-established biotechnology and pharmaceutical industries. China, with the highest CAGR of 13.2%, is rapidly advancing, fueled by significant investments in life sciences, an expanding biotech industry, and increasing adoption of proteomics services in research and development.

Japan, at 7.9%, shows more moderate growth, influenced by ongoing developments in biotechnology and healthcare sectors. The United Kingdom, with an 11.2% CAGR, leads in growth within the OECD countries, driven by a strong research and development base, as well as increasing reliance on outsourcing for proteomics services in both academic and pharmaceutical sectors. While OECD countries show steady to moderate growth, China stands out as the fastest-growing industry, highlighting the shift towards emerging economies as key drivers of the industry’s future expansion.

The report covers in-depth analysis of 40+ countries; five top-performing OECD and BRICS countries are highlighted below.

Analysis of Proteomics Outsourcing Market in the United States

The USA industry is expected to grow at a CAGR of 8.7% from 2025 to 2035, driven by the country’s robust pharmaceutical and biotechnology sectors. The need for high-throughput analysis and growing complexity in biological research are key drivers.

Cities like Boston, San Francisco, and San Diego are emerging as biotech hubs, where proteomics services are increasingly outsourced to specialized laboratories and CROs. United States leads in adopting next-generation sequencing (NGS) and mass spectrometry technologies, further propelling demand for proteomics services, especially in drug discovery and personalized medicine.

  • Biotech hubs like Boston, San Francisco, and San Diego driving demand
  • Growing use of next-generation sequencing (NGS) and mass spectrometry
  • Increased outsourcing to specialized laboratories and CROs

Proteomics Outsourcing Market Growth Outlook in the United Kingdom

The United Kingdom industry is projected to grow at a CAGR of 11.2% from 2025 to 2035. With world-class academic institutions like the University of Cambridge and University College London, the UK has a strong academic foundation supporting the outsourcing of proteomics services.

The growing demand for precision medicine and personalized healthcare is fueling the outsourcing of proteomics, especially in drug discovery and biomarker identification. The UK government’s support for life sciences and biotechnology research, alongside a thriving biopharma sector, further enhances the country’s position as a leader in proteomics outsourcing.

  • Academic foundations driving proteomics research innovation
  • Increasing demand for precision medicine and biomarker identification
  • Government support for life sciences and biotechnology research

Demand Forecast for Proteomics Outsourcing Market in Germany

The industry in Germany is projected to grow at a CAGR of 10.6% from 2025 to 2035. The country’s advanced research infrastructure and strong healthcare sector are key contributors to this growth. Research institutions such as the Max Planck Institute and the German Cancer Research Center play a significant role in advancing proteomics, with many companies outsourcing testing and analysis to specialized providers. The rising focus on precision medicine and clinical trials in areas such as oncology, neurology, and cardiovascular diseases is further driving demand for outsourced proteomics services.

  • Research institutions leading innovation in proteomics
  • Rising demand driven by precision medicine and clinical trials
  • Focus on oncology, neurology, and cardiovascular disease research

Growth Analysis of Proteomics Outsourcing Market in China

The industry in China is expected to grow at a CAGR of 13.2% from 2025 to 2035, largely driven by the country’s expanding biotechnology and pharmaceutical sectors. Increasing investments in biotech research and government initiatives to enhance healthcare infrastructure are boosting outsourcing activities.

As personalized medicine gains traction, the adoption of high-throughput technologies in Chinese research institutions is also growing, supporting the outsourcing of proteomics services. The expanding clinical trials and pharmaceutical industries, along with China’s large population, offer significant industry potential, particularly in biomarker discovery and early-stage clinical research.

  • Rapid expansion of biotech and pharmaceutical sectors
  • Government initiatives enhancing healthcare infrastructure
  • Growing demand for biomarker discovery and early-stage research

Future Outlook for Proteomics Outsourcing Market in Japan

The industry in Japan is expected to grow at a CAGR of 7.9% from 2025 to 2035. The country’s strong focus on life sciences and biopharmaceuticals is driving the demand for outsourced proteomics services in drug discovery, cancer research, and clinical diagnostics.

Japanese pharmaceutical companies are increasingly relying on outsourcing to conduct complex biological research in areas such as autoimmune diseases and oncology. Japan’s established research infrastructure, combined with government support for biotechnology innovations, provides a strong foundation for continued growth in proteomics outsourcing services.

  • Strong focus on life sciences and biopharmaceuticals
  • Increased outsourcing in oncology and autoimmune disease research
  • Established research infrastructure and government support for biotechnology

Leading Suppliers in the Proteomics Outsourcing Market

The global industry features a competitive landscape with dominant players, key players, and emerging players. Dominant players such as Thermo Fisher Scientific Inc., Agilent Technologies, and Merck KGaA lead the industry with extensive product portfolios, strong R&D capabilities, and robust distribution networks across pharmaceutical, biotechnology, and clinical research sectors.

Key players including Danaher Corporation, PerkinElmer, and BGI Group offer specialized services tailored to specific applications and regional industries. Emerging players, such as Charles River Laboratories, Creative Proteomics, and VProteomics, focus on innovative technologies and cost-effective solutions, expanding their presence in the global industry.

Recent Proteomics Outsourcing Industry News

  • In 2025, Thermo Fisher Scientific introduced the Orbitrap Astral Zoom mass spectrometer at the ASMS 2025 conference. This state-of-the-art instrument aims to revolutionize proteomics technology, offering enhanced depth and coverage for early detection and precision oncology applications.
  • In 2024, Creative Proteomics expanded its service offerings by introducing a label-free quantification service. This innovative approach allows for comprehensive protein quantification without the need for radioactive or chemical labels, facilitating advanced protein analysis.

Key Players in the Proteomics Outsourcing Market

  • Charles River Laboratories
  • Thermo Fisher Scientific
  • Creative Proteomics
  • LABTOO
  • VProteomics
  • OHMX.bio
  • ICON plc

Research Coverage and Scope Summary

Report Attributes Key Insights
Industry Size (2025) USD 3.3 billion
Projected Industry Value (2035) USD 9.3 billion
CAGR (2025 to 2035) 10.7%
Base Year for Estimation 2024
Historical Period 2020 to 2024
Forecast Period 2025 to 2035
Quantitative Units Revenue in USD billion
Services Protein identification & quantification, sample preparation services, post-translational modification, protein-protein interaction studies, structural proteomics
Application Drug discovery & development, biomarker discovery, clinical diagnostics, personalized medicine research, others
End User Pharmaceutical companies, biopharmaceutical companies, academic & research institutions, clinical diagnostic companies, agricultural & environmental research
Region North America, Latin America, Asia Pacific, Middle East & Africa (MEA), Europe
Countries Covered United States, Canada, Mexico, Brazil, Argentina, Germany, France, United Kingdom, Italy, Spain, Netherlands, China, India, Japan, South Korea, ANZ, GCC Countries, South Africa
Key Players Charles River Laboratories, Thermo Fisher Scientific, Creative Proteomics, LABTOO, VProteomics, OHMX.bio, ICON plc
Additional Attributes Dollar sales growth driven by increased demand for drug discovery services; Strong CAGR attributed to technological advancements in proteomics; Increasing demand for personalized medicine and biomarker discovery services.

Proteomics Outsourcing Market Analyzed by Key Investment Segments

By Services:

The segmentation is into protein identification & quantification, sample preparation services, post-translational modification, protein-protein interaction studies, structural proteomics, custom antibody development & validation, and target discovery & biomarker services.

By Application:

The segmentation is into drug discovery & development, biomarker discovery, clinical diagnostics, personalized medicine research, and others.

By End User:

The segmentation is into pharmaceutical companies, biopharmaceutical companies, academic & research institutions, clinical diagnostic companies, and agricultural & environmental research.

By Region:

The regions covered in the report include North America, Latin America, Asia Pacific, Middle East and Africa(MEA), and Europe.

Table of Content

  1. Executive Summary
    • Global Market Outlook
    • Demand-side Trends
    • Supply-side Trends
    • Technology Roadmap Analysis
    • Analysis and Recommendations
  2. Market Overview
    • Market Coverage / Taxonomy
    • Market Definition / Scope / Limitations
  3. Market Background
    • Market Dynamics
      • Drivers
      • Restraints
      • Opportunity
      • Trends
    • Scenario Forecast
      • Demand in Optimistic Scenario
      • Demand in Likely Scenario
      • Demand in Conservative Scenario
    • Opportunity Map Analysis
    • Product Life Cycle Analysis
    • Supply Chain Analysis
      • Supply Side Participants and their Roles
        • Producers
        • Mid-Level Participants (Traders/ Agents/ Brokers)
        • Wholesalers and Distributors
      • Value Added and Value Created at Node in the Supply Chain
      • List of Raw Material Suppliers
      • List of Existing and Potential Buyer’s
    • Investment Feasibility Matrix
    • Value Chain Analysis
      • Profit Margin Analysis
      • Wholesalers and Distributors
      • Retailers
    • PESTLE and Porter’s Analysis
    • Regulatory Landscape
      • By Key Regions
      • By Key Countries
    • Regional Parent Market Outlook
    • Production and Consumption Statistics
    • Import and Export Statistics
  4. Global Market Analysis 2020 to 2024 and Forecast, 2025 to 2035
    • Historical Market Size USD Billion & Million Units Analysis, 2020 to 2024
    • Current and Future Market Size USD Billion & Million Units Projections, 2025 to 2035
      • Y-o-Y Growth Trend Analysis
      • Absolute $ Opportunity Analysis
  5. Global Market Pricing Analysis 2020 to 2024 and Forecast 2025 to 2035
  6. Global Market Analysis 2020 to 2024 and Forecast 2025 to 2035, By Services
    • Introduction / Key Findings
    • Historical Market Size USD Billion & Million Units Analysis By Services, 2020 to 2024
    • Current and Future Market Size USD Billion & Million Units Analysis and Forecast By Services, 2025 to 2035
      • Protein Identification & Quantification
      • Sample Preparation Services
      • Post-Translational Modification
      • Protein-Protein Interaction Studies
      • Structural Proteomics
      • Custom Antibody Development & Validation
      • Target Discovery & Biomarker Services
    • Y-o-Y Growth Trend Analysis By Services, 2020 to 2024
    • Absolute $ Opportunity Analysis By Services, 2025 to 2035
  7. Global Market Analysis 2020 to 2024 and Forecast 2025 to 2035, By Application
    • Introduction / Key Findings
    • Historical Market Size USD Billion & Million Units Analysis By Application, 2020 to 2024
    • Current and Future Market Size USD Billion & Million Units Analysis and Forecast By Application, 2025 to 2035
      • Drug Discovery & Development
      • Biomarker Discovery
      • Clinical Diagnostics
      • Personalized Medicine Research
      • Others
    • Y-o-Y Growth Trend Analysis By Application, 2020 to 2024
    • Absolute $ Opportunity Analysis By Application, 2025 to 2035
  8. Global Market Analysis 2020 to 2024 and Forecast 2025 to 2035, By End User
    • Introduction / Key Findings
    • Historical Market Size USD Billion & Million Units Analysis By End User, 2020 to 2024
    • Current and Future Market Size USD Billion & Million Units Analysis and Forecast By End User, 2025 to 2035
      • Pharmaceutical Companies
      • Biopharmaceutical Companies
      • Academic & Research Institutions
      • Clinical Diagnostic Companies
      • Agricultural & Environmental Research
    • Y-o-Y Growth Trend Analysis By End User, 2020 to 2024
    • Absolute $ Opportunity Analysis By End User, 2025 to 2035
  9. Global Market Analysis 2020 to 2024 and Forecast 2025 to 2035, By Region
    • Introduction
    • Historical Market Size USD Billion & Million Units Analysis By Region, 2020 to 2024
    • Current Market Size USD Billion & Million Units Analysis and Forecast By Region, 2025 to 2035
      • North America
      • Latin America
      • Western Europe
      • Eastern Europe
      • East Asia
      • South Asia & Pacific
      • Middle East and Africa
    • Market Attractiveness Analysis By Region
  10. North America Market Analysis 2020 to 2024 and Forecast 2025 to 2035, By Country
    • Historical Market Size USD Billion & Million Units Trend Analysis By Market Taxonomy, 2020 to 2024
    • Market Size USD Billion & Million Units Forecast By Market Taxonomy, 2025 to 2035
      • By Country
        • USA
        • Canada
        • Mexico
      • By Services
      • By Application
      • By End User
    • Market Attractiveness Analysis
      • By Country
      • By Services
      • By Application
      • By End User
    • Key Takeaways
  11. Latin America Market Analysis 2020 to 2024 and Forecast 2025 to 2035, By Country
    • Historical Market Size USD Billion & Million Units Trend Analysis By Market Taxonomy, 2020 to 2024
    • Market Size USD Billion & Million Units Forecast By Market Taxonomy, 2025 to 2035
      • By Country
        • Brazil
        • Argentina
        • Rest of LATAM
      • By Services
      • By Application
      • By End User
    • Market Attractiveness Analysis
      • By Country
      • By Services
      • By Application
      • By End User
    • Key Takeaways
  12. Western Europe Market Analysis 2020 to 2024 and Forecast 2025 to 2035, By Country
    • Historical Market Size USD Billion & Million Units Trend Analysis By Market Taxonomy, 2020 to 2024
    • Market Size USD Billion & Million Units Forecast By Market Taxonomy, 2025 to 2035
      • By Country
        • Germany
        • Italy
        • France
        • UK
        • Spain
        • BENELUX
        • Nordic
        • Rest of W. Europe
      • By Services
      • By Application
      • By End User
    • Market Attractiveness Analysis
      • By Country
      • By Services
      • By Application
      • By End User
    • Key Takeaways
  13. Eastern Europe Market Analysis 2020 to 2024 and Forecast 2025 to 2035, By Country
    • Historical Market Size USD Billion & Million Units Trend Analysis By Market Taxonomy, 2020 to 2024
    • Market Size USD Billion & Million Units Forecast By Market Taxonomy, 2025 to 2035
      • By Country
        • Russia
        • Hungary
        • Poland
        • Balkan & Baltics
        • Rest of E. Europe
      • By Services
      • By Application
      • By End User
    • Market Attractiveness Analysis
      • By Country
      • By Services
      • By Application
      • By End User
    • Key Takeaways
  14. East Asia Market Analysis 2020 to 2024 and Forecast 2025 to 2035, By Country
    • Historical Market Size USD Billion & Million Units Trend Analysis By Market Taxonomy, 2020 to 2024
    • Market Size USD Billion & Million Units Forecast By Market Taxonomy, 2025 to 2035
      • By Country
        • China
        • Japan
        • South Korea
      • By Services
      • By Application
      • By End User
    • Market Attractiveness Analysis
      • By Country
      • By Services
      • By Application
      • By End User
    • Key Takeaways
  15. South Asia & Pacific Market Analysis 2020 to 2024 and Forecast 2025 to 2035, By Country
    • Historical Market Size USD Billion & Million Units Trend Analysis By Market Taxonomy, 2020 to 2024
    • Market Size USD Billion & Million Units Forecast By Market Taxonomy, 2025 to 2035
      • By Country
        • India
        • Australia & New Zealand
        • ASEAN
        • Rest of SAP
      • By Services
      • By Application
      • By End User
    • Market Attractiveness Analysis
      • By Country
      • By Services
      • By Application
      • By End User
    • Key Takeaways
  16. Middle East and Africa Market Analysis 2020 to 2024 and Forecast 2025 to 2035, By Country
    • Historical Market Size USD Billion & Million Units Trend Analysis By Market Taxonomy, 2020 to 2024
    • Market Size USD Billion & Million Units Forecast By Market Taxonomy, 2025 to 2035
      • By Country
        • GCC Countries
        • Northern Africa
        • South Africa
        • Turkiye
        • Rest of MEA
      • By Services
      • By Application
      • By End User
    • Market Attractiveness Analysis
      • By Country
      • By Services
      • By Application
      • By End User
    • Key Takeaways
  17. Key Countries Market Analysis
    • USA
      • Pricing Analysis
      • Market Share Analysis, 2024
        • By Services
        • By Application
        • By End User
    • Canada
      • Pricing Analysis
      • Market Share Analysis, 2024
        • By Services
        • By Application
        • By End User
    • Brazil
      • Pricing Analysis
      • Market Share Analysis, 2024
        • By Services
        • By Application
        • By End User
    • Mexico
      • Pricing Analysis
      • Market Share Analysis, 2024
        • By Services
        • By Application
        • By End User
    • Argentina
      • Pricing Analysis
      • Market Share Analysis, 2024
        • By Services
        • By Application
        • By End User
  18. Market Structure Analysis
    • Competition Dashboard
    • Competition Benchmarking
    • Market Share Analysis of Top Players
      • By Regional
      • By Services
      • By Application
      • By End User
  19. Competition Analysis
    • Competition Deep Dive
      • Charles River Laboratories
        • Overview
        • Product Portfolio
        • Profitability by Market Segments (Product/Age /Sales Channel/Region)
        • Sales Footprint
        • Strategy Overview
          • Marketing Strategy
          • Product Strategy
          • Channel Strategy
      • Thermo Fisher Scientific
        • Overview
        • Product Portfolio
        • Profitability by Market Segments (Product/Age /Sales Channel/Region)
        • Sales Footprint
        • Strategy Overview
          • Marketing Strategy
          • Product Strategy
          • Channel Strategy
      • Creative Proteomics
        • Overview
        • Product Portfolio
        • Profitability by Market Segments (Product/Age /Sales Channel/Region)
        • Sales Footprint
        • Strategy Overview
          • Marketing Strategy
          • Product Strategy
          • Channel Strategy
      • LABTOO
        • Overview
        • Product Portfolio
        • Profitability by Market Segments (Product/Age /Sales Channel/Region)
        • Sales Footprint
        • Strategy Overview
          • Marketing Strategy
          • Product Strategy
          • Channel Strategy
      • VProteomics
        • Overview
        • Product Portfolio
        • Profitability by Market Segments (Product/Age /Sales Channel/Region)
        • Sales Footprint
        • Strategy Overview
          • Marketing Strategy
          • Product Strategy
          • Channel Strategy
      • OHMX.bio
        • Overview
        • Product Portfolio
        • Profitability by Market Segments (Product/Age /Sales Channel/Region)
        • Sales Footprint
        • Strategy Overview
          • Marketing Strategy
          • Product Strategy
          • Channel Strategy
      • ICON plc
        • Overview
        • Product Portfolio
        • Profitability by Market Segments (Product/Age /Sales Channel/Region)
        • Sales Footprint
        • Strategy Overview
          • Marketing Strategy
          • Product Strategy
          • Channel Strategy
  20. Assumptions & Acronyms Used
  21. Research Methodology

List of Tables

  • Table 1: Global Market USD Billion Forecast by Region, 2020 to 2035
  • Table 2: Global Market Million Units Forecast by Region, 2020 to 2035
  • Table 3: Global Market USD Billion Forecast by Services, 2020 to 2035
  • Table 4: Global Market Million Units Forecast by Services, 2020 to 2035
  • Table 5: Global Market USD Billion Forecast by Application, 2020 to 2035
  • Table 6: Global Market Million Units Forecast by Application, 2020 to 2035
  • Table 7: Global Market USD Billion Forecast by End User, 2020 to 2035
  • Table 8: Global Market Million Units Forecast by End User, 2020 to 2035
  • Table 9: North America Market USD Billion Forecast by Country, 2020 to 2035
  • Table 10: North America Market Million Units Forecast by Country, 2020 to 2035
  • Table 11: North America Market USD Billion Forecast by Services, 2020 to 2035
  • Table 12: North America Market Million Units Forecast by Services, 2020 to 2035
  • Table 13: North America Market USD Billion Forecast by Application, 2020 to 2035
  • Table 14: North America Market Million Units Forecast by Application, 2020 to 2035
  • Table 15: North America Market USD Billion Forecast by End User, 2020 to 2035
  • Table 16: North America Market Million Units Forecast by End User, 2020 to 2035
  • Table 17: Latin America Market USD Billion Forecast by Country, 2020 to 2035
  • Table 18: Latin America Market Million Units Forecast by Country, 2020 to 2035
  • Table 19: Latin America Market USD Billion Forecast by Services, 2020 to 2035
  • Table 20: Latin America Market Million Units Forecast by Services, 2020 to 2035
  • Table 21: Latin America Market USD Billion Forecast by Application, 2020 to 2035
  • Table 22: Latin America Market Million Units Forecast by Application, 2020 to 2035
  • Table 23: Latin America Market USD Billion Forecast by End User, 2020 to 2035
  • Table 24: Latin America Market Million Units Forecast by End User, 2020 to 2035
  • Table 25: Western Europe Market USD Billion Forecast by Country, 2020 to 2035
  • Table 26: Western Europe Market Million Units Forecast by Country, 2020 to 2035
  • Table 27: Western Europe Market USD Billion Forecast by Services, 2020 to 2035
  • Table 28: Western Europe Market Million Units Forecast by Services, 2020 to 2035
  • Table 29: Western Europe Market USD Billion Forecast by Application, 2020 to 2035
  • Table 30: Western Europe Market Million Units Forecast by Application, 2020 to 2035
  • Table 31: Western Europe Market USD Billion Forecast by End User, 2020 to 2035
  • Table 32: Western Europe Market Million Units Forecast by End User, 2020 to 2035
  • Table 33: Eastern Europe Market USD Billion Forecast by Country, 2020 to 2035
  • Table 34: Eastern Europe Market Million Units Forecast by Country, 2020 to 2035
  • Table 35: Eastern Europe Market USD Billion Forecast by Services, 2020 to 2035
  • Table 36: Eastern Europe Market Million Units Forecast by Services, 2020 to 2035
  • Table 37: Eastern Europe Market USD Billion Forecast by Application, 2020 to 2035
  • Table 38: Eastern Europe Market Million Units Forecast by Application, 2020 to 2035
  • Table 39: Eastern Europe Market USD Billion Forecast by End User, 2020 to 2035
  • Table 40: Eastern Europe Market Million Units Forecast by End User, 2020 to 2035
  • Table 41: East Asia Market USD Billion Forecast by Country, 2020 to 2035
  • Table 42: East Asia Market Million Units Forecast by Country, 2020 to 2035
  • Table 43: East Asia Market USD Billion Forecast by Services, 2020 to 2035
  • Table 44: East Asia Market Million Units Forecast by Services, 2020 to 2035
  • Table 45: East Asia Market USD Billion Forecast by Application, 2020 to 2035
  • Table 46: East Asia Market Million Units Forecast by Application, 2020 to 2035
  • Table 47: East Asia Market USD Billion Forecast by End User, 2020 to 2035
  • Table 48: East Asia Market Million Units Forecast by End User, 2020 to 2035
  • Table 49: South Asia & Pacific Market USD Billion Forecast by Country, 2020 to 2035
  • Table 50: South Asia & Pacific Market Million Units Forecast by Country, 2020 to 2035
  • Table 51: South Asia & Pacific Market USD Billion Forecast by Services, 2020 to 2035
  • Table 52: South Asia & Pacific Market Million Units Forecast by Services, 2020 to 2035
  • Table 53: South Asia & Pacific Market USD Billion Forecast by Application, 2020 to 2035
  • Table 54: South Asia & Pacific Market Million Units Forecast by Application, 2020 to 2035
  • Table 55: South Asia & Pacific Market USD Billion Forecast by End User, 2020 to 2035
  • Table 56: South Asia & Pacific Market Million Units Forecast by End User, 2020 to 2035
  • Table 57: Middle East and Africa Market USD Billion Forecast by Country, 2020 to 2035
  • Table 58: Middle East and Africa Market Million Units Forecast by Country, 2020 to 2035
  • Table 59: Middle East and Africa Market USD Billion Forecast by Services, 2020 to 2035
  • Table 60: Middle East and Africa Market Million Units Forecast by Services, 2020 to 2035
  • Table 61: Middle East and Africa Market USD Billion Forecast by Application, 2020 to 2035
  • Table 62: Middle East and Africa Market Million Units Forecast by Application, 2020 to 2035
  • Table 63: Middle East and Africa Market USD Billion Forecast by End User, 2020 to 2035
  • Table 64: Middle East and Africa Market Million Units Forecast by End User, 2020 to 2035

List of Figures

  • Figure 1: Global Market Million Units Forecast 2020 to 2035
  • Figure 2: Global Market Pricing Analysis
  • Figure 3: Global Market USD Billion Forecast 2020 to 2035
  • Figure 4: Global Market Value Share and BPS Analysis by Services, 2025 and 2035
  • Figure 5: Global Market Y-o-Y Growth Comparison by Services, 2025 to 2035
  • Figure 6: Global Market Attractiveness Analysis by Services
  • Figure 7: Global Market Value Share and BPS Analysis by Application, 2025 and 2035
  • Figure 8: Global Market Y-o-Y Growth Comparison by Application, 2025 to 2035
  • Figure 9: Global Market Attractiveness Analysis by Application
  • Figure 10: Global Market Value Share and BPS Analysis by End User, 2025 and 2035
  • Figure 11: Global Market Y-o-Y Growth Comparison by End User, 2025 to 2035
  • Figure 12: Global Market Attractiveness Analysis by End User
  • Figure 13: Global Market USD Billion Share and BPS Analysis by Region, 2025 and 2035
  • Figure 14: Global Market Y-o-Y Growth Comparison by Region, 2025 to 2035
  • Figure 15: Global Market Attractiveness Analysis by Region
  • Figure 16: North America Market Incremental $ Opportunity, 2025 to 2035
  • Figure 17: Latin America Market Incremental $ Opportunity, 2025 to 2035
  • Figure 18: Western Europe Market Incremental $ Opportunity, 2025 to 2035
  • Figure 19: Eastern Europe Market Incremental $ Opportunity, 2025 to 2035
  • Figure 20: East Asia Market Incremental $ Opportunity, 2025 to 2035
  • Figure 21: South Asia & Pacific Market Incremental $ Opportunity, 2025 to 2035
  • Figure 22: Middle East and Africa Market Incremental $ Opportunity, 2025 to 2035
  • Figure 23: North America Market Value Share and BPS Analysis by Country, 2025 and 2035
  • Figure 24: North America Market Value Share and BPS Analysis by Services, 2025 and 2035
  • Figure 25: North America Market Y-o-Y Growth Comparison by Services, 2025 to 2035
  • Figure 26: North America Market Attractiveness Analysis by Services
  • Figure 27: North America Market Value Share and BPS Analysis by Application, 2025 and 2035
  • Figure 28: North America Market Y-o-Y Growth Comparison by Application, 2025 to 2035
  • Figure 29: North America Market Attractiveness Analysis by Application
  • Figure 30: North America Market Value Share and BPS Analysis by End User, 2025 and 2035
  • Figure 31: North America Market Y-o-Y Growth Comparison by End User, 2025 to 2035
  • Figure 32: North America Market Attractiveness Analysis by End User
  • Figure 33: Latin America Market Value Share and BPS Analysis by Country, 2025 and 2035
  • Figure 34: Latin America Market Value Share and BPS Analysis by Services, 2025 and 2035
  • Figure 35: Latin America Market Y-o-Y Growth Comparison by Services, 2025 to 2035
  • Figure 36: Latin America Market Attractiveness Analysis by Services
  • Figure 37: Latin America Market Value Share and BPS Analysis by Application, 2025 and 2035
  • Figure 38: Latin America Market Y-o-Y Growth Comparison by Application, 2025 to 2035
  • Figure 39: Latin America Market Attractiveness Analysis by Application
  • Figure 40: Latin America Market Value Share and BPS Analysis by End User, 2025 and 2035
  • Figure 41: Latin America Market Y-o-Y Growth Comparison by End User, 2025 to 2035
  • Figure 42: Latin America Market Attractiveness Analysis by End User
  • Figure 43: Western Europe Market Value Share and BPS Analysis by Country, 2025 and 2035
  • Figure 44: Western Europe Market Value Share and BPS Analysis by Services, 2025 and 2035
  • Figure 45: Western Europe Market Y-o-Y Growth Comparison by Services, 2025 to 2035
  • Figure 46: Western Europe Market Attractiveness Analysis by Services
  • Figure 47: Western Europe Market Value Share and BPS Analysis by Application, 2025 and 2035
  • Figure 48: Western Europe Market Y-o-Y Growth Comparison by Application, 2025 to 2035
  • Figure 49: Western Europe Market Attractiveness Analysis by Application
  • Figure 50: Western Europe Market Value Share and BPS Analysis by End User, 2025 and 2035
  • Figure 51: Western Europe Market Y-o-Y Growth Comparison by End User, 2025 to 2035
  • Figure 52: Western Europe Market Attractiveness Analysis by End User
  • Figure 53: Eastern Europe Market Value Share and BPS Analysis by Country, 2025 and 2035
  • Figure 54: Eastern Europe Market Value Share and BPS Analysis by Services, 2025 and 2035
  • Figure 55: Eastern Europe Market Y-o-Y Growth Comparison by Services, 2025 to 2035
  • Figure 56: Eastern Europe Market Attractiveness Analysis by Services
  • Figure 57: Eastern Europe Market Value Share and BPS Analysis by Application, 2025 and 2035
  • Figure 58: Eastern Europe Market Y-o-Y Growth Comparison by Application, 2025 to 2035
  • Figure 59: Eastern Europe Market Attractiveness Analysis by Application
  • Figure 60: Eastern Europe Market Value Share and BPS Analysis by End User, 2025 and 2035
  • Figure 61: Eastern Europe Market Y-o-Y Growth Comparison by End User, 2025 to 2035
  • Figure 62: Eastern Europe Market Attractiveness Analysis by End User
  • Figure 63: East Asia Market Value Share and BPS Analysis by Country, 2025 and 2035
  • Figure 64: East Asia Market Value Share and BPS Analysis by Services, 2025 and 2035
  • Figure 65: East Asia Market Y-o-Y Growth Comparison by Services, 2025 to 2035
  • Figure 66: East Asia Market Attractiveness Analysis by Services
  • Figure 67: East Asia Market Value Share and BPS Analysis by Application, 2025 and 2035
  • Figure 68: East Asia Market Y-o-Y Growth Comparison by Application, 2025 to 2035
  • Figure 69: East Asia Market Attractiveness Analysis by Application
  • Figure 70: East Asia Market Value Share and BPS Analysis by End User, 2025 and 2035
  • Figure 71: East Asia Market Y-o-Y Growth Comparison by End User, 2025 to 2035
  • Figure 72: East Asia Market Attractiveness Analysis by End User
  • Figure 73: South Asia & Pacific Market Value Share and BPS Analysis by Country, 2025 and 2035
  • Figure 74: South Asia & Pacific Market Value Share and BPS Analysis by Services, 2025 and 2035
  • Figure 75: South Asia & Pacific Market Y-o-Y Growth Comparison by Services, 2025 to 2035
  • Figure 76: South Asia & Pacific Market Attractiveness Analysis by Services
  • Figure 77: South Asia & Pacific Market Value Share and BPS Analysis by Application, 2025 and 2035
  • Figure 78: South Asia & Pacific Market Y-o-Y Growth Comparison by Application, 2025 to 2035
  • Figure 79: South Asia & Pacific Market Attractiveness Analysis by Application
  • Figure 80: South Asia & Pacific Market Value Share and BPS Analysis by End User, 2025 and 2035
  • Figure 81: South Asia & Pacific Market Y-o-Y Growth Comparison by End User, 2025 to 2035
  • Figure 82: South Asia & Pacific Market Attractiveness Analysis by End User
  • Figure 83: Middle East and Africa Market Value Share and BPS Analysis by Country, 2025 and 2035
  • Figure 84: Middle East and Africa Market Value Share and BPS Analysis by Services, 2025 and 2035
  • Figure 85: Middle East and Africa Market Y-o-Y Growth Comparison by Services, 2025 to 2035
  • Figure 86: Middle East and Africa Market Attractiveness Analysis by Services
  • Figure 87: Middle East and Africa Market Value Share and BPS Analysis by Application, 2025 and 2035
  • Figure 88: Middle East and Africa Market Y-o-Y Growth Comparison by Application, 2025 to 2035
  • Figure 89: Middle East and Africa Market Attractiveness Analysis by Application
  • Figure 90: Middle East and Africa Market Value Share and BPS Analysis by End User, 2025 and 2035
  • Figure 91: Middle East and Africa Market Y-o-Y Growth Comparison by End User, 2025 to 2035
  • Figure 92: Middle East and Africa Market Attractiveness Analysis by End User
  • Figure 93: Global Market - Tier Structure Analysis
  • Figure 94: Global Market - Company Share Analysis

Frequently Asked Questions

What is the projected value of the proteomics outsourcing market in 2025?

The projected value of the industry in 2025 is USD 3.3 billion.

What is the forecast value of the proteomics outsourcing market by 2035?

The forecast value of the industry by 2035 is USD 9.3 billion.

What is the expected CAGR for the proteomics outsourcing market from 2025 to 2035?

The expected CAGR for the industry from 2025 to 2035 is 10.7%.

Which segment will lead the proteomics outsourcing market in 2035?

Drug discovery & development is expected to lead the industry in 2035, with approximately 52% industry share.

Which region is expected to experience the highest growth in the proteomics outsourcing market?

China is expected to be the fastest-growing in the industry, with a projected 13.2% CAGR.

Explore Similar Insights

Future Market Insights

Proteomics Outsourcing Market