Reports

- Global Locations -

Headquarters

Future Market Insights, Inc.

Christiana Corporate, 200
Continental Drive, Suite 401,
Newark, Delaware - 19713,
United States

T: +1-845-579-5705

Americas

Future Market Insights, Inc.

616 Corporate Way, Suite 2-9018,
Valley Cottage, NY 10989, United States

T: +1-347-918-3531

MEA

Future Market Insights

1602-6 Jumeirah Bay X2 Tower, Plot No: JLT-PH2-X2A,
Jumeirah Lakes Towers, Dubai,
United Arab Emirates

Europe

Future Market Insights

3rd Floor, 207 Regent Street,
W1B 3HH London
United Kingdom

T: + 44 (0) 20 8123 9659
D: +44 (0) 20 3287 4268

Asia Pacific

Future Market Insights

IndiaLand Global Tech Park, Unit UG-1, Behind Grand HighStreet, Phase 1, Hinjawadi, MH, Pune – 411057, India

Automotive Engineering Services Outsourcing Market Outlook (2023 to 2033)

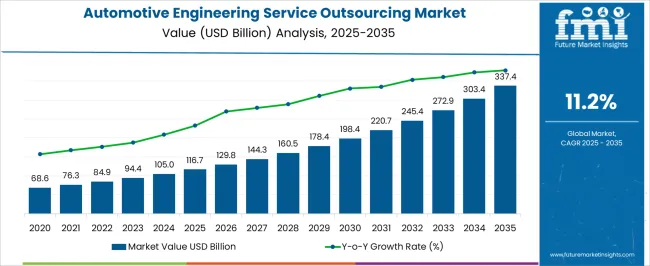
The global automotive engineering services outsourcing market size is set to reach US$ 94.38 Billion in 2023. Overall sales of automotive engineering services outsourcing are likely to surge at 11.2% CAGR, taking the forecasted market valuation to US$ 272.84 Billion by the end of 2033.

Various trends are disrupting the market. Some of them include the following:

Electric vehicles (EVs) and autonomous vehicles (AVs) are driving demand for specialized engineering services.

The electric and autonomous vehicle market growth is creating a need for engineering services providers specializing in these areas. Companies in the automotive engineering services outsourcing market invest in EV and AV engineering capabilities, such as battery design and integration, advanced driver-assistance systems (ADAS), and sensor integration.

The industry is experiencing a shift towards software and digital engineering services.

As vehicles become more connected and automated, the role of software in the development process is becoming increasingly important. Outsourced automotive services providers are expanding their software engineering capabilities to meet this demand, including software design, development, testing, and integration.

There is a growing demand for end-to-end product development and integration support.

As vehicles become more complex, there is a need for engineering services providers that can offer end-to-end product development and integration support. This includes everything from concept development and design to prototyping, testing, and manufacturing. Providers that can offer these services can reduce time-to-market and improve product quality.

Artificial intelligence (AI) and machine learning (ML) in automotive engineering are becoming more prevalent. Automotive engineering services outsourcing providers are using AI and ML to optimize vehicle performance and reduce costs. For example, AI is used to optimize engine performance, while ML is used to analyze vehicle data and predict maintenance requirements.

Outsourcing automotive engineering services to emerging markets is becoming more popular.

Companies increasingly outsource automotive engineering services to emerging markets such as India and China. This is due to lower costs and increasing expertise in these regions. Providers in these markets can offer competitive rates while maintaining high levels of quality.

Automotive manufacturers are looking for providers offering a wide range of services. Automotive manufacturers are looking for engineering services providers that can offer a wide range of services, including design, development, and testing. By working with a single provider, manufacturers can reduce reliance on multiple vendors and improve project management.

Attributes Details
Automotive Engineering Services Outsourcing Market CAGR (2023 to 2033) 11.2%
Automotive Engineering Services Outsourcing Market Size (2023) US$ 94.38 Billion
Automotive Engineering Services Outsourcing Market Size (2033) US$ 272.84 Billion

Don't pay for what you don't need

Customize your report by selecting specific countries or regions and save 30%!

Automotive Engineering Services Outsourcing Demand Analysis (2018 to 2022) Vs Market Outlook (2023 to 2033)

According to recent research by Future Market Insights, the automotive engineering services outsourcing market is projected to expand at a rate of 11.2% during the forecast period from 2023 to 2033. The market outlook could be divided into the short-term, medium-term, and long-term.

Short-term (2023 to 2025): As vehicles become more complex, there is a growing demand for engineering services providers that can offer specialized skills and expertise to manage this complexity. This includes electric and autonomous vehicle technologies, software engineering, and end-to-end product development and integration.

Medium-term (2025 to 2028): The automotive industry is highly competitive, and manufacturers are under pressure to reduce costs while maintaining high levels of quality. Outsourcing engineering services to lower-cost regions such as India and China can help manufacturers reduce costs and stay competitive.

Long-term (2028 to 2033): Automotive manufacturers increasingly focus on their core competencies, design and branding, and outsourcing non-core activities, such as engineering services. This allows them to concentrate on their strengths while still maintaining high levels of quality in areas outside of their core competencies.

Comparative Adjacent Table

Automotive Engineering Services Outsourcing Market:

Attributes Automotive Engineering Services Outsourcing Market
CAGR (2023 to 2033) 11.2%
Market Value (2026) US$ 272.84 Billion
Growth Factor The rapid rise in Research and Development activities and technological advancement in outsourcing services. across the globe are expected to boost the market in the forecast period.
Opportunity Ongoing development in automotive engineering and implementation of favorable government schemes are anticipated to offer opportunities for expansion in the forecast period.

Global Automotive Engineering Service Market:

Attributes Global Automotive Engineering Service Market
CAGR (2023 to 2033) 8.6%
Market Value (2026) US$ 377.93 Billion
Growth Factor With the increasing demand for connectivity, vehicle manufacturers are developing and acquiring new expertise in vehicle software and electronics and are expected to boost the market growth in the forecast period.
Opportunity Advancements in the automotive sector are expected to offer significant opportunities for market expansion in the forecast period.

Global Engineering Service Outsourcing System Market:

Attributes Global Engineering Service Outsourcing System Market
CAGR (2023 to 2033) 30.2%
Market Value (2026) US$ 9.9 Trillion
Growth Factor An increase in the adoption of automation and integrated services is anticipated to expand the market growth in the forecast period.
Opportunity Ongoing technological development in the sector is expected to offer significant opportunities for expansion in the coming time
Sudip Saha
Sudip Saha

Principal Consultant

Talk to Analyst

Find your sweet spots for generating winning opportunities in this market.

What are the drivers in the market?

The automotive industry is on the cusp of a major revolution, with automation and robotics taking center stage. From machine vision and collaborative robots to AI for driverless cars and cognitive computing in IoT-connected cars, the industry is witnessing rapid advancements that are transforming the way we think about mobility. And as the industry looks towards a future that is increasingly automated, the scope for outsourcing automotive engineering services is taking a turn for the better.

The demand for precision agriculture, smart manufacturing, and digital medicine is paving the way for innovative technologies like Artificial Intelligence (AI) and machine learning. Automotive manufacturers are no strangers to these technologies, and they are harnessing their potential to push the boundaries of what is possible. Collaborations between OEMs and engineering service providers are becoming more common, with major players outsourcing everything from idea generation and system development to complete vehicle design.

The rising adoption of automotive engineering service outsourcing is being driven by a diverse set of pressures, including globalization, operational complexity, and technological challenges. As OEMs seek greater flexibility to meet customer needs in a wide variety of regional markets, they are outsourcing engineering services to service providers who can help them stay ahead of the competition. And with the advent of connected cars and cyber security challenges, software changes and software management tasks are becoming increasingly complex, leading to a higher demand for outsourcing.

The success of the automotive industry hinges on the seamless integration of these new technologies into the supply chain. Any glitch or kink in rendering these services could potentially disrupt the entire supply chain, causing significant ramifications for automotive manufacturers. Service providers like AVL and FVA are already ushering in a revolution in this marketplace, developing next-level transmission systems for key automobiles and facilitating data exchange between their respective systems.

As OEMs continue to focus on improving their core competencies, outsourcing engineering services to third-party providers is becoming increasingly common. By doing so, they can concentrate on their strengths while still maintaining high levels of quality in areas outside of their core competencies. This is a win-win situation for all parties involved, ensuring a smooth, uninterrupted workflow and pushing the industry toward an exciting future.

What is restraining the market growth?

Increased Trend of In-house Design May Impedes the Automotive Engineering Service Outsourcing Market Growth.

Despite optimistic growth projections, the global automotive engineering service outsourcing market faces various obstacles restraining its growth to some extent. Due to the complexity of designing the transmission, powertrain, and engine, many manufacturers focus on designing these parts in their in-house facilities instead of outsourcing them from engineering service providers, which may impede market growth.

The delay in assignment by companies and the economical decline in the automotive sector may also hamper the market's growth. Also, the high cost of engineering services and technological limitations associated with outsourcing services can affect market growth.
Get the data you need at a Fraction of the cost

Personalize your report by choosing insights you need
and save 40%!

Regional Analysis                                                                   

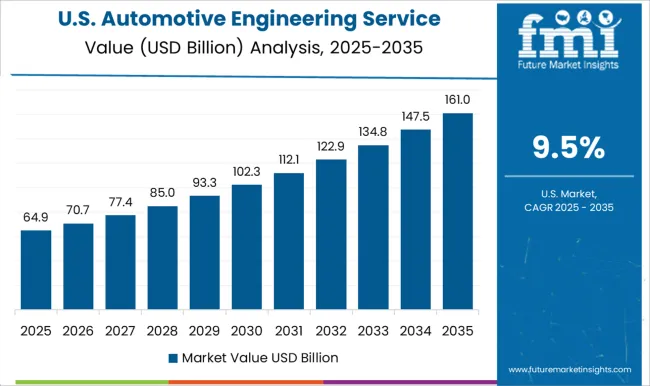
What is driving the United States Automotive Engineering Services Outsourcing Market?

One of the main drivers in the United States is the need for automotive original equipment manufacturers (OEMs) to improve their core competencies while outsourcing other aspects of their businesses to service providers. With globalization's rise, demand fragmentation, operational complexity, and technological challenges, OEMs are seeking greater flexibility to meet customer needs in various regional markets. Outsourcing engineering services to third-party providers enables them to concentrate on their strengths while maintaining high-quality levels in areas outside of their core competencies.

The United States Automotive Engineering Services Outsourcing market is highly competitive with several prominent players. Here are some of the top companies in the United States market:

  • Altran - A global leader in engineering and Research and Development services, Altran offers a wide range of engineering services for the automotive industry, including vehicle electrification, autonomous driving, and connected cars.
  • HCL Technologies - A global technology company, HCL provides end-to-end engineering services to the automotive industry, including product development, testing, and quality engineering.
  • Capgemini - A consulting, technology, and outsourcing company, Capgemini offers a variety of engineering services for the automotive industry, such as product design and development, manufacturing, and supply chain management.

How is the Indian Automotive Engineering Services Outsourcing Market expected to grow during the forecast period?

The automotive industry is shifting towards electric vehicles, driving the growth of the automotive ESO market in India. The government's initiatives, such as the National Electric Mobility Mission Plan (NEMMP) and Faster Adoption and Manufacturing of (Hybrid &) Electric Vehicles in India (FAME India), are expected to accelerate the adoption of electric vehicles in the country. This, in turn, is expected to increase the demand for engineering services for electric vehicles.

Top companies in India’s Automotive Engineering Services Outsourcing market:
  • Tata Technologies: Tata Technologies is a global engineering services company headquartered in Pune, Maharashtra. The company provides a wide range of services to the automotive industry, including product design, engineering, and testing.
  • Infosys: Infosys is a global technology consulting and services company headquartered in Bangalore, Karnataka.

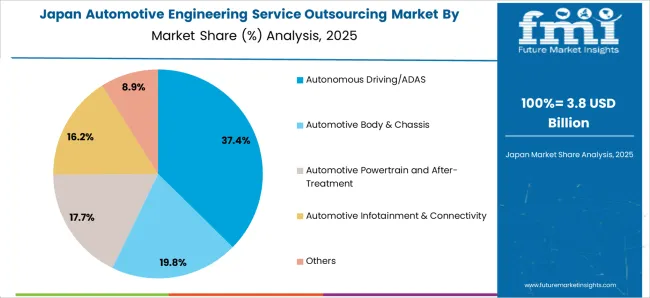
What is the Japanese Automotive Engineering Services Outsourcing Market Outlook?

The research by Future Market Insights cites factors such as increasing demand for electric and hybrid vehicles, increasing focus on product innovation, and cost-cutting measures by automotive manufacturers as the key drivers of this growth.

The Japanese government has also taken initiatives to promote the adoption of electric and hybrid vehicles in the country. The government's policies, including tax incentives, subsidies, and investments in infrastructure, are expected to drive the demand for engineering services outsourcing in the automotive industry.

Top companies in the Japanese Automotive Engineering Services Outsourcing market include:

  • Hitachi Automotive Systems: Hitachi Automotive Systems is a global automotive supplier headquartered in Tokyo, Japan. The company offers a range of products and services, including powertrain systems, electric vehicle systems, chassis systems, and advanced driver assistance systems. They also provide engineering and design services to help automotive manufacturers improve the performance, safety, and efficiency of their vehicles.
  • Denso Corporation: Denso Corporation is a global automotive supplier headquartered in Kariya, Japan. Denso Corporation is committed to sustainability and reducing its environmental impact. They have set a target to achieve carbon neutrality in their own operations by 2035 and are also working to reduce the carbon footprint of their products and services.
  • Aisin Seiki Co., Ltd.: Aisin Seiki Co., Ltd. is a global automotive supplier headquartered in Kariya, Japan. The company offers a range of products and services, including powertrain systems, chassis systems, brake systems, and hydraulic systems.

What are the drivers and opportunities in the Chinese Automotive Engineering Services Outsourcing Market?

China is the world's largest automotive market, with a growing middle class and increasing demand for high-quality vehicles. This has created opportunities for engineering service providers to partner with domestic automotive manufacturers to develop new products and technologies that meet the needs of Chinese consumers.

Top companies in the Chinese Automotive Engineering Services Outsourcing market include:

  • Neusoft Reach Automotive Technology (Shanghai) Co., Ltd.: Neusoft Reach Automotive Technology is a subsidiary of the Neusoft Corporation, a Chinese IT solutions provider. The company offers a range of services to the automotive industry, including engineering and design, prototyping and testing, and software development.
  • Infosys China: Infosys is a global technology consulting and engineering services provider with a significant presence in China. The company offers a range of services to the automotive industry, including product development, engineering and design, and digital transformation solutions.
  • HiRain Technologies Co., Ltd.: HiRain Technologies is a Chinese automotive engineering services provider that offers a range of services to the automotive industry, including powertrain development, automotive electronics, and connected car solutions.

Category-wise Insights

By Application Which Segment Dominates the Global Automotive Engineering Service Outsourcing Market?

The powertrain and after-treatment experience major uptake

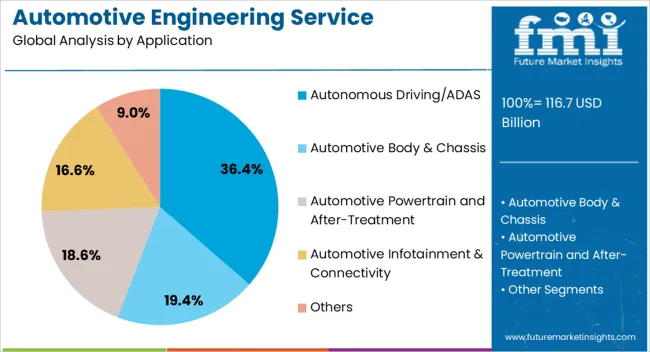
By application, the global market is segmented into autonomous driving/ADAS, body & chassis, powertrain, after-treatment, infotainment & connectivity, and others. Among these, the powertrain and aftermarket segment is likely to account for the largest share of outsourced automotive engineering services during the forecast period.

This can be attributed to the rising focus on curbing carbon emissions and designing a cost-effective engine. This has resulted in a rise in the adoption of green technologies including the electrification of the power train. powertrains are replacements for Internal Combustion Engines (ICE) fueled by petroleum and gasoline.

The powertrain and after-treatment segment accounts for a revenue share of around 30.5% of the automotive engineering service outsourcing market. On the other hand, the autonomous driving / ADAS segment accounts for a significant growth rate due to its ability to sense, identify its environment, and offer safe movement.

Which Segment Accounts for Maximum Automotive Engineering Service Outsourcing Market Growth?

Prototyping to Remain the Lucrative service segment of Automotive Engineering Service Outsourcing

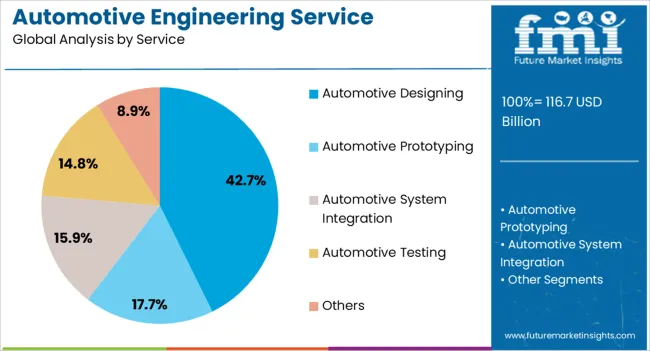
Based on service, the outsource automotive engineering services market has been segmented into designing, prototyping, system integration, and testing. However, FMI’s latest automotive engineering service outsourcing market forecast anticipates the prototyping segment to account for a market share of 30%, attributed to the increasing deployment of 3D printing technology in the automotive industry to design a prototype of an assembly, certain parts, or a model of an entire car.

3D technology helps manufacturers to find loopholes, this is expected to help them to take corrective measures. For high productivity of the design, to create a database for manufacturing, and to improve the quality of design companies are deploying 3D CAD software.

On the other hand, the design segment is anticipated to register significant growth. The growth of the designing segment is attributed to investments by the manufacturers in designing, research & development, and collaborating with the engineering service providers to construct advanced automobile features for the consumers.

Start-up Ecosystem: How key Players are opening Frontiers for Future Growth?

Manufacturers are adopting various marketing strategies such as new product launches, geographical expansion, mergers and acquisitions, partnerships, and collaboration to identify the interest of potential buyers and create a larger customer base. PVG Technology, Sai Auto & Engineering Company, Ari, Ficosa, and Borgward Technology India Pvt Ltd are some of the startup companies operating in the automotive engineering service outsourcing market.
  • PVG Technology & PVG Automotive Pvt. Ltd was founded in 2012, with experience in designing and executing strategies within the engineering domain. It is committed to building strong and sustainable relationships with customers and external partners. PVG is the Design & Development Service provider in automotive, Aircraft components, industrial equipment, and machine tools to OEMs and suppliers.

Competitive Landscape

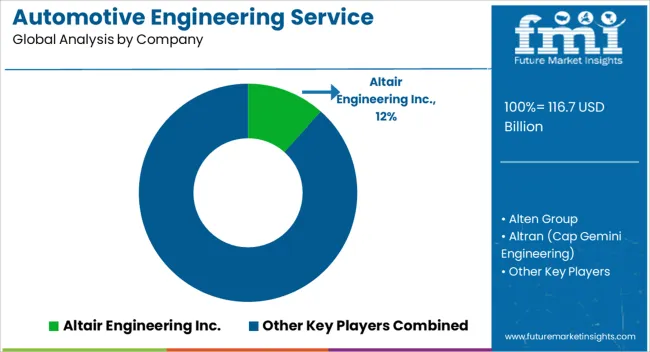
Key players in the global outsource automotive engineering services market include AKKA, Altair Engineering Inc., Alten Group, Altran (Capgemini Engineering), ARRK Product Development Group Ltd., ASAP Holding Gmbh, AVL List GmbH, Bertrandt AG, EDAG Group, ESG Elektroniksystem- und Logistik-GmbH, FEV Group GmbH, Horiba, LTD., IAV, ITK Engineering GmbH Kistler Group, P3 group GmbH, RLE INTERNATIONAL Group. Recent updates from the industry are:

  • In January 2021: Bertrandt launched a mobile ball impact testing device with a standardized design. It is likely to enable customers to carry out independent testing of interior components in compliance with the regulations.
  • In June 2022: FEV and ProLogium Technology, a leader in solid-state batteries, signed an MOU to cooperate in the development of solid-state battery systems.
  • In January 2022: ALTEN Spain, the subsidiary of the ALTEN Group, acquired Clevertask. Through this acquisition, ALTEN Spain would be able to explore renewed opportunities and capabilities for their teams and clients. The clever task is expected to continue to operate under the guidance of its founders and current management team while benefiting from the synergies, knowledge, and corporate services of the ALTEN Group.

Key Segments

By Application:

  • Autonomous Driving/ADAS
  • Automotive Body & Chassis
  • Automotive Powertrain and After-Treatment
  • Automotive Infotainment & Connectivity
  • Others

By Service:

  • Automotive Designing
  • Automotive Prototyping
  • Automotive System Integration
  • Automotive Testing
  • Others

By Location:

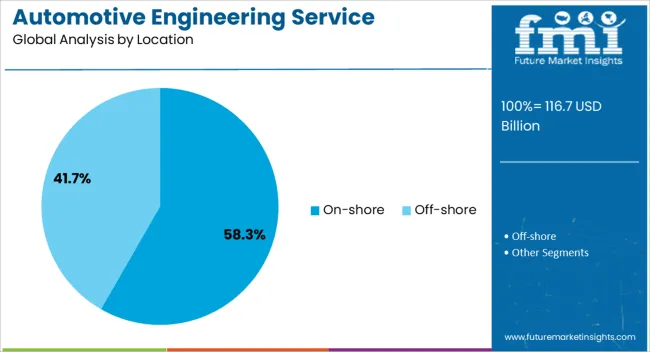
  • On-shore
  • Off-shore

By Region:

  • North America
  • Latin America
  • Europe
  • East Asia
  • South Asia
  • Oceania

Frequently Asked Questions

What is the Automotive Engineering Service Market Growth Rate from 2023 to 2033?

The market is likely to expand at an 11.2% CAGR from 2023 to 2033.

What is the Current Market Valuation?

The market totals US$ 94.38 billion in 2023.

What is Restraining the Market Growth?

Increased trends in in-house design may impede market growth.

How Big will the Automotive Engineering Service Market by 2033?

The market is estimated to value at US$ 272.84 billion by 2033.

Who are the Leading Industry Players?

FEV Group GmbH, Horiba, LTD., and IAV are the leading industry players.

Table of Content

1. Executive Summary | Automotive Engineering Service Outsourcing Market

    1.1. Global Market Outlook

    1.2. Demand-side Trends

    1.3. Supply-side Trends

    1.4. Technology Roadmap Analysis

    1.5. Analysis and Recommendations

2. Market Overview

    2.1. Market Coverage / Taxonomy

    2.2. Market Definition / Scope / Limitations

3. Market Background

    3.1. Market Dynamics

        3.1.1. Drivers

        3.1.2. Restraints

        3.1.3. Opportunity

        3.1.4. Trends

    3.2. Scenario Forecast

        3.2.1. Demand in Optimistic Scenario

        3.2.2. Demand in Likely Scenario

        3.2.3. Demand in Conservative Scenario

    3.3. Opportunity Map Analysis

    3.4. Investment Feasibility Matrix

    3.5. PESTLE and Porter’s Analysis

    3.6. Regulatory Landscape

        3.6.1. By Key Regions

        3.6.2. By Key Countries

    3.7. Regional Parent Market Outlook

4. Global Market Analysis 2018 to 2022 and Forecast, 2023 to 2033

    4.1. Historical Market Size Value (US$ Million) Analysis, 2018 to 2022

    4.2. Current and Future Market Size Value (US$ Million) Projections, 2023 to 2033

        4.2.1. Y-o-Y Growth Trend Analysis

        4.2.2. Absolute Opportunity Analysis

5. Global Market Analysis 2018 to 2022 and Forecast 2023 to 2033, By Application

    5.1. Introduction / Key Findings

    5.2. Historical Market Size Value (US$ Million) Analysis By Application, 2018 to 2022

    5.3. Current and Future Market Size Value (US$ Million) Analysis and Forecast By Application, 2023 to 2033

        5.3.1. Autonomous Driving/ADAS

        5.3.2. Body & Chassis

        5.3.3. Powertrain and After-Treatment

        5.3.4. Infotainment & Connectivity

        5.3.5. Others

    5.4. Y-o-Y Growth Trend Analysis By Application, 2018 to 2022

    5.5. Absolute Opportunity Analysis By Application, 2023 to 2033

6. Global Market Analysis 2018 to 2022 and Forecast 2023 to 2033, By Service

    6.1. Introduction / Key Findings

    6.2. Historical Market Size Value (US$ Million) Analysis By Service, 2018 to 2022

    6.3. Current and Future Market Size Value (US$ Million) Analysis and Forecast By Service, 2023 to 2033

        6.3.1. Designing

        6.3.2. Prototyping

        6.3.3. System Integration

        6.3.4. Testing

        6.3.5. Others

    6.4. Y-o-Y Growth Trend Analysis By Service, 2018 to 2022

    6.5. Absolute Opportunity Analysis By Service, 2023 to 2033

7. Global Market Analysis 2018 to 2022 and Forecast 2023 to 2033, By Location

    7.1. Introduction / Key Findings

    7.2. Historical Market Size Value (US$ Million) Analysis By Location, 2018 to 2022

    7.3. Current and Future Market Size Value (US$ Million) Analysis and Forecast By Location, 2023 to 2033

        7.3.1. On-shore

        7.3.2. Off-shore

    7.4. Y-o-Y Growth Trend Analysis By Location, 2018 to 2022

    7.5. Absolute Opportunity Analysis By Location, 2023 to 2033

8. Global Market Analysis 2018 to 2022 and Forecast 2023 to 2033, By Region

    8.1. Introduction

    8.2. Historical Market Size Value (US$ Million) Analysis By Region, 2018 to 2022

    8.3. Current Market Size Value (US$ Million) Analysis and Forecast By Region, 2023 to 2033

        8.3.1. North America

        8.3.2. Latin America

        8.3.3. Europe

        8.3.4. South Asia

        8.3.5. East Asia

        8.3.6. Oceania

        8.3.7. Middle East and Africa (MEA)

    8.4. Market Attractiveness Analysis By Region

9. North America Market Analysis 2018 to 2022 and Forecast 2023 to 2033, By Country

    9.1. Historical Market Size Value (US$ Million) Trend Analysis By Market Taxonomy, 2018 to 2022

    9.2. Market Size Value (US$ Million) Forecast By Market Taxonomy, 2023 to 2033

        9.2.1. By Country

            9.2.1.1. United States of America

            9.2.1.2. Canada

        9.2.2. By Application

        9.2.3. By Service

        9.2.4. By Location

    9.3. Market Attractiveness Analysis

        9.3.1. By Country

        9.3.2. By Application

        9.3.3. By Service

        9.3.4. By Location

    9.4. Key Takeaways

10. Latin America Market Analysis 2018 to 2022 and Forecast 2023 to 2033, By Country

    10.1. Historical Market Size Value (US$ Million) Trend Analysis By Market Taxonomy, 2018 to 2022

    10.2. Market Size Value (US$ Million) Forecast By Market Taxonomy, 2023 to 2033

        10.2.1. By Country

            10.2.1.1. Brazil

            10.2.1.2. Mexico

            10.2.1.3. Rest of Latin America

        10.2.2. By Application

        10.2.3. By Service

        10.2.4. By Location

    10.3. Market Attractiveness Analysis

        10.3.1. By Country

        10.3.2. By Application

        10.3.3. By Service

        10.3.4. By Location

    10.4. Key Takeaways

11. Europe Market Analysis 2018 to 2022 and Forecast 2023 to 2033, By Country

    11.1. Historical Market Size Value (US$ Million) Trend Analysis By Market Taxonomy, 2018 to 2022

    11.2. Market Size Value (US$ Million) Forecast By Market Taxonomy, 2023 to 2033

        11.2.1. By Country

            11.2.1.1. Germany

            11.2.1.2. United Kingdom

            11.2.1.3. France

            11.2.1.4. Spain

            11.2.1.5. Italy

            11.2.1.6. Rest of Europe

        11.2.2. By Application

        11.2.3. By Service

        11.2.4. By Location

    11.3. Market Attractiveness Analysis

        11.3.1. By Country

        11.3.2. By Application

        11.3.3. By Service

        11.3.4. By Location

    11.4. Key Takeaways

12. South Asia Market Analysis 2018 to 2022 and Forecast 2023 to 2033, By Country

    12.1. Historical Market Size Value (US$ Million) Trend Analysis By Market Taxonomy, 2018 to 2022

    12.2. Market Size Value (US$ Million) Forecast By Market Taxonomy, 2023 to 2033

        12.2.1. By Country

            12.2.1.1. India

            12.2.1.2. Malaysia

            12.2.1.3. Singapore

            12.2.1.4. Thailand

            12.2.1.5. Rest of South Asia

        12.2.2. By Application

        12.2.3. By Service

        12.2.4. By Location

    12.3. Market Attractiveness Analysis

        12.3.1. By Country

        12.3.2. By Application

        12.3.3. By Service

        12.3.4. By Location

    12.4. Key Takeaways

13. East Asia Market Analysis 2018 to 2022 and Forecast 2023 to 2033, By Country

    13.1. Historical Market Size Value (US$ Million) Trend Analysis By Market Taxonomy, 2018 to 2022

    13.2. Market Size Value (US$ Million) Forecast By Market Taxonomy, 2023 to 2033

        13.2.1. By Country

            13.2.1.1. China

            13.2.1.2. Japan

            13.2.1.3. South Korea

        13.2.2. By Application

        13.2.3. By Service

        13.2.4. By Location

    13.3. Market Attractiveness Analysis

        13.3.1. By Country

        13.3.2. By Application

        13.3.3. By Service

        13.3.4. By Location

    13.4. Key Takeaways

14. Oceania Market Analysis 2018 to 2022 and Forecast 2023 to 2033, By Country

    14.1. Historical Market Size Value (US$ Million) Trend Analysis By Market Taxonomy, 2018 to 2022

    14.2. Market Size Value (US$ Million) Forecast By Market Taxonomy, 2023 to 2033

        14.2.1. By Country

            14.2.1.1. Australia

            14.2.1.2. New Zealand

        14.2.2. By Application

        14.2.3. By Service

        14.2.4. By Location

    14.3. Market Attractiveness Analysis

        14.3.1. By Country

        14.3.2. By Application

        14.3.3. By Service

        14.3.4. By Location

    14.4. Key Takeaways

15. MEA Market Analysis 2018 to 2022 and Forecast 2023 to 2033, By Country

    15.1. Historical Market Size Value (US$ Million) Trend Analysis By Market Taxonomy, 2018 to 2022

    15.2. Market Size Value (US$ Million) Forecast By Market Taxonomy, 2023 to 2033

        15.2.1. By Country

            15.2.1.1. GCC Countries

            15.2.1.2. South Africa

            15.2.1.3. Israel

            15.2.1.4. Rest of Middle East and Africa (MEA)

        15.2.2. By Application

        15.2.3. By Service

        15.2.4. By Location

    15.3. Market Attractiveness Analysis

        15.3.1. By Country

        15.3.2. By Application

        15.3.3. By Service

        15.3.4. By Location

    15.4. Key Takeaways

16. Key Countries Market Analysis

    16.1. United States of America

        16.1.1. Pricing Analysis

        16.1.2. Market Share Analysis, 2022

            16.1.2.1. By Application

            16.1.2.2. By Service

            16.1.2.3. By Location

    16.2. Canada

        16.2.1. Pricing Analysis

        16.2.2. Market Share Analysis, 2022

            16.2.2.1. By Application

            16.2.2.2. By Service

            16.2.2.3. By Location

    16.3. Brazil

        16.3.1. Pricing Analysis

        16.3.2. Market Share Analysis, 2022

            16.3.2.1. By Application

            16.3.2.2. By Service

            16.3.2.3. By Location

    16.4. Mexico

        16.4.1. Pricing Analysis

        16.4.2. Market Share Analysis, 2022

            16.4.2.1. By Application

            16.4.2.2. By Service

            16.4.2.3. By Location

    16.5. Germany

        16.5.1. Pricing Analysis

        16.5.2. Market Share Analysis, 2022

            16.5.2.1. By Application

            16.5.2.2. By Service

            16.5.2.3. By Location

    16.6.

        16.6.1. Pricing Analysis

        16.6.2. Market Share Analysis, 2022

            16.6.2.1. By Application

            16.6.2.2. By Service

            16.6.2.3. By Location

    16.7. France

        16.7.1. Pricing Analysis

        16.7.2. Market Share Analysis, 2022

            16.7.2.1. By Application

            16.7.2.2. By Service

            16.7.2.3. By Location

    16.8. Spain

        16.8.1. Pricing Analysis

        16.8.2. Market Share Analysis, 2022

            16.8.2.1. By Application

            16.8.2.2. By Service

            16.8.2.3. By Location

    16.9. Italy

        16.9.1. Pricing Analysis

        16.9.2. Market Share Analysis, 2022

            16.9.2.1. By Application

            16.9.2.2. By Service

            16.9.2.3. By Location

    16.10. India

        16.10.1. Pricing Analysis

        16.10.2. Market Share Analysis, 2022

            16.10.2.1. By Application

            16.10.2.2. By Service

            16.10.2.3. By Location

    16.11. Malaysia

        16.11.1. Pricing Analysis

        16.11.2. Market Share Analysis, 2022

            16.11.2.1. By Application

            16.11.2.2. By Service

            16.11.2.3. By Location

    16.12. Singapore

        16.12.1. Pricing Analysis

        16.12.2. Market Share Analysis, 2022

            16.12.2.1. By Application

            16.12.2.2. By Service

            16.12.2.3. By Location

    16.13. Thailand

        16.13.1. Pricing Analysis

        16.13.2. Market Share Analysis, 2022

            16.13.2.1. By Application

            16.13.2.2. By Service

            16.13.2.3. By Location

    16.14. China

        16.14.1. Pricing Analysis

        16.14.2. Market Share Analysis, 2022

            16.14.2.1. By Application

            16.14.2.2. By Service

            16.14.2.3. By Location

    16.15. Japan

        16.15.1. Pricing Analysis

        16.15.2. Market Share Analysis, 2022

            16.15.2.1. By Application

            16.15.2.2. By Service

            16.15.2.3. By Location

    16.16. South Korea

        16.16.1. Pricing Analysis

        16.16.2. Market Share Analysis, 2022

            16.16.2.1. By Application

            16.16.2.2. By Service

            16.16.2.3. By Location

    16.17. Australia

        16.17.1. Pricing Analysis

        16.17.2. Market Share Analysis, 2022

            16.17.2.1. By Application

            16.17.2.2. By Service

            16.17.2.3. By Location

    16.18. New Zealand

        16.18.1. Pricing Analysis

        16.18.2. Market Share Analysis, 2022

            16.18.2.1. By Application

            16.18.2.2. By Service

            16.18.2.3. By Location

    16.19. GCC Countries

        16.19.1. Pricing Analysis

        16.19.2. Market Share Analysis, 2022

            16.19.2.1. By Application

            16.19.2.2. By Service

            16.19.2.3. By Location

    16.20. South Africa

        16.20.1. Pricing Analysis

        16.20.2. Market Share Analysis, 2022

            16.20.2.1. By Application

            16.20.2.2. By Service

            16.20.2.3. By Location

    16.21. Israel

        16.21.1. Pricing Analysis

        16.21.2. Market Share Analysis, 2022

            16.21.2.1. By Application

            16.21.2.2. By Service

            16.21.2.3. By Location

17. Market Structure Analysis

    17.1. Competition Dashboard

    17.2. Competition Benchmarking

    17.3. Market Share Analysis of Top Players

        17.3.1. By Regional

        17.3.2. By Application

        17.3.3. By Service

        17.3.4. By Location

18. Competition Analysis

    18.1. Competition Deep Dive

        18.1.1. Altair Engineering Inc.

            18.1.1.1. Overview

            18.1.1.2. Product Portfolio

            18.1.1.3. Profitability by Market Segments

            18.1.1.4. Sales Footprint

            18.1.1.5. Strategy Overview

                18.1.1.5.1. Marketing Strategy

        18.1.2. Alten Group

            18.1.2.1. Overview

            18.1.2.2. Product Portfolio

            18.1.2.3. Profitability by Market Segments

            18.1.2.4. Sales Footprint

            18.1.2.5. Strategy Overview

                18.1.2.5.1. Marketing Strategy

        18.1.3. Altran (Cap Gemini Engineering)

            18.1.3.1. Overview

            18.1.3.2. Product Portfolio

            18.1.3.3. Profitability by Market Segments

            18.1.3.4. Sales Footprint

            18.1.3.5. Strategy Overview

                18.1.3.5.1. Marketing Strategy

        18.1.4. ARRK Product Development Group Ltd.

            18.1.4.1. Overview

            18.1.4.2. Product Portfolio

            18.1.4.3. Profitability by Market Segments

            18.1.4.4. Sales Footprint

            18.1.4.5. Strategy Overview

                18.1.4.5.1. Marketing Strategy

        18.1.5. ASAP Holding Gmbh

            18.1.5.1. Overview

            18.1.5.2. Product Portfolio

            18.1.5.3. Profitability by Market Segments

            18.1.5.4. Sales Footprint

            18.1.5.5. Strategy Overview

                18.1.5.5.1. Marketing Strategy

        18.1.6. AVL List GmbH

            18.1.6.1. Overview

            18.1.6.2. Product Portfolio

            18.1.6.3. Profitability by Market Segments

            18.1.6.4. Sales Footprint

            18.1.6.5. Strategy Overview

                18.1.6.5.1. Marketing Strategy

        18.1.7. Bertrandt AG

            18.1.7.1. Overview

            18.1.7.2. Product Portfolio

            18.1.7.3. Profitability by Market Segments

            18.1.7.4. Sales Footprint

            18.1.7.5. Strategy Overview

                18.1.7.5.1. Marketing Strategy

        18.1.8. EDAG Group

            18.1.8.1. Overview

            18.1.8.2. Product Portfolio

            18.1.8.3. Profitability by Market Segments

            18.1.8.4. Sales Footprint

            18.1.8.5. Strategy Overview

                18.1.8.5.1. Marketing Strategy

        18.1.9. ITK Engineering GmbH Kistler Group

            18.1.9.1. Overview

            18.1.9.2. Product Portfolio

            18.1.9.3. Profitability by Market Segments

            18.1.9.4. Sales Footprint

            18.1.9.5. Strategy Overview

                18.1.9.5.1. Marketing Strategy

        18.1.10. FEV Group GmbH

            18.1.10.1. Overview

            18.1.10.2. Product Portfolio

            18.1.10.3. Profitability by Market Segments

            18.1.10.4. Sales Footprint

            18.1.10.5. Strategy Overview

                18.1.10.5.1. Marketing Strategy

        18.1.11. Horiba, LTD.

            18.1.11.1. Overview

            18.1.11.2. Product Portfolio

            18.1.11.3. Profitability by Market Segments

            18.1.11.4. Sales Footprint

            18.1.11.5. Strategy Overview

                18.1.11.5.1. Marketing Strategy

19. Assumptions & Acronyms Used

20. Research Methodology

Don't pay for what you don't need

Customize your report by selecting specific countries or regions and save 30%!

List of Tables

Table 1: Global Market Value (US$ Million) Forecast by Region, 2018 to 2033

Table 2: Global Market Value (US$ Million) Forecast by Application, 2018 to 2033

Table 3: Global Market Value (US$ Million) Forecast by Service, 2018 to 2033

Table 4: Global Market Value (US$ Million) Forecast by Location, 2018 to 2033

Table 5: North America Market Value (US$ Million) Forecast by Country, 2018 to 2033

Table 6: North America Market Value (US$ Million) Forecast by Application, 2018 to 2033

Table 7: North America Market Value (US$ Million) Forecast by Service, 2018 to 2033

Table 8: North America Market Value (US$ Million) Forecast by Location, 2018 to 2033

Table 9: Latin America Market Value (US$ Million) Forecast by Country, 2018 to 2033

Table 10: Latin America Market Value (US$ Million) Forecast by Application, 2018 to 2033

Table 11: Latin America Market Value (US$ Million) Forecast by Service, 2018 to 2033

Table 12: Latin America Market Value (US$ Million) Forecast by Location, 2018 to 2033

Table 13: Europe Market Value (US$ Million) Forecast by Country, 2018 to 2033

Table 14: Europe Market Value (US$ Million) Forecast by Application, 2018 to 2033

Table 15: Europe Market Value (US$ Million) Forecast by Service, 2018 to 2033

Table 16: Europe Market Value (US$ Million) Forecast by Location, 2018 to 2033

Table 17: South Asia Market Value (US$ Million) Forecast by Country, 2018 to 2033

Table 18: South Asia Market Value (US$ Million) Forecast by Application, 2018 to 2033

Table 19: South Asia Market Value (US$ Million) Forecast by Service, 2018 to 2033

Table 20: South Asia Market Value (US$ Million) Forecast by Location, 2018 to 2033

Table 21: East Asia Market Value (US$ Million) Forecast by Country, 2018 to 2033

Table 22: East Asia Market Value (US$ Million) Forecast by Application, 2018 to 2033

Table 23: East Asia Market Value (US$ Million) Forecast by Service, 2018 to 2033

Table 24: East Asia Market Value (US$ Million) Forecast by Location, 2018 to 2033

Table 25: Oceania Market Value (US$ Million) Forecast by Country, 2018 to 2033

Table 26: Oceania Market Value (US$ Million) Forecast by Application, 2018 to 2033

Table 27: Oceania Market Value (US$ Million) Forecast by Service, 2018 to 2033

Table 28: Oceania Market Value (US$ Million) Forecast by Location, 2018 to 2033

Table 29: Middle East and Africa Market Value (US$ Million) Forecast by Country, 2018 to 2033

Table 30: Middle East and Africa Market Value (US$ Million) Forecast by Application, 2018 to 2033

Table 31: Middle East and Africa Market Value (US$ Million) Forecast by Service, 2018 to 2033

Table 32: Middle East and Africa Market Value (US$ Million) Forecast by Location, 2018 to 2033
Sudip Saha
Sudip Saha

Principal Consultant

Talk to Analyst

Find your sweet spots for generating winning opportunities in this market.

List of Charts

Figure 1: Global Market Value (US$ Million) by Application, 2023 to 2033

Figure 2: Global Market Value (US$ Million) by Service, 2023 to 2033

Figure 3: Global Market Value (US$ Million) by Location, 2023 to 2033

Figure 4: Global Market Value (US$ Million) by Region, 2023 to 2033

Figure 5: Global Market Value (US$ Million) Analysis by Region, 2018 to 2033

Figure 6: Global Market Value Share (%) and BPS Analysis by Region, 2023 to 2033

Figure 7: Global Market Y-o-Y Growth (%) Projections by Region, 2023 to 2033

Figure 8: Global Market Value (US$ Million) Analysis by Application, 2018 to 2033

Figure 9: Global Market Value Share (%) and BPS Analysis by Application, 2023 to 2033

Figure 10: Global Market Y-o-Y Growth (%) Projections by Application, 2023 to 2033

Figure 11: Global Market Value (US$ Million) Analysis by Service, 2018 to 2033

Figure 12: Global Market Value Share (%) and BPS Analysis by Service, 2023 to 2033

Figure 13: Global Market Y-o-Y Growth (%) Projections by Service, 2023 to 2033

Figure 14: Global Market Value (US$ Million) Analysis by Location, 2018 to 2033

Figure 15: Global Market Value Share (%) and BPS Analysis by Location, 2023 to 2033

Figure 16: Global Market Y-o-Y Growth (%) Projections by Location, 2023 to 2033

Figure 17: Global Market Attractiveness by Application, 2023 to 2033

Figure 18: Global Market Attractiveness by Service, 2023 to 2033

Figure 19: Global Market Attractiveness by Location, 2023 to 2033

Figure 20: Global Market Attractiveness by Region, 2023 to 2033

Figure 21: North America Market Value (US$ Million) by Application, 2023 to 2033

Figure 22: North America Market Value (US$ Million) by Service, 2023 to 2033

Figure 23: North America Market Value (US$ Million) by Location, 2023 to 2033

Figure 24: North America Market Value (US$ Million) by Country, 2023 to 2033

Figure 25: North America Market Value (US$ Million) Analysis by Country, 2018 to 2033

Figure 26: North America Market Value Share (%) and BPS Analysis by Country, 2023 to 2033

Figure 27: North America Market Y-o-Y Growth (%) Projections by Country, 2023 to 2033

Figure 28: North America Market Value (US$ Million) Analysis by Application, 2018 to 2033

Figure 29: North America Market Value Share (%) and BPS Analysis by Application, 2023 to 2033

Figure 30: North America Market Y-o-Y Growth (%) Projections by Application, 2023 to 2033

Figure 31: North America Market Value (US$ Million) Analysis by Service, 2018 to 2033

Figure 32: North America Market Value Share (%) and BPS Analysis by Service, 2023 to 2033

Figure 33: North America Market Y-o-Y Growth (%) Projections by Service, 2023 to 2033

Figure 34: North America Market Value (US$ Million) Analysis by Location, 2018 to 2033

Figure 35: North America Market Value Share (%) and BPS Analysis by Location, 2023 to 2033

Figure 36: North America Market Y-o-Y Growth (%) Projections by Location, 2023 to 2033

Figure 37: North America Market Attractiveness by Application, 2023 to 2033

Figure 38: North America Market Attractiveness by Service, 2023 to 2033

Figure 39: North America Market Attractiveness by Location, 2023 to 2033

Figure 40: North America Market Attractiveness by Country, 2023 to 2033

Figure 41: Latin America Market Value (US$ Million) by Application, 2023 to 2033

Figure 42: Latin America Market Value (US$ Million) by Service, 2023 to 2033

Figure 43: Latin America Market Value (US$ Million) by Location, 2023 to 2033

Figure 44: Latin America Market Value (US$ Million) by Country, 2023 to 2033

Figure 45: Latin America Market Value (US$ Million) Analysis by Country, 2018 to 2033

Figure 46: Latin America Market Value Share (%) and BPS Analysis by Country, 2023 to 2033

Figure 47: Latin America Market Y-o-Y Growth (%) Projections by Country, 2023 to 2033

Figure 48: Latin America Market Value (US$ Million) Analysis by Application, 2018 to 2033

Figure 49: Latin America Market Value Share (%) and BPS Analysis by Application, 2023 to 2033

Figure 50: Latin America Market Y-o-Y Growth (%) Projections by Application, 2023 to 2033

Figure 51: Latin America Market Value (US$ Million) Analysis by Service, 2018 to 2033

Figure 52: Latin America Market Value Share (%) and BPS Analysis by Service, 2023 to 2033

Figure 53: Latin America Market Y-o-Y Growth (%) Projections by Service, 2023 to 2033

Figure 54: Latin America Market Value (US$ Million) Analysis by Location, 2018 to 2033

Figure 55: Latin America Market Value Share (%) and BPS Analysis by Location, 2023 to 2033

Figure 56: Latin America Market Y-o-Y Growth (%) Projections by Location, 2023 to 2033

Figure 57: Latin America Market Attractiveness by Application, 2023 to 2033

Figure 58: Latin America Market Attractiveness by Service, 2023 to 2033

Figure 59: Latin America Market Attractiveness by Location, 2023 to 2033

Figure 60: Latin America Market Attractiveness by Country, 2023 to 2033

Figure 61: Europe Market Value (US$ Million) by Application, 2023 to 2033

Figure 62: Europe Market Value (US$ Million) by Service, 2023 to 2033

Figure 63: Europe Market Value (US$ Million) by Location, 2023 to 2033

Figure 64: Europe Market Value (US$ Million) by Country, 2023 to 2033

Figure 65: Europe Market Value (US$ Million) Analysis by Country, 2018 to 2033

Figure 66: Europe Market Value Share (%) and BPS Analysis by Country, 2023 to 2033

Figure 67: Europe Market Y-o-Y Growth (%) Projections by Country, 2023 to 2033

Figure 68: Europe Market Value (US$ Million) Analysis by Application, 2018 to 2033

Figure 69: Europe Market Value Share (%) and BPS Analysis by Application, 2023 to 2033

Figure 70: Europe Market Y-o-Y Growth (%) Projections by Application, 2023 to 2033

Figure 71: Europe Market Value (US$ Million) Analysis by Service, 2018 to 2033

Figure 72: Europe Market Value Share (%) and BPS Analysis by Service, 2023 to 2033

Figure 73: Europe Market Y-o-Y Growth (%) Projections by Service, 2023 to 2033

Figure 74: Europe Market Value (US$ Million) Analysis by Location, 2018 to 2033

Figure 75: Europe Market Value Share (%) and BPS Analysis by Location, 2023 to 2033

Figure 76: Europe Market Y-o-Y Growth (%) Projections by Location, 2023 to 2033

Figure 77: Europe Market Attractiveness by Application, 2023 to 2033

Figure 78: Europe Market Attractiveness by Service, 2023 to 2033

Figure 79: Europe Market Attractiveness by Location, 2023 to 2033

Figure 80: Europe Market Attractiveness by Country, 2023 to 2033

Figure 81: South Asia Market Value (US$ Million) by Application, 2023 to 2033

Figure 82: South Asia Market Value (US$ Million) by Service, 2023 to 2033

Figure 83: South Asia Market Value (US$ Million) by Location, 2023 to 2033

Figure 84: South Asia Market Value (US$ Million) by Country, 2023 to 2033

Figure 85: South Asia Market Value (US$ Million) Analysis by Country, 2018 to 2033

Figure 86: South Asia Market Value Share (%) and BPS Analysis by Country, 2023 to 2033

Figure 87: South Asia Market Y-o-Y Growth (%) Projections by Country, 2023 to 2033

Figure 88: South Asia Market Value (US$ Million) Analysis by Application, 2018 to 2033

Figure 89: South Asia Market Value Share (%) and BPS Analysis by Application, 2023 to 2033

Figure 90: South Asia Market Y-o-Y Growth (%) Projections by Application, 2023 to 2033

Figure 91: South Asia Market Value (US$ Million) Analysis by Service, 2018 to 2033

Figure 92: South Asia Market Value Share (%) and BPS Analysis by Service, 2023 to 2033

Figure 93: South Asia Market Y-o-Y Growth (%) Projections by Service, 2023 to 2033

Figure 94: South Asia Market Value (US$ Million) Analysis by Location, 2018 to 2033

Figure 95: South Asia Market Value Share (%) and BPS Analysis by Location, 2023 to 2033

Figure 96: South Asia Market Y-o-Y Growth (%) Projections by Location, 2023 to 2033

Figure 97: South Asia Market Attractiveness by Application, 2023 to 2033

Figure 98: South Asia Market Attractiveness by Service, 2023 to 2033

Figure 99: South Asia Market Attractiveness by Location, 2023 to 2033

Figure 100: South Asia Market Attractiveness by Country, 2023 to 2033

Figure 101: East Asia Market Value (US$ Million) by Application, 2023 to 2033

Figure 102: East Asia Market Value (US$ Million) by Service, 2023 to 2033

Figure 103: East Asia Market Value (US$ Million) by Location, 2023 to 2033

Figure 104: East Asia Market Value (US$ Million) by Country, 2023 to 2033

Figure 105: East Asia Market Value (US$ Million) Analysis by Country, 2018 to 2033

Figure 106: East Asia Market Value Share (%) and BPS Analysis by Country, 2023 to 2033

Figure 107: East Asia Market Y-o-Y Growth (%) Projections by Country, 2023 to 2033

Figure 108: East Asia Market Value (US$ Million) Analysis by Application, 2018 to 2033

Figure 109: East Asia Market Value Share (%) and BPS Analysis by Application, 2023 to 2033

Figure 110: East Asia Market Y-o-Y Growth (%) Projections by Application, 2023 to 2033

Figure 111: East Asia Market Value (US$ Million) Analysis by Service, 2018 to 2033

Figure 112: East Asia Market Value Share (%) and BPS Analysis by Service, 2023 to 2033

Figure 113: East Asia Market Y-o-Y Growth (%) Projections by Service, 2023 to 2033

Figure 114: East Asia Market Value (US$ Million) Analysis by Location, 2018 to 2033

Figure 115: East Asia Market Value Share (%) and BPS Analysis by Location, 2023 to 2033

Figure 116: East Asia Market Y-o-Y Growth (%) Projections by Location, 2023 to 2033

Figure 117: East Asia Market Attractiveness by Application, 2023 to 2033

Figure 118: East Asia Market Attractiveness by Service, 2023 to 2033

Figure 119: East Asia Market Attractiveness by Location, 2023 to 2033

Figure 120: East Asia Market Attractiveness by Country, 2023 to 2033

Figure 121: Oceania Market Value (US$ Million) by Application, 2023 to 2033

Figure 122: Oceania Market Value (US$ Million) by Service, 2023 to 2033

Figure 123: Oceania Market Value (US$ Million) by Location, 2023 to 2033

Figure 124: Oceania Market Value (US$ Million) by Country, 2023 to 2033

Figure 125: Oceania Market Value (US$ Million) Analysis by Country, 2018 to 2033

Figure 126: Oceania Market Value Share (%) and BPS Analysis by Country, 2023 to 2033

Figure 127: Oceania Market Y-o-Y Growth (%) Projections by Country, 2023 to 2033

Figure 128: Oceania Market Value (US$ Million) Analysis by Application, 2018 to 2033

Figure 129: Oceania Market Value Share (%) and BPS Analysis by Application, 2023 to 2033

Figure 130: Oceania Market Y-o-Y Growth (%) Projections by Application, 2023 to 2033

Figure 131: Oceania Market Value (US$ Million) Analysis by Service, 2018 to 2033

Figure 132: Oceania Market Value Share (%) and BPS Analysis by Service, 2023 to 2033

Figure 133: Oceania Market Y-o-Y Growth (%) Projections by Service, 2023 to 2033

Figure 134: Oceania Market Value (US$ Million) Analysis by Location, 2018 to 2033

Figure 135: Oceania Market Value Share (%) and BPS Analysis by Location, 2023 to 2033

Figure 136: Oceania Market Y-o-Y Growth (%) Projections by Location, 2023 to 2033

Figure 137: Oceania Market Attractiveness by Application, 2023 to 2033

Figure 138: Oceania Market Attractiveness by Service, 2023 to 2033

Figure 139: Oceania Market Attractiveness by Location, 2023 to 2033

Figure 140: Oceania Market Attractiveness by Country, 2023 to 2033

Figure 141: Middle East and Africa Market Value (US$ Million) by Application, 2023 to 2033

Figure 142: Middle East and Africa Market Value (US$ Million) by Service, 2023 to 2033

Figure 143: Middle East and Africa Market Value (US$ Million) by Location, 2023 to 2033

Figure 144: Middle East and Africa Market Value (US$ Million) by Country, 2023 to 2033

Figure 145: Middle East and Africa Market Value (US$ Million) Analysis by Country, 2018 to 2033

Figure 146: Middle East and Africa Market Value Share (%) and BPS Analysis by Country, 2023 to 2033

Figure 147: Middle East and Africa Market Y-o-Y Growth (%) Projections by Country, 2023 to 2033

Figure 148: Middle East and Africa Market Value (US$ Million) Analysis by Application, 2018 to 2033

Figure 149: Middle East and Africa Market Value Share (%) and BPS Analysis by Application, 2023 to 2033

Figure 150: Middle East and Africa Market Y-o-Y Growth (%) Projections by Application, 2023 to 2033

Figure 151: Middle East and Africa Market Value (US$ Million) Analysis by Service, 2018 to 2033

Figure 152: Middle East and Africa Market Value Share (%) and BPS Analysis by Service, 2023 to 2033

Figure 153: Middle East and Africa Market Y-o-Y Growth (%) Projections by Service, 2023 to 2033

Figure 154: Middle East and Africa Market Value (US$ Million) Analysis by Location, 2018 to 2033

Figure 155: Middle East and Africa Market Value Share (%) and BPS Analysis by Location, 2023 to 2033

Figure 156: Middle East and Africa Market Y-o-Y Growth (%) Projections by Location, 2023 to 2033

Figure 157: Middle East and Africa Market Attractiveness by Application, 2023 to 2033

Figure 158: Middle East and Africa Market Attractiveness by Service, 2023 to 2033

Figure 159: Middle East and Africa Market Attractiveness by Location, 2023 to 2033

Figure 160: Middle East and Africa Market Attractiveness by Country, 2023 to 2033

Recommendations

Technology

Document Outsourcing Service Market

Published : April 2024

Healthcare

Healthcare Regulatory Affairs Outsourcing Market

Published : March 2024

Explore Technology Insights

View Reports

Automotive Engineering Service Outsourcing Market