Cognitive Computing Market Size and Share Forecast Outlook 2025 to 2035

The Cognitive Computing Market is estimated to be valued at USD 28.8 billion in 2025 and is projected to reach USD 270.7 billion by 2035, registering a compound annual growth rate (CAGR) of 25.1% over the forecast period.
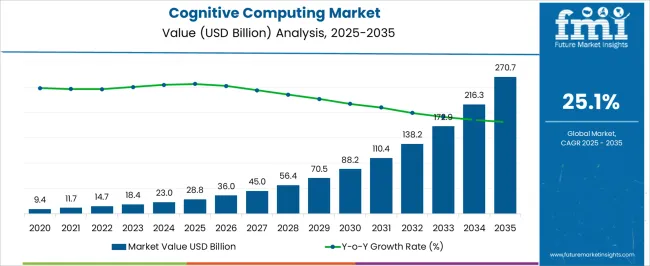
Quick Stats for Cognitive Computing Market

  • Cognitive Computing Market Industry Value (2025): USD 28.8 billion
  • Cognitive Computing Market Forecast Value (2035): USD 270.7 billion
  • Cognitive Computing Market Forecast CAGR: 25.1%
  • Leading Segment in Cognitive Computing Market in 2025: On-Premise Cognitive Computing (54.2%)
  • Key Growth Region in Cognitive Computing Market: North America, Asia-Pacific, Europe
  • Top Key Players in Cognitive Computing Market: 3M, Google LLC, Hewlett Packard Enterprise Development LP, International Business Machines Corporation, Microsoft Corporation, Nuance Communications, Inc., Oracle Corporation, SAP SE, SAS Institute Inc., Tibco Software Inc.

Cognitive Computing Market Market Value Analysis

Metric Value
Cognitive Computing Market Estimated Value in (2025 E) USD 28.8 billion
Cognitive Computing Market Forecast Value in (2035 F) USD 270.7 billion
Forecast CAGR (2025 to 2035) 25.1%

Rationale for Segmental Growth in the Cognitive Computing Market

The cognitive computing market is expanding rapidly due to increasing adoption of artificial intelligence and machine learning technologies across diverse industries. The demand for advanced decision making tools, natural language processing, and predictive analytics is driving large scale implementation in enterprise systems.

Heightened focus on personalized user experiences, real time data processing, and improved operational efficiency is further accelerating adoption. Regulatory frameworks emphasizing data compliance and security have also encouraged enterprises to integrate cognitive platforms with robust security architectures.

Advancements in cloud infrastructure and hybrid deployment models are supporting flexible implementation strategies. The market outlook remains strong as organizations continue to leverage cognitive computing to enhance diagnostics, optimize workflows, and strengthen business intelligence in highly competitive environments.
Segmental Analysis

Insights into the On Premise Cognitive Computing Deployment Segment

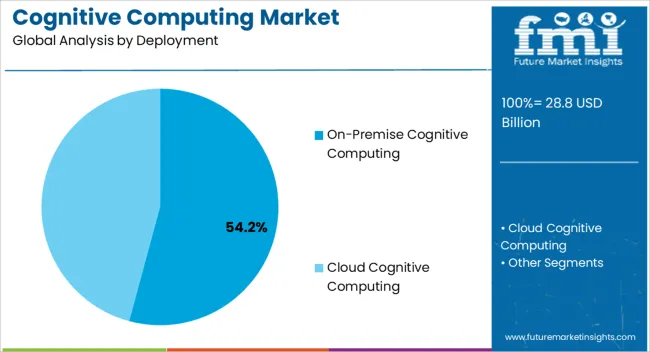
Cognitive Computing Market Analysis By Deployment

The on premise cognitive computing deployment segment is expected to account for 54.20% of the total market by 2025, making it the most dominant deployment category. Its leadership is supported by demand from organizations that prioritize security, compliance, and complete control over data infrastructure.

Enterprises in regulated sectors such as finance, defense, and healthcare prefer on premise solutions to safeguard sensitive data while maintaining seamless integration with existing legacy systems. Higher upfront costs have been justified by long term benefits in performance reliability and customization flexibility.

This preference has strengthened the position of on premise cognitive computing as the leading deployment model.
Insights into the Diagnostic APIs Application Segment

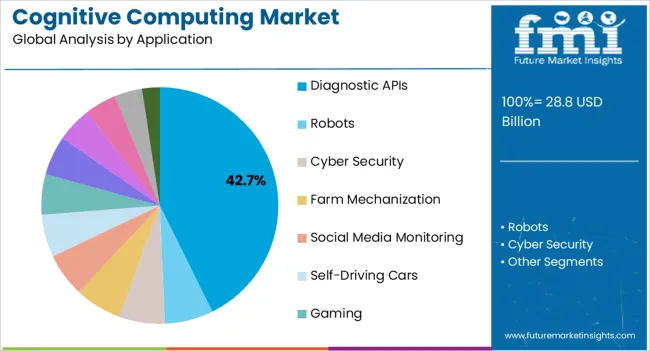
Cognitive Computing Market Analysis By Application

The diagnostic APIs application segment is projected to represent 42.70% of the overall market by 2025, positioning it as the most prominent application. Growth is being driven by the need for advanced diagnostic support tools, integration with electronic health records, and real time clinical decision assistance.

Diagnostic APIs are enabling faster interpretation of complex datasets and are widely adopted in healthcare and life sciences for predictive modeling and patient outcome optimization. The ability to reduce diagnostic errors, support remote patient care, and deliver actionable insights has reinforced their demand.

These benefits continue to strengthen their role as the leading application area in cognitive computing.
Insights into the Healthcare Industry Segment

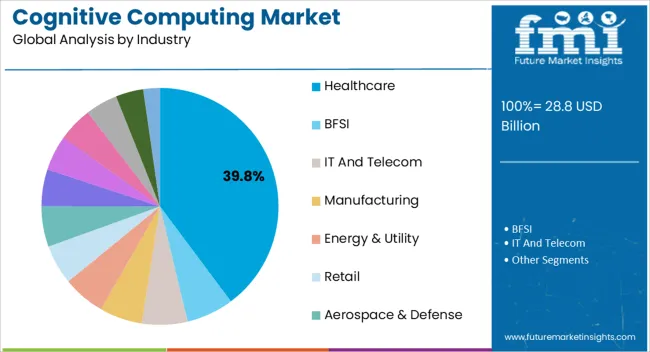
Cognitive Computing Market Analysis By Industry

The healthcare segment is expected to capture 39.80% of total market revenue by 2025 within the industry category, making it the largest contributor. This growth is being propelled by rising investments in AI enabled healthcare solutions, the need for accurate diagnostics, and demand for efficient patient management systems.

Hospitals and clinics are deploying cognitive computing platforms to analyze medical imaging, streamline administrative workflows, and personalize treatment plans. Growing emphasis on telemedicine and remote care has also encouraged adoption.

Furthermore, healthcare providers are leveraging cognitive tools to improve drug discovery, reduce costs, and enhance clinical outcomes. As a result, healthcare continues to dominate as the leading industry for cognitive computing adoption.

What Factors Fueling the Cognitive Computing Market Growth?

There is an increase in the demand for cognitive systems in large organizations and this is expected to increase in SMBs owing to cloud-based services. As cloud-based deployment decreases the cost of deploying cognitive computing in the organization, there is a subsequent rise in the overall demand for cloud-based services.

The rise in big data analytics, developments of machine-to-machine technologies, and an increase in demand for a better customer experience. In addition, industries such as BFSI, social websites, healthcare, and e-commerce have witnessed a rapid increase in transaction information and customer data.

What Factors Limit the Cognitive Computing Market?

To develop cognitive solutions, a high upfront investment is required to set up maintenance architecture and infrastructure which leads to high operational costs.

Issues relating to government standards and uncertain regulatory compliance are also expected to limit the growth of the cognitive computing market. In addition, the market is anticipated to experience several challenges owing to the lack of awareness among SMEs.

What are the Key Trends in Cognitive Computing Market?

One of the significant market key trends is the rising demand for big data analytics across various industries such as IT and telecom, healthcare, aerospace & defense. The rising volume of data and the adoption of big data tools are likely to drive the demand for big data analytics.

NLP technology helps in analyzing unstructured data for improving customer needs, expectations, and better customer experience. Hence, with the help of NLP, organizations get better insights into the optimization of business processes, reduction in operational cost, and customer perception.

Country-wise Insights

Countries Revenue Share % (2025)
United States 27.3%
Germany 7.2%
Japan 5.4%
Australia 2.1%
Countries CAGR % (2025 to 2035)
China 29.3%
India 23.1%
United Kingdom 25.1%

The global cognitive computing market is divided into North America, South America, Europe, Asia Pacific, the Middle East, and Africa based on geography. The North American region is expected to hold a substantial share of the global cognitive computing market. While the Asia Pacific (APAC) region is expected to grow at a significant rate during the forecast period.

North America is a significant revenue contributor in the global market. The region is witnessing significant developments in the market, owing to the increasing usage of the internet and startups adopting cognitive computing solutions.

In addition, organizations, especially in the United States, have started using cognitive computing solutions to analyze huge volumes of data to provide better solutions. New technological advancements, such as 5G and IoT have also aided in the boost of cognitive solutions in this region.

Cognitive computing demand in the United States has held a market share of 27.3% in 2025. Moreover, the United Kingdom and China are expected to thrive at growth forecasts of 25.1% and 29.3% respectively, throughout the forecast period.

The growth is attributed to the expanding manufacturing space in China while India’s forecast for the IT and telecom industry is rich and is projected to gain more traction for the market. China and India both emerging superpowers are anticipated to expand their market space as both build new healthcare, government-based infrastructure.

Category-wise Landscape

Category By Deployment Type
Leading Segment On-Premises
Market Share (2025) 57.6%
Category By Industry Type
Leading Segment IT and telecom
Market Share (2025) 17.5%

The cognitive computing market can be segmented on the basis of deployment, application, industry, end user, and region. Based on the deployment, the market can be segmented into the following: on-premise, and cloud.

By deployment, the on-premise category of the cognitive computing market is expected to dominate the market as it held a market share of 57.6% in 2025. The growth is attributed to its capabilities such as data mining, pattern recognition, and natural language processing, which in turn is expected to accelerate the market growth over the analysis period.

According to FMI, on the basis of application, the market can be segmented into the following: diagnostic APIs, robots, cyber security, farm mechanization, social media monitoring, self-driving cars, gaming, video surveillance, eLearning, IT infrastructure management, supply chain management, and others. By application, the diagnostic APIs category is expected to dominate the market and is predicted to reach a CAGR of 27.9%, during the forecast period.

Based on Industry, the market can be segmented into the following: healthcare, BFSI, IT and telecom, manufacturing, energy & utility, retail, aerospace & defense, government, transportation, agriculture, media & entertainment, education, and. Based on end-user, the market can be segmented into the following: large enterprises, small and medium enterprises (SMEs), and public sector. The IT and telecom segment leads the market space as the IT industries are on the rise in emerging Asian economies. The demand for effective communication, data tracking, and evaluation techniques is likely to flourish in the segment during the forecast period.
Competition Scenario

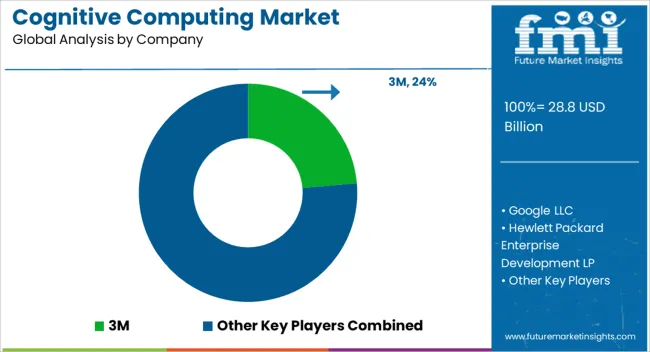
Cognitive Computing Market Analysis By Company

3M, Google LLC, Hewlett Packard Enterprise Development LP, International Business Machines Corporation, Microsoft Corporation, Nuance Communications Inc., Oracle Corporation, SAP SE, SAS Institute Inc., and Tibco Software Inc., among others, are the top companies in the global cognitive computing market.

With a sizable cognitive computing market share, these main firms are concentrating on growing their consumer base in new countries. These businesses are making use of strategic collaboration initiatives to grow their market share and profits.

Mid-size and smaller businesses, on the other hand, are expanding their market presence by gaining new contracts and entering new markets, thanks to technical developments and product innovations.

Market Developments

  • In May 2024, Udacity, a virtual learning tutoring service, announced the launch of a new AI healthcare plan. According to the digital educator, the new AI course teaches students about the use of AI in electronic health records, medical image processing, and other regions.
  • In December 2020, Accenture Inc., based in Ireland, acquired Clarity Insights, deep data analytics, and a machine learning firm based in the United States, to enhance AI.
  • In August 2020, Cisco Systems Inc., a technology company United States-based, acquired Voicea, enabling Cisco Systems to progress to providing AI-driven, cognitive collaborative projects all across the overall portfolio.
  • In September 2020, Schlumberger, Chevron, and Microsoft announced a partnership to accelerate new technologies. This collaboration was carried out in three stages, initiating with the adoption of the Petro technical Suite in the DELFI environment, achieved through the development of cloud-native applications on Azure. And subsequently with the co-innovation of a suite for cognitive computer processing native abilities.
  • Microsoft Corporation's cognitive computing platform has launched conversations on AI, and Azure cognitive services that are designed and developed through the help of leading data scientists.

Key Players

  • 3M
  • Google LLC
  • Hewlett Packard Enterprise Development LP
  • International Business Machines Corporation
  • Microsoft Corporation
  • Nuance Communications, Inc.
  • Oracle Corporation
  • SAP SE
  • SAS Institute Inc.
  • Tibco Software Inc.

Key Segments Covered

By Deployment:

  • On-premise Cognitive Computing
  • Cloud Cognitive Computing

By Application:

  • Diagnostic APIs
  • Robots
  • Cyber Security
  • Farm Mechanization
  • Social Media Monitoring
  • Self-Driving Cars
  • Gaming
  • Video Surveillance
  • e-Learning
  • IT Infrastructure Management
  • Supply Chain Management
  • Other Application

By Industry:

  • Healthcare
  • BFSI
  • IT and Telecom
  • Manufacturing
  • Energy & Utility
  • Retail
  • Aerospace & Defense
  • Government
  • Transportation
  • Agriculture
  • Media & Entertainment
  • Education
  • Other Industries (HR, Marketing & PR, etc.)

By End User:

  • Large Enterprises
  • Small and Medium Enterprises (SMEs)
  • Public Sector

By Regions:

  • North America
    • United States
    • Canada
  • Latin America
    • Brazil
    • Mexico
    • Rest of Latin America
  • Europe
    • Germany
    • United Kingdom
    • France
    • Spain
    • Russia
    • Rest of Europe
  • Japan
  • Asia Pacific Excluding Japan
    • China
    • India
    • Malaysia
    • Singapore
    • Australia
    • Rest of Asia Pacific Excluding Japan (APEJ)
  • The Middle East and Africa
    • GCC Countries
    • Israel
    • South Africa
    • Middle East and Africa (MEA)

Table of Content

  1. Executive Summary
    • Global Market Outlook
    • Demand-side Trends
    • Supply-side Trends
    • Technology Roadmap Analysis
    • Analysis and Recommendations
  2. Market Overview
    • Market Coverage / Taxonomy
    • Market Definition / Scope / Limitations
  3. Market Background
    • Market Dynamics
      • Drivers
      • Restraints
      • Opportunity
      • Trends
    • Scenario Forecast
      • Demand in Optimistic Scenario
      • Demand in Likely Scenario
      • Demand in Conservative Scenario
    • Opportunity Map Analysis
    • Product Life Cycle Analysis
    • Supply Chain Analysis
    • Investment Feasibility Matrix
    • Value Chain Analysis
    • PESTLE and Porter’s Analysis
    • Regulatory Landscape
    • Regional Parent Market Outlook
    • Production and Consumption Statistics
    • Import and Export Statistics
  4. Global Market Analysis 2020 to 2024 and Forecast, 2025 to 2035
    • Historical Market Size Value (USD Million) Analysis, 2020 to 2024
    • Current and Future Market Size Value (USD Million) Projections, 2025 to 2035
      • Y-o-Y Growth Trend Analysis
      • Absolute $ Opportunity Analysis
  5. Global Market Pricing Analysis 2020 to 2024 and Forecast 2025 to 2035
  6. Global Market Analysis 2020 to 2024 and Forecast 2025 to 2035, By Deployment
    • Introduction / Key Findings
    • Historical Market Size Value (USD Million) Analysis By Deployment , 2020 to 2024
    • Current and Future Market Size Value (USD Million) Analysis and Forecast By Deployment , 2025 to 2035
      • On-Premise Cognitive Computing
      • Cloud Cognitive Computing
    • Y-o-Y Growth Trend Analysis By Deployment , 2020 to 2024
    • Absolute $ Opportunity Analysis By Deployment , 2025 to 2035
  7. Global Market Analysis 2020 to 2024 and Forecast 2025 to 2035, By Application
    • Introduction / Key Findings
    • Historical Market Size Value (USD Million) Analysis By Application, 2020 to 2024
    • Current and Future Market Size Value (USD Million) Analysis and Forecast By Application, 2025 to 2035
      • Diagnostic APIs
      • Robots
      • Cyber Security
      • Farm Mechanization
      • Social Media Monitoring
      • Self-Driving Cars
      • Gaming
      • Video Surveillance
      • E-Learning
      • IT Infrastructure Management
      • Supply Chain Management
    • Y-o-Y Growth Trend Analysis By Application, 2020 to 2024
    • Absolute $ Opportunity Analysis By Application, 2025 to 2035
  8. Global Market Analysis 2020 to 2024 and Forecast 2025 to 2035, By Industry
    • Introduction / Key Findings
    • Historical Market Size Value (USD Million) Analysis By Industry, 2020 to 2024
    • Current and Future Market Size Value (USD Million) Analysis and Forecast By Industry, 2025 to 2035
      • Healthcare
      • BFSI
      • IT And Telecom
      • Manufacturing
      • Energy & Utility
      • Retail
      • Aerospace & Defense
      • Government
      • Transportation
      • Agriculture
      • Media & Entertainment
    • Y-o-Y Growth Trend Analysis By Industry, 2020 to 2024
    • Absolute $ Opportunity Analysis By Industry, 2025 to 2035
  9. Global Market Analysis 2020 to 2024 and Forecast 2025 to 2035, By End User
    • Introduction / Key Findings
    • Historical Market Size Value (USD Million) Analysis By End User, 2020 to 2024
    • Current and Future Market Size Value (USD Million) Analysis and Forecast By End User, 2025 to 2035
      • Large Enterprises
      • Small And Medium Enterprises (SMEs)
      • Public Sector
    • Y-o-Y Growth Trend Analysis By End User, 2020 to 2024
    • Absolute $ Opportunity Analysis By End User, 2025 to 2035
  10. Global Market Analysis 2020 to 2024 and Forecast 2025 to 2035, By Region
    • Introduction
    • Historical Market Size Value (USD Million) Analysis By Region, 2020 to 2024
    • Current Market Size Value (USD Million) Analysis and Forecast By Region, 2025 to 2035
      • North America
      • Latin America
      • Western Europe
      • Eastern Europe
      • East Asia
      • South Asia and Pacific
      • Middle East & Africa
    • Market Attractiveness Analysis By Region
  11. North America Market Analysis 2020 to 2024 and Forecast 2025 to 2035, By Country
    • Historical Market Size Value (USD Million) Trend Analysis By Market Taxonomy, 2020 to 2024
    • Market Size Value (USD Million) Forecast By Market Taxonomy, 2025 to 2035
      • By Country
        • USA
        • Canada
        • Mexico
      • By Deployment
      • By Application
      • By Industry
      • By End User
    • Market Attractiveness Analysis
      • By Country
      • By Deployment
      • By Application
      • By Industry
      • By End User
    • Key Takeaways
  12. Latin America Market Analysis 2020 to 2024 and Forecast 2025 to 2035, By Country
    • Historical Market Size Value (USD Million) Trend Analysis By Market Taxonomy, 2020 to 2024
    • Market Size Value (USD Million) Forecast By Market Taxonomy, 2025 to 2035
      • By Country
        • Brazil
        • Chile
        • Rest of Latin America
      • By Deployment
      • By Application
      • By Industry
      • By End User
    • Market Attractiveness Analysis
      • By Country
      • By Deployment
      • By Application
      • By Industry
      • By End User
    • Key Takeaways
  13. Western Europe Market Analysis 2020 to 2024 and Forecast 2025 to 2035, By Country
    • Historical Market Size Value (USD Million) Trend Analysis By Market Taxonomy, 2020 to 2024
    • Market Size Value (USD Million) Forecast By Market Taxonomy, 2025 to 2035
      • By Country
        • Germany
        • UK
        • Italy
        • Spain
        • France
        • Nordic
        • BENELUX
        • Rest of Western Europe
      • By Deployment
      • By Application
      • By Industry
      • By End User
    • Market Attractiveness Analysis
      • By Country
      • By Deployment
      • By Application
      • By Industry
      • By End User
    • Key Takeaways
  14. Eastern Europe Market Analysis 2020 to 2024 and Forecast 2025 to 2035, By Country
    • Historical Market Size Value (USD Million) Trend Analysis By Market Taxonomy, 2020 to 2024
    • Market Size Value (USD Million) Forecast By Market Taxonomy, 2025 to 2035
      • By Country
        • Russia
        • Poland
        • Hungary
        • Balkan & Baltic
        • Rest of Eastern Europe
      • By Deployment
      • By Application
      • By Industry
      • By End User
    • Market Attractiveness Analysis
      • By Country
      • By Deployment
      • By Application
      • By Industry
      • By End User
    • Key Takeaways
  15. East Asia Market Analysis 2020 to 2024 and Forecast 2025 to 2035, By Country
    • Historical Market Size Value (USD Million) Trend Analysis By Market Taxonomy, 2020 to 2024
    • Market Size Value (USD Million) Forecast By Market Taxonomy, 2025 to 2035
      • By Country
        • China
        • Japan
        • South Korea
      • By Deployment
      • By Application
      • By Industry
      • By End User
    • Market Attractiveness Analysis
      • By Country
      • By Deployment
      • By Application
      • By Industry
      • By End User
    • Key Takeaways
  16. South Asia and Pacific Market Analysis 2020 to 2024 and Forecast 2025 to 2035, By Country
    • Historical Market Size Value (USD Million) Trend Analysis By Market Taxonomy, 2020 to 2024
    • Market Size Value (USD Million) Forecast By Market Taxonomy, 2025 to 2035
      • By Country
        • India
        • ASEAN
        • Australia & New Zealand
        • Rest of South Asia and Pacific
      • By Deployment
      • By Application
      • By Industry
      • By End User
    • Market Attractiveness Analysis
      • By Country
      • By Deployment
      • By Application
      • By Industry
      • By End User
    • Key Takeaways
  17. Middle East & Africa Market Analysis 2020 to 2024 and Forecast 2025 to 2035, By Country
    • Historical Market Size Value (USD Million) Trend Analysis By Market Taxonomy, 2020 to 2024
    • Market Size Value (USD Million) Forecast By Market Taxonomy, 2025 to 2035
      • By Country
        • Kingdom of Saudi Arabia
        • Other GCC Countries
        • Turkiye
        • South Africa
        • Other African Union
        • Rest of Middle East & Africa
      • By Deployment
      • By Application
      • By Industry
      • By End User
    • Market Attractiveness Analysis
      • By Country
      • By Deployment
      • By Application
      • By Industry
      • By End User
    • Key Takeaways
  18. Key Countries Market Analysis
    • USA
      • Pricing Analysis
      • Market Share Analysis, 2024
        • By Deployment
        • By Application
        • By Industry
        • By End User
    • Canada
      • Pricing Analysis
      • Market Share Analysis, 2024
        • By Deployment
        • By Application
        • By Industry
        • By End User
    • Mexico
      • Pricing Analysis
      • Market Share Analysis, 2024
        • By Deployment
        • By Application
        • By Industry
        • By End User
    • Brazil
      • Pricing Analysis
      • Market Share Analysis, 2024
        • By Deployment
        • By Application
        • By Industry
        • By End User
    • Chile
      • Pricing Analysis
      • Market Share Analysis, 2024
        • By Deployment
        • By Application
        • By Industry
        • By End User
    • Germany
      • Pricing Analysis
      • Market Share Analysis, 2024
        • By Deployment
        • By Application
        • By Industry
        • By End User
    • UK
      • Pricing Analysis
      • Market Share Analysis, 2024
        • By Deployment
        • By Application
        • By Industry
        • By End User
    • Italy
      • Pricing Analysis
      • Market Share Analysis, 2024
        • By Deployment
        • By Application
        • By Industry
        • By End User
    • Spain
      • Pricing Analysis
      • Market Share Analysis, 2024
        • By Deployment
        • By Application
        • By Industry
        • By End User
    • France
      • Pricing Analysis
      • Market Share Analysis, 2024
        • By Deployment
        • By Application
        • By Industry
        • By End User
    • India
      • Pricing Analysis
      • Market Share Analysis, 2024
        • By Deployment
        • By Application
        • By Industry
        • By End User
    • ASEAN
      • Pricing Analysis
      • Market Share Analysis, 2024
        • By Deployment
        • By Application
        • By Industry
        • By End User
    • Australia & New Zealand
      • Pricing Analysis
      • Market Share Analysis, 2024
        • By Deployment
        • By Application
        • By Industry
        • By End User
    • China
      • Pricing Analysis
      • Market Share Analysis, 2024
        • By Deployment
        • By Application
        • By Industry
        • By End User
    • Japan
      • Pricing Analysis
      • Market Share Analysis, 2024
        • By Deployment
        • By Application
        • By Industry
        • By End User
    • South Korea
      • Pricing Analysis
      • Market Share Analysis, 2024
        • By Deployment
        • By Application
        • By Industry
        • By End User
    • Russia
      • Pricing Analysis
      • Market Share Analysis, 2024
        • By Deployment
        • By Application
        • By Industry
        • By End User
    • Poland
      • Pricing Analysis
      • Market Share Analysis, 2024
        • By Deployment
        • By Application
        • By Industry
        • By End User
    • Hungary
      • Pricing Analysis
      • Market Share Analysis, 2024
        • By Deployment
        • By Application
        • By Industry
        • By End User
    • Kingdom of Saudi Arabia
      • Pricing Analysis
      • Market Share Analysis, 2024
        • By Deployment
        • By Application
        • By Industry
        • By End User
    • Turkiye
      • Pricing Analysis
      • Market Share Analysis, 2024
        • By Deployment
        • By Application
        • By Industry
        • By End User
    • South Africa
      • Pricing Analysis
      • Market Share Analysis, 2024
        • By Deployment
        • By Application
        • By Industry
        • By End User
  19. Market Structure Analysis
    • Competition Dashboard
    • Competition Benchmarking
    • Market Share Analysis of Top Players
      • By Regional
      • By Deployment
      • By Application
      • By Industry
      • By End User
  20. Competition Analysis
    • Competition Deep Dive
      • 3M
        • Overview
        • Product Portfolio
        • Profitability by Market Segments (Product/Age /Sales Channel/Region)
        • Sales Footprint
        • Strategy Overview
          • Marketing Strategy
          • Product Strategy
          • Channel Strategy
      • Google LLC
      • Hewlett Packard Enterprise Development LP
      • International Business Machines Corporation
      • Microsoft Corporation
      • Nuance Communications, Inc.
      • Oracle Corporation
      • SAP SE
      • SAS Institute Inc.
      • Tibco Software Inc.
  21. Assumptions & Acronyms Used
  22. Research Methodology

List of Tables

  • Table 1: Global Market Value (USD Million) Forecast by Region, 2020-2035
  • Table 2: Global Market Value (USD Million) Forecast by Deployment , 2020-2035
  • Table 3: Global Market Value (USD Million) Forecast by Application, 2020-2035
  • Table 4: Global Market Value (USD Million) Forecast by Industry, 2020-2035
  • Table 5: Global Market Value (USD Million) Forecast by End User, 2020-2035
  • Table 6: North America Market Value (USD Million) Forecast by Country, 2020-2035
  • Table 7: North America Market Value (USD Million) Forecast by Deployment , 2020-2035
  • Table 8: North America Market Value (USD Million) Forecast by Application, 2020-2035
  • Table 9: North America Market Value (USD Million) Forecast by Industry, 2020-2035
  • Table 10: North America Market Value (USD Million) Forecast by End User, 2020-2035
  • Table 11: Latin America Market Value (USD Million) Forecast by Country, 2020-2035
  • Table 12: Latin America Market Value (USD Million) Forecast by Deployment , 2020-2035
  • Table 13: Latin America Market Value (USD Million) Forecast by Application, 2020-2035
  • Table 14: Latin America Market Value (USD Million) Forecast by Industry, 2020-2035
  • Table 15: Latin America Market Value (USD Million) Forecast by End User, 2020-2035
  • Table 16: Western Europe Market Value (USD Million) Forecast by Country, 2020-2035
  • Table 17: Western Europe Market Value (USD Million) Forecast by Deployment , 2020-2035
  • Table 18: Western Europe Market Value (USD Million) Forecast by Application, 2020-2035
  • Table 19: Western Europe Market Value (USD Million) Forecast by Industry, 2020-2035
  • Table 20: Western Europe Market Value (USD Million) Forecast by End User, 2020-2035
  • Table 21: Eastern Europe Market Value (USD Million) Forecast by Country, 2020-2035
  • Table 22: Eastern Europe Market Value (USD Million) Forecast by Deployment , 2020-2035
  • Table 23: Eastern Europe Market Value (USD Million) Forecast by Application, 2020-2035
  • Table 24: Eastern Europe Market Value (USD Million) Forecast by Industry, 2020-2035
  • Table 25: Eastern Europe Market Value (USD Million) Forecast by End User, 2020-2035
  • Table 26: East Asia Market Value (USD Million) Forecast by Country, 2020-2035
  • Table 27: East Asia Market Value (USD Million) Forecast by Deployment , 2020-2035
  • Table 28: East Asia Market Value (USD Million) Forecast by Application, 2020-2035
  • Table 29: East Asia Market Value (USD Million) Forecast by Industry, 2020-2035
  • Table 30: East Asia Market Value (USD Million) Forecast by End User, 2020-2035
  • Table 31: South Asia and Pacific Market Value (USD Million) Forecast by Country, 2020-2035
  • Table 32: South Asia and Pacific Market Value (USD Million) Forecast by Deployment , 2020-2035
  • Table 33: South Asia and Pacific Market Value (USD Million) Forecast by Application, 2020-2035
  • Table 34: South Asia and Pacific Market Value (USD Million) Forecast by Industry, 2020-2035
  • Table 35: South Asia and Pacific Market Value (USD Million) Forecast by End User, 2020-2035
  • Table 36: Middle East & Africa Market Value (USD Million) Forecast by Country, 2020-2035
  • Table 37: Middle East & Africa Market Value (USD Million) Forecast by Deployment , 2020-2035
  • Table 38: Middle East & Africa Market Value (USD Million) Forecast by Application, 2020-2035
  • Table 39: Middle East & Africa Market Value (USD Million) Forecast by Industry, 2020-2035
  • Table 40: Middle East & Africa Market Value (USD Million) Forecast by End User, 2020-2035

List of Figures

  • Figure 1: Global Market Pricing Analysis
  • Figure 2: Global Market Value (USD Million) Forecast 2020-2035
  • Figure 3: Global Market Value Share and BPS Analysis by Deployment , 2025 and 2035
  • Figure 4: Global Market Y-o-Y Growth Comparison by Deployment , 2025-2035
  • Figure 5: Global Market Attractiveness Analysis by Deployment
  • Figure 6: Global Market Value Share and BPS Analysis by Application, 2025 and 2035
  • Figure 7: Global Market Y-o-Y Growth Comparison by Application, 2025-2035
  • Figure 8: Global Market Attractiveness Analysis by Application
  • Figure 9: Global Market Value Share and BPS Analysis by Industry, 2025 and 2035
  • Figure 10: Global Market Y-o-Y Growth Comparison by Industry, 2025-2035
  • Figure 11: Global Market Attractiveness Analysis by Industry
  • Figure 12: Global Market Value Share and BPS Analysis by End User, 2025 and 2035
  • Figure 13: Global Market Y-o-Y Growth Comparison by End User, 2025-2035
  • Figure 14: Global Market Attractiveness Analysis by End User
  • Figure 15: Global Market Value (USD Million) Share and BPS Analysis by Region, 2025 and 2035
  • Figure 16: Global Market Y-o-Y Growth Comparison by Region, 2025-2035
  • Figure 17: Global Market Attractiveness Analysis by Region
  • Figure 18: North America Market Incremental Dollar Opportunity, 2025-2035
  • Figure 19: Latin America Market Incremental Dollar Opportunity, 2025-2035
  • Figure 20: Western Europe Market Incremental Dollar Opportunity, 2025-2035
  • Figure 21: Eastern Europe Market Incremental Dollar Opportunity, 2025-2035
  • Figure 22: East Asia Market Incremental Dollar Opportunity, 2025-2035
  • Figure 23: South Asia and Pacific Market Incremental Dollar Opportunity, 2025-2035
  • Figure 24: Middle East & Africa Market Incremental Dollar Opportunity, 2025-2035
  • Figure 25: North America Market Value Share and BPS Analysis by Country, 2025 and 2035
  • Figure 26: North America Market Value Share and BPS Analysis by Deployment , 2025 and 2035
  • Figure 27: North America Market Y-o-Y Growth Comparison by Deployment , 2025-2035
  • Figure 28: North America Market Attractiveness Analysis by Deployment
  • Figure 29: North America Market Value Share and BPS Analysis by Application, 2025 and 2035
  • Figure 30: North America Market Y-o-Y Growth Comparison by Application, 2025-2035
  • Figure 31: North America Market Attractiveness Analysis by Application
  • Figure 32: North America Market Value Share and BPS Analysis by Industry, 2025 and 2035
  • Figure 33: North America Market Y-o-Y Growth Comparison by Industry, 2025-2035
  • Figure 34: North America Market Attractiveness Analysis by Industry
  • Figure 35: North America Market Value Share and BPS Analysis by End User, 2025 and 2035
  • Figure 36: North America Market Y-o-Y Growth Comparison by End User, 2025-2035
  • Figure 37: North America Market Attractiveness Analysis by End User
  • Figure 38: Latin America Market Value Share and BPS Analysis by Country, 2025 and 2035
  • Figure 39: Latin America Market Value Share and BPS Analysis by Deployment , 2025 and 2035
  • Figure 40: Latin America Market Y-o-Y Growth Comparison by Deployment , 2025-2035
  • Figure 41: Latin America Market Attractiveness Analysis by Deployment
  • Figure 42: Latin America Market Value Share and BPS Analysis by Application, 2025 and 2035
  • Figure 43: Latin America Market Y-o-Y Growth Comparison by Application, 2025-2035
  • Figure 44: Latin America Market Attractiveness Analysis by Application
  • Figure 45: Latin America Market Value Share and BPS Analysis by Industry, 2025 and 2035
  • Figure 46: Latin America Market Y-o-Y Growth Comparison by Industry, 2025-2035
  • Figure 47: Latin America Market Attractiveness Analysis by Industry
  • Figure 48: Latin America Market Value Share and BPS Analysis by End User, 2025 and 2035
  • Figure 49: Latin America Market Y-o-Y Growth Comparison by End User, 2025-2035
  • Figure 50: Latin America Market Attractiveness Analysis by End User
  • Figure 51: Western Europe Market Value Share and BPS Analysis by Country, 2025 and 2035
  • Figure 52: Western Europe Market Value Share and BPS Analysis by Deployment , 2025 and 2035
  • Figure 53: Western Europe Market Y-o-Y Growth Comparison by Deployment , 2025-2035
  • Figure 54: Western Europe Market Attractiveness Analysis by Deployment
  • Figure 55: Western Europe Market Value Share and BPS Analysis by Application, 2025 and 2035
  • Figure 56: Western Europe Market Y-o-Y Growth Comparison by Application, 2025-2035
  • Figure 57: Western Europe Market Attractiveness Analysis by Application
  • Figure 58: Western Europe Market Value Share and BPS Analysis by Industry, 2025 and 2035
  • Figure 59: Western Europe Market Y-o-Y Growth Comparison by Industry, 2025-2035
  • Figure 60: Western Europe Market Attractiveness Analysis by Industry
  • Figure 61: Western Europe Market Value Share and BPS Analysis by End User, 2025 and 2035
  • Figure 62: Western Europe Market Y-o-Y Growth Comparison by End User, 2025-2035
  • Figure 63: Western Europe Market Attractiveness Analysis by End User
  • Figure 64: Eastern Europe Market Value Share and BPS Analysis by Country, 2025 and 2035
  • Figure 65: Eastern Europe Market Value Share and BPS Analysis by Deployment , 2025 and 2035
  • Figure 66: Eastern Europe Market Y-o-Y Growth Comparison by Deployment , 2025-2035
  • Figure 67: Eastern Europe Market Attractiveness Analysis by Deployment
  • Figure 68: Eastern Europe Market Value Share and BPS Analysis by Application, 2025 and 2035
  • Figure 69: Eastern Europe Market Y-o-Y Growth Comparison by Application, 2025-2035
  • Figure 70: Eastern Europe Market Attractiveness Analysis by Application
  • Figure 71: Eastern Europe Market Value Share and BPS Analysis by Industry, 2025 and 2035
  • Figure 72: Eastern Europe Market Y-o-Y Growth Comparison by Industry, 2025-2035
  • Figure 73: Eastern Europe Market Attractiveness Analysis by Industry
  • Figure 74: Eastern Europe Market Value Share and BPS Analysis by End User, 2025 and 2035
  • Figure 75: Eastern Europe Market Y-o-Y Growth Comparison by End User, 2025-2035
  • Figure 76: Eastern Europe Market Attractiveness Analysis by End User
  • Figure 77: East Asia Market Value Share and BPS Analysis by Country, 2025 and 2035
  • Figure 78: East Asia Market Value Share and BPS Analysis by Deployment , 2025 and 2035
  • Figure 79: East Asia Market Y-o-Y Growth Comparison by Deployment , 2025-2035
  • Figure 80: East Asia Market Attractiveness Analysis by Deployment
  • Figure 81: East Asia Market Value Share and BPS Analysis by Application, 2025 and 2035
  • Figure 82: East Asia Market Y-o-Y Growth Comparison by Application, 2025-2035
  • Figure 83: East Asia Market Attractiveness Analysis by Application
  • Figure 84: East Asia Market Value Share and BPS Analysis by Industry, 2025 and 2035
  • Figure 85: East Asia Market Y-o-Y Growth Comparison by Industry, 2025-2035
  • Figure 86: East Asia Market Attractiveness Analysis by Industry
  • Figure 87: East Asia Market Value Share and BPS Analysis by End User, 2025 and 2035
  • Figure 88: East Asia Market Y-o-Y Growth Comparison by End User, 2025-2035
  • Figure 89: East Asia Market Attractiveness Analysis by End User
  • Figure 90: South Asia and Pacific Market Value Share and BPS Analysis by Country, 2025 and 2035
  • Figure 91: South Asia and Pacific Market Value Share and BPS Analysis by Deployment , 2025 and 2035
  • Figure 92: South Asia and Pacific Market Y-o-Y Growth Comparison by Deployment , 2025-2035
  • Figure 93: South Asia and Pacific Market Attractiveness Analysis by Deployment
  • Figure 94: South Asia and Pacific Market Value Share and BPS Analysis by Application, 2025 and 2035
  • Figure 95: South Asia and Pacific Market Y-o-Y Growth Comparison by Application, 2025-2035
  • Figure 96: South Asia and Pacific Market Attractiveness Analysis by Application
  • Figure 97: South Asia and Pacific Market Value Share and BPS Analysis by Industry, 2025 and 2035
  • Figure 98: South Asia and Pacific Market Y-o-Y Growth Comparison by Industry, 2025-2035
  • Figure 99: South Asia and Pacific Market Attractiveness Analysis by Industry
  • Figure 100: South Asia and Pacific Market Value Share and BPS Analysis by End User, 2025 and 2035
  • Figure 101: South Asia and Pacific Market Y-o-Y Growth Comparison by End User, 2025-2035
  • Figure 102: South Asia and Pacific Market Attractiveness Analysis by End User
  • Figure 103: Middle East & Africa Market Value Share and BPS Analysis by Country, 2025 and 2035
  • Figure 104: Middle East & Africa Market Value Share and BPS Analysis by Deployment , 2025 and 2035
  • Figure 105: Middle East & Africa Market Y-o-Y Growth Comparison by Deployment , 2025-2035
  • Figure 106: Middle East & Africa Market Attractiveness Analysis by Deployment
  • Figure 107: Middle East & Africa Market Value Share and BPS Analysis by Application, 2025 and 2035
  • Figure 108: Middle East & Africa Market Y-o-Y Growth Comparison by Application, 2025-2035
  • Figure 109: Middle East & Africa Market Attractiveness Analysis by Application
  • Figure 110: Middle East & Africa Market Value Share and BPS Analysis by Industry, 2025 and 2035
  • Figure 111: Middle East & Africa Market Y-o-Y Growth Comparison by Industry, 2025-2035
  • Figure 112: Middle East & Africa Market Attractiveness Analysis by Industry
  • Figure 113: Middle East & Africa Market Value Share and BPS Analysis by End User, 2025 and 2035
  • Figure 114: Middle East & Africa Market Y-o-Y Growth Comparison by End User, 2025-2035
  • Figure 115: Middle East & Africa Market Attractiveness Analysis by End User
  • Figure 116: Global Market - Tier Structure Analysis
  • Figure 117: Global Market - Company Share Analysis

Frequently Asked Questions

How big is the cognitive computing market in 2025?

The global cognitive computing market is estimated to be valued at USD 28.8 billion in 2025.

What will be the size of cognitive computing market in 2035?

The market size for the cognitive computing market is projected to reach USD 270.7 billion by 2035.

How much will be the cognitive computing market growth between 2025 and 2035?

The cognitive computing market is expected to grow at a 25.1% CAGR between 2025 and 2035.

What are the key product types in the cognitive computing market?

The key product types in cognitive computing market are on-premise cognitive computing and cloud cognitive computing.

Which application segment to contribute significant share in the cognitive computing market in 2025?

In terms of application, diagnostic apis segment to command 42.7% share in the cognitive computing market in 2025.

Explore Similar Insights

Future Market Insights

Cognitive Computing Market

Chat With MaRIA

Chat With

MaRIA

Hi There, I am MaRIA, Your Market Research Intelligence Assistant. How may I help you?