Reports

- Global Locations -

Headquarters

Future Market Insights, Inc.

Christiana Corporate, 200
Continental Drive, Suite 401,
Newark, Delaware - 19713,
United States

T: +1-845-579-5705

Americas

Future Market Insights, Inc.

616 Corporate Way, Suite 2-9018,
Valley Cottage, NY 10989, United States

T: +1-347-918-3531

MEA

Future Market Insights

1602-6 Jumeirah Bay X2 Tower, Plot No: JLT-PH2-X2A,
Jumeirah Lakes Towers, Dubai,
United Arab Emirates

Europe

Future Market Insights

3rd Floor, 207 Regent Street,
W1B 3HH London
United Kingdom

T: + 44 (0) 20 8123 9659
D: +44 (0) 20 3287 4268

Asia Pacific

Future Market Insights

IndiaLand Global Tech Park, Unit UG-1, Behind Grand HighStreet, Phase 1, Hinjawadi, MH, Pune – 411057, India

Cognitive Impairment Biomarkers Market Outlook (2023 to 2033)

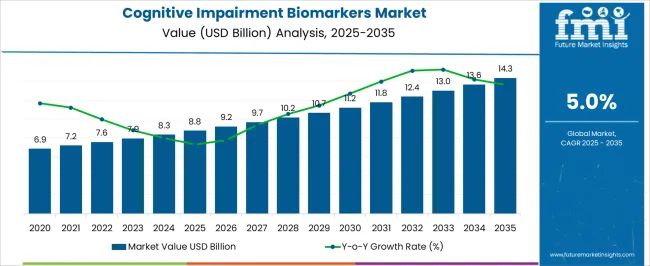
The cognitive impairment biomarkers market size is projected to be worth US$ 7.9 billion in 2023. The market is likely to surpass US$ 13.3 billion by 2033 at a CAGR of 5.3% during the forecast period. The global cognitive impairment biomarkers market has been growing steadily in recent years and is projected to continue its upward trajectory. The market size can vary based on biomarkers which are being investigated for cognitive impairment, including genetic markers, imaging markers, biochemical markers, and fluid-based markers. Genetic markers, such as apolipoprotein E (APOE) genotype, are associated with an increased risk of developing Alzheimer's disease.

Cognitive impairment biomarkers have diagnostic and prognostic applications in clinical practice and research settings. They help in the early and accurate diagnosis of cognitive disorders, enabling timely interventions and treatment strategies. Biomarkers also play a role in monitoring disease progression, assessing treatment response, and predicting the risk of conversion from mild cognitive impairment to dementia.

Other Drivers Propelling the Demand for Cognitive Impairment Biomarkers Market include:

  • The global prevalence of cognitive impairment and neurodegenerative diseases is on the rise, primarily due to aging populations and lifestyle factors. As the number of individuals affected by these conditions increases, there is a growing need for effective diagnostic tools and biomarkers to aid in early detection and intervention.
  • he development of advanced medical imaging technologies, such as positron emission tomography (PET) and magnetic resonance imaging (MRI), has enabled the identification and characterization of specific biomarkers associated with cognitive impairment. These technologies allow for non-invasive visualization of brain structures and abnormalities, aiding in the diagnosis and monitoring of cognitive disorders.
  • Early diagnosis of cognitive impairment is crucial for effective disease management and intervention. Biomarkers play a vital role in identifying individuals at risk or in the early stages of cognitive decline. Early detection drives timely interventions, such as lifestyle modifications, drug therapies, and cognitive rehabilitation, which can potentially slow down disease progression and improve patient outcomes.
  • There has been a significant increase in research and development activities focused on identifying and validating biomarkers for cognitive impairment. Academic institutions, pharmaceutical companies, and research organizations are investing resources into biomarker discovery, validation studies, and clinical trials. These efforts are driving the expansion of the cognitive impairment biomarkers market.

Challenges for Companies /Manufacturers in the Cognitive impairment biomarkers Market:

  • Cognitive impairment is a multifaceted condition with various underlying causes and mechanisms. Identifying reliable and specific biomarkers that accurately reflect the complex nature of cognitive impairment poses a significant challenge. The heterogeneity of cognitive disorders and the overlapping symptoms make it difficult to establish universally applicable biomarkers.
  • Developing and commercializing biomarker-based diagnostics and therapies involves substantial financial investments and long regulatory processes. Biomarker discovery, validation studies, and clinical trials require significant resources and time. Additionally, obtaining regulatory approvals for biomarker-based products often involves complex and lengthy processes, which can impede market entry and limit the availability of innovative biomarker technologies.

Opportunities in the Cognitive impairment biomarkers Market Industry:

  • Biomarkers are valuable tools in the development of new therapeutic interventions for cognitive impairment. They can be used to identify target populations for clinical trials, assess treatment response, and monitor drug efficacy. Biomarker-based strategies in drug development can help accelerate the discovery and development of novel treatments for cognitive impairment.
  • Longitudinal monitoring of biomarkers allows for the assessment of disease progression and treatment response over time. Biomarkers can provide objective measures of disease severity and progression, enabling clinicians to monitor the effectiveness of interventions and adjust treatment plans accordingly. This monitoring capability facilitates precision medicine and helps optimize patient care.
  • Combining multiple biomarkers from different modalities (e.g., imaging, genetic, proteomic) can provide a more comprehensive and accurate assessment of cognitive impairment. The integration of diverse biomarker data can enhance diagnostic accuracy, improve risk prediction, and enable a more nuanced understanding of disease mechanisms. This multi-modal approach opens up opportunities for the development of comprehensive biomarker panels and algorithms.

Latest Trends in the Cognitive impairment biomarkers Market:

  • The focus is shifting towards the development and validation of fluid biomarkers, such as cerebrospinal fluid (CSF) markers and blood-based biomarkers. These biomarkers offer non-invasive or minimally invasive methods for assessing cognitive impairment, potentially enabling easier and more widespread screening and monitoring.
  • There is a growing trend towards multiplex biomarker analysis, which involves the simultaneous measurement of multiple biomarkers associated with cognitive impairment. This approach provides a more comprehensive assessment of disease status and progression, allowing for a more accurate diagnosis and personalized treatment strategies.
  • Advances in genomics have led to the identification of genetic variants associated with cognitive impairment. Genomic biomarkers, such as genetic risk scores or specific genetic markers, are being explored for their potential to predict disease risk, aid in early detection, and inform personalized treatment strategies.
Attributes Details
Cognitive Impairment Biomarkers Market Size (2023) US$ 7.9 Billion
Cognitive Impairment Biomarkers Market Projected Size (2033) US$ 13.3 Billion
Value CAGR (2023 to 2033) 5.3%

Don't pay for what you don't need

Customize your report by selecting specific countries or regions and save 30%!

2017 to 2022 Cognitive Impairment Biomarkers Market Demand Outlook Compared to 2023 to 2033 Forecast

From 2017 to 2022, the global cognitive impairment biomarkers market experienced a CAGR of 4.2%, reaching a market size of US$ 7.9 billion in 2023.

From 2017 to 2022, The global prevalence of cognitive impairment and neurodegenerative diseases has been on the rise due to aging populations and lifestyle factors. This increasing prevalence has created a strong demand for effective diagnostic tools and biomarkers that can aid in the early identification and intervention of cognitive impairment.

Advancements in medical imaging technologies, such as PET and MRI, have played a crucial role in the growth of the market. These imaging techniques allow for the visualization of biomarkers associated with cognitive impairment, enabling researchers and clinicians to better understand the underlying disease processes.

Future Forecast for Cognitive Impairment Biomarkers Market Industry:

Looking ahead, the global cognitive impairment biomarkers market industry is expected to rise at a CAGR of 5.3% from 2023 to 2033. During the forecast period, the market size is expected to reach US$ 13.3 billion by 2033.

The cognitive impairment biomarkers industry is expected to continue its growth trajectory from 2023 to 2033, there is a growing focus on identifying biomarkers with higher specificity and accuracy for different types and stages of cognitive impairment. Advancements in biomarker discovery techniques, including genomics, proteomics, and metabolomics, combined with artificial intelligence and machine learning, can enhance the identification and validation of biomarkers. More precise and reliable biomarkers will enable earlier and more accurate diagnosis, facilitating targeted interventions and treatment strategies.

The integration of digital health technologies, such as mobile apps, wearables, and connected devices, will shape the future growth of the cognitive impairment biomarkers market. These technologies enable remote monitoring, real-time data collection, and improved patient engagement.

Comparative View of the Cognitive Impairment Biomarkers Market

Cognitive Impairment Biomarkers Market:

Attributes Cognitive Impairment Biomarkers Market
CAGR (2023 to 2033) 5.3%
Market Value (2033) US$ 13.3 billion
Opportunity Rapid advancements in technology, including artificial intelligence (AI) and machine learning (ML), offer opportunities for more sophisticated analysis and interpretation of biomarker data. These technologies can help identify complex patterns, develop predictive models, and extract meaningful insights from large-scale biomarker datasets. The integration of AI and ML in biomarker analysis can enhance diagnostic accuracy, refine treatment approaches, and support clinical decision-making.
Key Trends The utilization of multi-omics approaches, which involve the integration of various omics data such as proteomics, genomics, epigenomics, and metabolomics, is an exclusive trend in the cognitive impairment biomarkers market. These approaches allow to understand molecular mechanisms underlying cognitive impairment comprehensively and the identification of novel biomarkers associated with the disease.

Cognitive Diagnostics Market:

Attributes Cognitive Diagnostics Market
CAGR (2023 to 2033) 8.0%
Market Value (2033) US$ 238.3 billion
Opportunity The development of rapid and cost-effective point-of-care cognitive diagnostic tests can expand access to cognitive assessments. Point-of-care tests eliminate the need for specialized laboratory equipment and can be conducted in various healthcare settings, including primary care clinics and community centers.
Key Trends Digital cognitive assessments are gaining popularity as they offer advantages such as scalability, remote administration, and real-time data analysis. These assessments can be conducted through web-based platforms, mobile applications, or computerized tests. The trend towards digital cognitive assessments allows for greater accessibility, objective measurement of cognitive function, and the potential for continuous monitoring.

Neurological Biomarkers Market:

Attributes Neurological Biomarkers Market
CAGR (2023 to 2033) 4.6%
Market Value (2033) US$ 12.5 billion
Opportunity The rising prevalence of neurological disorders, such as Alzheimer's disease, Parkinson's disease, multiple sclerosis, and stroke, presents a substantial opportunity for the neurological biomarkers market. As the global population ages and lifestyles change, the demand for accurate diagnostic tools and prognostic indicators for neurological disorders is expected to grow.
Key Trends Precision medicine approaches, which involve tailoring treatment strategies to individual patients based on their biomarker profiles, are gaining traction in the neurological biomarkers market. Biomarkers can aid in patient stratification, identifying responders to specific therapies, and predicting treatment outcomes. Precision medicine approaches hold the potential to improve treatment efficacy, minimize side effects, and optimize patient care in neurological disorders.
Sabyasachi Ghosh
Sabyasachi Ghosh

Principal Consultant

Talk to Analyst

Find your sweet spots for generating winning opportunities in this market.

Country-Wise Insights

Cognitive Impairment Biomarkers Market to Surge in the United States Due to Advancement in Biomarkers Technologies

Country The United States
Market Size (US$ billion) by End of Forecast Period (2033) US$ 4.8 Billion
CAGR % 2023 to End of Forecast (2033) 6.1%

The cognitive impairment biomarkers industry in the United States is expected to reach a market size of US$ 4.8 Billion by 2033, expanding at a CAGR of 6.1%. The development of innovative biomarker technologies is driving the cognitive impairment biomarkers market in the United States. Advancements in genetic testing, neuroimaging techniques, and fluid-based biomarker analysis have improved the accuracy and reliability of biomarker measurements, allowing for better detection and monitoring of cognitive disorders.

Increasing Focus on Early Diagnosis for Cognitive Impairment Biomarkers Market is Propelled the United Kingdom Market Growth

Country The United Kingdom
Market Size (US$ billion) by End of Forecast Period (2033) US$ 699.6 million
CAGR % 2023 to End of Forecast (2033) 6.0%

The cognitive impairment biomarkers industry in the United Kingdom is expected to reach a market share of US$ 699.6 million, expanding at a CAGR of 6.0% during the forecast period. There is a growing emphasis on early diagnosis and intervention for cognitive disorders in the United Kingdom. Biomarkers play a crucial role in enabling early detection, which allows for timely intervention, better disease management, and improved patient outcomes. Biomarker-based tests help identify individuals at high risk or in the early stages of cognitive impairment, enabling targeted interventions and support.

Notable Growth Expected in China's Cognitive Impairment Biomarkers Market due to Increasing Awareness

Country China
Market Size (US$ billion) by End of Forecast Period (2033) US$ 988.8 million
CAGR % 2023 to End of Forecast (2033) 7.3%

The cognitive impairment biomarkers industry in China is anticipated to reach a market size of US$ 988.8 million, moving at a CAGR of 7.3% during the forecast period. There is a growing awareness among healthcare professionals, patients, and caregivers in China regarding the importance of biomarkers in cognitive impairment. Education campaigns, conferences, and training programs contribute to increased understanding of biomarkers and their role in early detection, diagnosis, and personalized treatment of cognitive disorders.
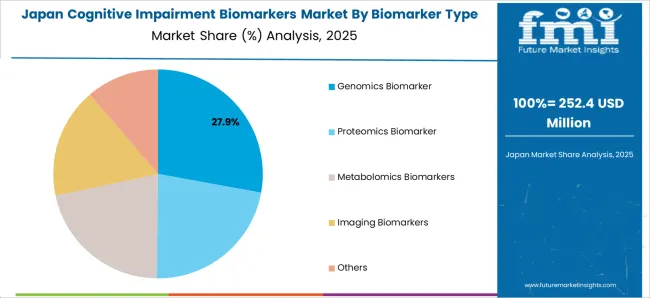
Government Initiatives is Driving Market Growth in Japan

Country Japan
Market Size (US$ billion) by End of Forecast Period (2033) US$ 720.5 million
CAGR % 2023 to End of Forecast (2033) 7.2%

The cognitive impairment biomarkers industry in Japan is estimated to reach a market size of US$ 720.5 million by 2033, thriving at a CAGR of 7.2%. The Japanese government has implemented initiatives and healthcare policies to address the challenges posed by cognitive disorders and promote healthy aging. These initiatives include supporting the development and adoption of biomarker-based diagnostics to improve early diagnosis, intervention, and disease management.
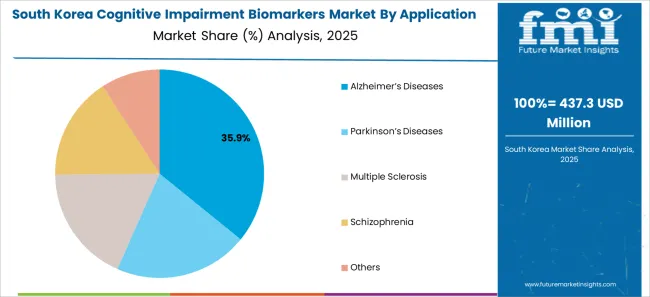
Collaboration between Academia, Industry, and Healthcare Providers is Propelling the Cognitive Impairment Biomarkers Market

Country South Korea
Market Size (US$ billion) by End of Forecast Period (2033) US$ 816.5 million
CAGR % 2023 to End of Forecast (2033) 7.0%

The cognitive impairment biomarkers industry in South Korea is expected to reach a market size of US$ 816.5 million, expanding at a CAGR of 7.0% during the forecast period. Collaboration between academic institutions, industry players, and healthcare providers is driving innovation in the cognitive impairment biomarkers market in South Korea. These collaborations facilitate the exchange of knowledge, resources, and expertise, leading to the development of novel biomarker-based diagnostic tools and therapies.

Category-Wise Insights

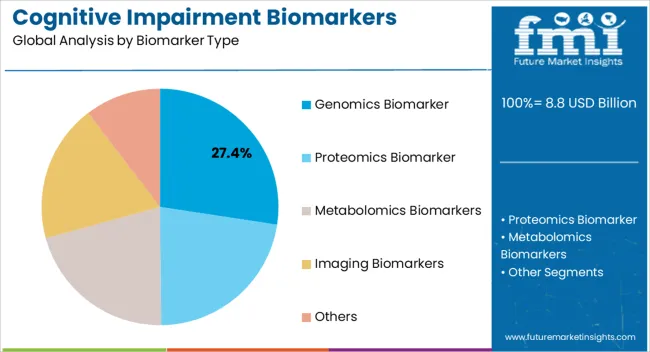
Genomics Biomarker to Dominate Cognitive Impairment Biomarkers Market Industry with 5.2% CAGR through 2033

Genomics Biomarker is expected to dominate the cognitive impairment biomarkers industry with a CAGR of 5.2% from 2023 to 2033. Genomics biomarkers enable early detection and risk assessment of cognitive impairment. By analyzing an individual's genetic profile, it is possible to identify those at higher risk for developing cognitive disorders. This information can be used for targeted screening, intervention, and prevention strategies. Genomics biomarkers also help stratify individuals in clinical trials, allowing for personalized treatment approaches and monitoring of treatment response.

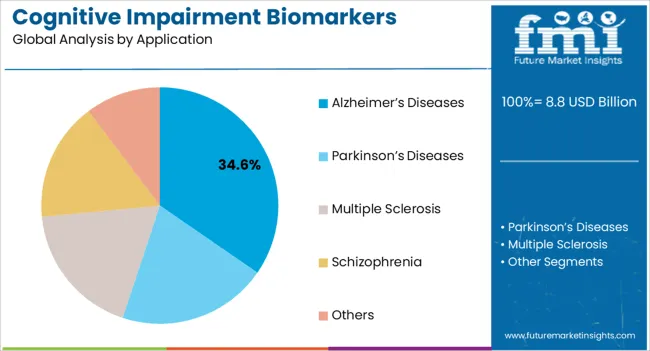
Which Application Are Driving the Cognitive Impairment Biomarkers Market?

Alzheimer's Diseases is expected to dominate the cognitive impairment biomarkers industry with a CAGR of 5.2% from 2023 to 2033. Biomarkers are valuable tools for monitoring disease progression in Alzheimer's disease. They provide insights into the underlying pathological processes and help assess the efficacy of potential treatments. Biomarker measurements, such as changes in beta-amyloid and tau levels, can indicate disease progression, track treatment response, and aid in evaluating the effectiveness of disease-modifying therapies.

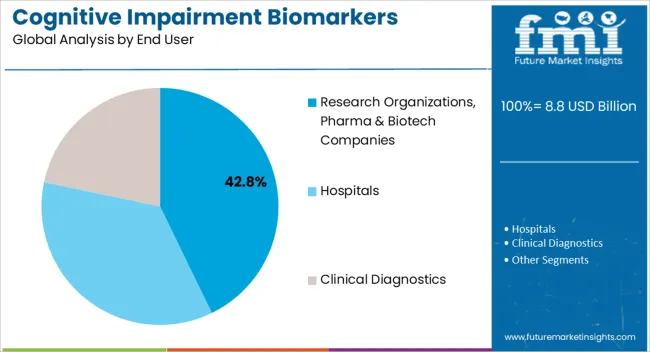
Which End User is Widely Adopted the Cognitive Impairment Biomarkers Market?

Hospitals is expected to dominate the cognitive impairment biomarkers industry with a CAGR of 5.5% from 2023 to 2033. Hospitals serve as diagnostic centers where individuals with cognitive impairment symptoms can undergo comprehensive assessments, including the measurement of cognitive impairment biomarkers. Hospitals with specialized neurology or geriatrics departments are equipped with the necessary infrastructure and expertise to perform biomarker testing and analysis. They provide access to various diagnostic tools, such as genetic testing, neuroimaging, and biomarker measurements from blood or cerebrospinal fluid samples.
Get the data you need at a Fraction of the cost

Personalize your report by choosing insights you need
and save 40%!

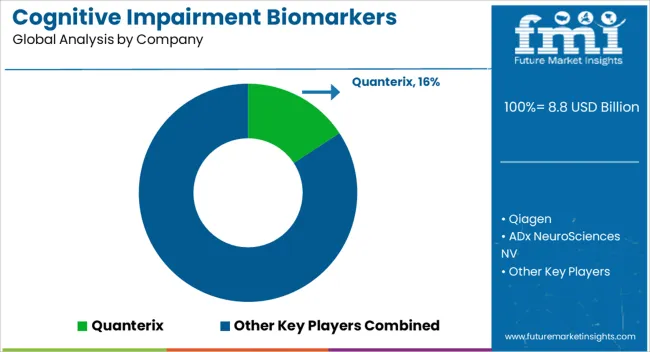
How Key Players Stay Competitive in the Cognitive Impairment Biomarkers Market Industry?

The cognitive impairment biomarkers market is fiercely competitive, with many companies fighting for market dominance. To stay ahead of the competition in such a circumstance, essential players must develop effective conjugates.

Key Strategies Used by the Participants

  • Product Development

Companies are investing in research & development to deliver product that improve efficiency, dependability, and cost-effectiveness. Product innovation allows businesses to differentiate themselves from their competition while also catering to the changing demands of their clients.

  • Strategic Alliances & Collaborations

Key industry leaders frequently develop strategic partnerships and collaborations with other companies in order to harness their strengths and increase their market reach. Companies might also gain access to new technology and markets through such agreements.

  • Expansion into Emerging Markets

The cognitive impairment biomarkers market is expanding rapidly in emerging regions such as China and India. Key firms are enhancing their distribution networks and developing local manufacturing facilities to increase their presence in these areas.

  • Acquisitions and mergers

Mergers and acquisitions are frequently used by key players in the cognitive impairment biomarkers industry to consolidate their market position, extend their product range, and gain access to new markets.

Key Players in the Cognitive Impairment Biomarkers Market Industry

  • Quanterix
  • Qiagen
  • ADx NeuroSciences NV
  • Merck KGaA
  • Enrolmmun
  • Thermo Fisher Scientific
  • ACOBIOM
  • Banyan Biomarkers Inc
  • Olink Biosciences
  • Bio-Rad Laboratories Inc

Key Developments in the Cognitive Impairment Biomarkers Market:

In August 2022, Thermo Fisher Scientific Inc. to increase the size of its local medical device assembly facility and add more than 100 local employments, aims to invest $40 million.

Segmentation Analysis of the Cognitive Impairment Biomarkers Market

By Biomarker Type:

  • Genomics Biomarker
  • Proteomics Biomarker
  • Metabolomics Biomarkers
  • Imaging Biomarkers
  • Others

By Application:

  • Alzheimer's Diseases
  • Parkinson's Diseases
  • Multiple Sclerosis
  • Schizophrenia
  • Others

By End User:

  • Research Organizations, Pharma & Biotech Companies
  • Hospitals
  • Clinical Diagnostics

By Region:

  • North America
  • Latin America
  • Europe
  • East Asia
  • South Asia
  • Oceania
  • The Middle East & Africa

Frequently Asked Questions

How Big is the Cognitive Impairment Biomarkers Market?

The market is valued at US$ 7.9 billion in 2023.

Who are the Key Cognitive Impairment Biomarkers Market Players?

AliveCor Inc., Altoida Inc., and Amgen Inc. are key cognitive impairment biomarkers market players.

Which Industry is the Key Consumer of the Cognitive Impairment Biomarkers Market?

The primary consumer for the cognitive impairment biomarkers market is the healthcare industry.

How Big Will the Cognitive Impairment Biomarkers Market by 2033?

The market is estimated to reach US$ 13.3 billion by 2033.

What is the Growth Forecast for the Cognitive Impairment Biomarkers Market?

The market is forecast to register a CAGR of 5.3% through 2033.

Table of Content

1. Executive Summary

    1.1. Global Market Outlook

    1.2. Demand Side Trends

    1.3. Supply Side Trends

    1.4. Analysis and Recommendations

2. Market Overview

    2.1. Market Coverage / Taxonomy

    2.2. Market Definition / Scope / Limitations

    2.3. Inclusions and Exclusions

3. Key Market Trends

    3.1. Key Trends Impacting the Market

    3.2. Product Innovation / Development Trends

4. Value Added Insights

    4.1. Management of Patients with Neurodegenerative disease

    4.2. Prevalence of Disease Indication by Region

    4.3. Product Adoption Analysis

    4.4. Regulatory Landscape

    4.5. PESTEL Analysis

    4.6. Porter’s Analysis

5. Market Background

    5.1. Macro-Economic Factors

        5.1.1. Global GDP Growth Outlook

        5.1.2. Global Healthcare Expenditure Outlook

        5.1.3. Global Life science Market Overview

    5.2. Forecast Factors - Relevance & Impact

        5.2.1. Key Player’s Historic Growth

        5.2.2. Increasing Disease Burden

        5.2.3. Advances in Biomarkers Research

        5.2.4. Regulatory Support

        5.2.5. Precision Medicine Approach

        5.2.6. Increasing Focus on Early Interventions

        5.2.7. Treatment Seeking Rate

    5.3. Dynamics

        5.3.1. Drivers

        5.3.2. Restraints

        5.3.3. Opportunity Analysis

6. Global Market Demand (in Value or Size in US$ Mn) Analysis 2017 to 2022 and Forecast, 2023 to 2033

    6.1. Historical Market Value (US$ Million) Analysis, 2017 to 2022

    6.2. Current and Future Market Value (US$ Million) Projections, 2023 to 2033

        6.2.1. Y-o-Y Growth Trend Analysis

        6.2.2. Absolute $ Opportunity Analysis

7. Global Market Analysis 2017 to 2022 and Forecast 2023 to 2033, By Biomarker Type

    7.1. Introduction / Key Findings

    7.2. Historical Market Size (US$ Million) Analysis By Biomarker Type, 2017 to 2022

    7.3. Current and Future Market Size (US$ Million) Analysis and Forecast By Biomarker Type, 2023 to 2033

        7.3.1. Genomics Biomarker

        7.3.2. Proteomics Biomarker

        7.3.3. Metabolomics Biomarkers

        7.3.4. Imaging Biomarkers

        7.3.5. Others

    7.4. Market Attractiveness Analysis By Biomarker Type

8. Global Market Analysis 2017 to 2022 and Forecast 2023 to 2033, By Application

    8.1. Introduction / Key Findings

    8.2. Historical Market Size (US$ Million) Analysis By Application, 2017 to 2022

    8.3. Current and Future Market Size (US$ Million) Analysis and Forecast By Application, 2023 to 2033

        8.3.1. Alzheimer's Diseases

        8.3.2. Parkinson's Diseases

        8.3.3. Multiple Sclerosis

        8.3.4. Schizophrenia

        8.3.5. Others

    8.4. Market Attractiveness Analysis By Application

9. Global Market Analysis 2017 to 2022 and Forecast 2023 to 2033, By End User

    9.1. Introduction / Key Findings

    9.2. Historical Market Size (US$ Million) Analysis By End User, 2017 to 2022

    9.3. Current and Future Market Size (US$ Million) Analysis and Forecast By End User, 2023 to 2033

        9.3.1. Research Organizations, Pharma & Biotech Companies

        9.3.2. Hospitals

        9.3.3. Clinical Diagnostics

    9.4. Market Attractiveness Analysis By End User

10. Global Market Analysis 2017 to 2022 and Forecast 2023 to 2033, by Region

    10.1. Introduction

    10.2. Historical Market Size (US$ Million) Analysis By Region, 2017 to 2022

    10.3. Current and Future Market Size (US$ Million) Analysis and Forecast By Region, 2023 to 2033

        10.3.1. North America

        10.3.2. Latin America

        10.3.3. Europe

        10.3.4. South Asia

        10.3.5. East Asia

        10.3.6. Oceania

        10.3.7. Middle East and Africa (MEA)

    10.4. Market Attractiveness Analysis By Region

11. North America Market Analysis 2017 to 2022 and Forecast 2023 to 2033

    11.1. Introduction

    11.2. Historical Market Size (US$ Million) Analysis By Market Taxonomy, 2017 to 2022

    11.3. Current and Future Market Size (US$ Million) Analysis and Forecast By Market Taxonomy, 2023 to 2033

        11.3.1. By Country

            11.3.1.1. USA

            11.3.1.2. Canada

        11.3.2. By Biomarker Type

        11.3.3. By Application

        11.3.4. By End User

    11.4. Market Attractiveness Analysis

        11.4.1. By Country

        11.4.2. By Biomarker Type

        11.4.3. By Application

        11.4.4. By End User

    11.5. Country Level Analysis & Forecast

        11.5.1. USA Market Analysis

            11.5.1.1. Introduction

            11.5.1.2. Market Analysis and Forecast by Market Taxonomy

                11.5.1.2.1. By Biomarker Type

                11.5.1.2.2. By Application

                11.5.1.2.3. By End User

        11.5.2. Canada Market Analysis

            11.5.2.1. Introduction

            11.5.2.2. Market Analysis and Forecast by Market Taxonomy

                11.5.2.2.1. By Biomarker Type

                11.5.2.2.2. By Application

                11.5.2.2.3. By End User

    11.6. Market Trends

    11.7. Key Market Participants - Intensity Mapping

    11.8. Drivers and Restraints - Impact Analysis

12. Latin America Market Analysis 2017 to 2022 and Forecast 2023 to 2033

    12.1. Introduction

    12.2. Historical Market Size (US$ Million) Analysis By Market Taxonomy, 2017 to 2022

    12.3. Current and Future Market Size (US$ Million) Analysis and Forecast By Market Taxonomy, 2023 to 2033

        12.3.1. By Country

            12.3.1.1. Brazil

            12.3.1.2. Mexico

            12.3.1.3. Argentina

            12.3.1.4. Rest of Latin America

        12.3.2. By Biomarker Type

        12.3.3. By Application

        12.3.4. By End User

    12.4. Market Attractiveness Analysis

        12.4.1. By Country

        12.4.2. By Biomarker Type

        12.4.3. By Application

        12.4.4. By End User

    12.5. Country Level Analysis & Forecast

        12.5.1. Brazil Market Analysis

            12.5.1.1. Introduction

            12.5.1.2. Market Analysis and Forecast by Market Taxonomy

                12.5.1.2.1. By Biomarker Type

                12.5.1.2.2. By Application

                12.5.1.2.3. By End User

        12.5.2. Mexico Market Analysis

            12.5.2.1. Introduction

            12.5.2.2. Market Analysis and Forecast by Market Taxonomy

                12.5.2.2.1. By Biomarker Type

                12.5.2.2.2. By Application

                12.5.2.2.3. By End User

        12.5.3. Argentina Market Analysis

            12.5.3.1. Introduction

            12.5.3.2. Market Analysis and Forecast by Market Taxonomy

                12.5.3.2.1. By Biomarker Type

                12.5.3.2.2. By Application

                12.5.3.2.3. By End User

    12.6. Market Trends

    12.7. Key Market Participants - Intensity Mapping

    12.8. Drivers and Restraints - Impact Analysis

13. Europe Market Analysis 2017 to 2022 and Forecast 2023 to 2033

    13.1. Introduction

    13.2. Historical Market Size (US$ Million) Analysis By Market Taxonomy, 2017 to 2022

    13.3. Current and Future Market Size (US$ Million) Analysis and Forecast By Market Taxonomy, 2023 to 2033

        13.3.1. By Country

            13.3.1.1. Germany

            13.3.1.2. France

            13.3.1.3. Italy

            13.3.1.4. UK

            13.3.1.5. Spain

            13.3.1.6. Russia

            13.3.1.7. BENELUX

            13.3.1.8. Rest of Europe

        13.3.2. By Biomarker Type

        13.3.3. By Application

        13.3.4. By End User

    13.4. Market Attractiveness Analysis

        13.4.1. By Country

        13.4.2. By Biomarker Type

        13.4.3. By Application

        13.4.4. By End User

    13.5. Country Level Analysis & Forecast

        13.5.1. Germany Market Analysis

            13.5.1.1. Introduction

            13.5.1.2. Market Analysis and Forecast by Market Taxonomy

                13.5.1.2.1. By Biomarker Type

                13.5.1.2.2. By Application

                13.5.1.2.3. By End User

        13.5.2. France Market Analysis

            13.5.2.1. Introduction

            13.5.2.2. Market Analysis and Forecast by Market Taxonomy

                13.5.2.2.1. By Biomarker Type

                13.5.2.2.2. By Application

                13.5.2.2.3. By End User

        13.5.3. Italy Market Analysis

            13.5.3.1. Introduction

            13.5.3.2. Market Analysis and Forecast by Market Taxonomy

                13.5.3.2.1. By Biomarker Type

                13.5.3.2.2. By Application

                13.5.3.2.3. By End User

        13.5.4. UK Market Analysis

            13.5.4.1. Introduction

            13.5.4.2. Market Analysis and Forecast by Market Taxonomy

                13.5.4.2.1. By Biomarker Type

                13.5.4.2.2. By Application

                13.5.4.2.3. By End User

        13.5.5. Spain Market Analysis

            13.5.5.1. Introduction

            13.5.5.2. Market Analysis and Forecast by Market Taxonomy

                13.5.5.2.1. By Biomarker Type

                13.5.5.2.2. By Application

                13.5.5.2.3. By End User

        13.5.6. Russia Market Analysis

            13.5.6.1. Introduction

            13.5.6.2. Market Analysis and Forecast by Market Taxonomy

                13.5.6.2.1. By Biomarker Type

                13.5.6.2.2. By Application

                13.5.6.2.3. By End User

        13.5.7. BENELUX Market Analysis

            13.5.7.1. Introduction

            13.5.7.2. Market Analysis and Forecast by Market Taxonomy

                13.5.7.2.1. By Biomarker Type

                13.5.7.2.2. By Application

                13.5.7.2.3. By End User

    13.6. Market Trends

    13.7. Key Market Participants - Intensity Mapping

    13.8. Drivers and Restraints - Impact Analysis

14. South Asia Market Analysis 2017 to 2022 and Forecast 2023 to 2033

    14.1. Introduction

    14.2. Historical Market Size (US$ Million) Analysis By Market Taxonomy, 2017 to 2022

    14.3. Current and Future Market Size (US$ Million) Analysis and Forecast By Market Taxonomy, 2023 to 2033

        14.3.1. By Country

            14.3.1.1. India

            14.3.1.2. Thailand

            14.3.1.3. Indonesia

            14.3.1.4. Malaysia

            14.3.1.5. Rest of South Asia

        14.3.2. By Biomarker Type

        14.3.3. By Application

        14.3.4. By End User

    14.4. Market Attractiveness Analysis

        14.4.1. By Country

        14.4.2. By Biomarker Type

        14.4.3. By Application

        14.4.4. By End User

    14.5. Country Level Analysis & Forecast

        14.5.1. India Market Analysis

            14.5.1.1. Introduction

            14.5.1.2. Market Analysis and Forecast by Market Taxonomy

                14.5.1.2.1. By Biomarker Type

                14.5.1.2.2. By Application

                14.5.1.2.3. By End User

        14.5.2. Thailand Market Analysis

            14.5.2.1. Introduction

            14.5.2.2. Market Analysis and Forecast by Market Taxonomy

                14.5.2.2.1. By Biomarker Type

                14.5.2.2.2. By Application

                14.5.2.2.3. By End User

        14.5.3. Indonesia Market Analysis

            14.5.3.1. Introduction

            14.5.3.2. Market Analysis and Forecast by Market Taxonomy

                14.5.3.2.1. By Biomarker Type

                14.5.3.2.2. By Application

                14.5.3.2.3. By End User

        14.5.4. Malaysia Market Analysis

            14.5.4.1. Introduction

            14.5.4.2. Market Analysis and Forecast by Market Taxonomy

                14.5.4.2.1. By Biomarker Type

                14.5.4.2.2. By Application

                14.5.4.2.3. By End User

    14.6. Market Trends

    14.7. Key Market Participants - Intensity Mapping

    14.8. Drivers and Restraints - Impact Analysis

15. East Asia Market Analysis 2017 to 2022 and Forecast 2023 to 2033

    15.1. Introduction

    15.2. Historical Market Size (US$ Million) Analysis By Market Taxonomy, 2017 to 2022

    15.3. Current and Future Market Size (US$ Million) Analysis and Forecast By Market Taxonomy, 2023 to 2033

        15.3.1. By Country

            15.3.1.1. China

            15.3.1.2. Japan

            15.3.1.3. South Korea

        15.3.2. By Biomarker Type

        15.3.3. By Application

        15.3.4. By End User

    15.4. Market Attractiveness Analysis

        15.4.1. By Country

        15.4.2. By Biomarker Type

        15.4.3. By Application

        15.4.4. By End User

    15.5. Country Level Analysis & Forecast

        15.5.1. China Market Analysis

            15.5.1.1. Introduction

            15.5.1.2. Market Analysis and Forecast by Market Taxonomy

                15.5.1.2.1. By Biomarker Type

                15.5.1.2.2. By Application

                15.5.1.2.3. By End User

        15.5.2. Japan Market Analysis

            15.5.2.1. Introduction

            15.5.2.2. Market Analysis and Forecast by Market Taxonomy

                15.5.2.2.1. By Biomarker Type

                15.5.2.2.2. By Application

                15.5.2.2.3. By End User

        15.5.3. South Korea Market Analysis

            15.5.3.1. Introduction

            15.5.3.2. Market Analysis and Forecast by Market Taxonomy

                15.5.3.2.1. By Biomarker Type

                15.5.3.2.2. By Application

                15.5.3.2.3. By End User

    15.6. Market Trends

    15.7. Key Market Participants - Intensity Mapping

    15.8. Drivers and Restraints - Impact Analysis

16. Oceania Market Analysis 2017 to 2022 and Forecast 2023 to 2033

    16.1. Introduction

    16.2. Historical Market Size (US$ Million) Analysis By Market Taxonomy, 2017 to 2022

    16.3. Current and Future Market Size (US$ Million) Analysis and Forecast By Market Taxonomy, 2023 to 2033

        16.3.1. By Country

            16.3.1.1. Australia

            16.3.1.2. New Zealand

        16.3.2. By Biomarker Type

        16.3.3. By Application

        16.3.4. By End User

    16.4. Market Attractiveness Analysis

        16.4.1. By Country

        16.4.2. By Biomarker Type

        16.4.3. By Application

        16.4.4. By End User

    16.5. Country Level Analysis & Forecast

        16.5.1. Australia Market Analysis

            16.5.1.1. Introduction

            16.5.1.2. Market Analysis and Forecast by Market Taxonomy

                16.5.1.2.1. By Biomarker Type

                16.5.1.2.2. By Application

                16.5.1.2.3. By End User

        16.5.2. New Zealand Market Analysis

            16.5.2.1. Introduction

            16.5.2.2. Market Analysis and Forecast by Market Taxonomy

                16.5.2.2.1. By Biomarker Type

                16.5.2.2.2. By Application

                16.5.2.2.3. By End User

    16.6. Market Trends

    16.7. Key Market Participants - Intensity Mapping

    16.8. Drivers and Restraints - Impact Analysis

17. Middle East and Africa Market Analysis 2017 to 2022 and Forecast 2023 to 2033

    17.1. Introduction

    17.2. Historical Market Size (US$ Million) Analysis By Market Taxonomy, 2017 to 2022

    17.3. Current and Future Market Size (US$ Million) Analysis and Forecast By Market Taxonomy, 2023 to 2033

        17.3.1. By Country

            17.3.1.1. GCC Countries

            17.3.1.2. Türkiye

            17.3.1.3. Northern Africa

            17.3.1.4. South Africa

            17.3.1.5. Rest of Middle East and Africa

        17.3.2. By Biomarker Type

        17.3.3. By Application

        17.3.4. By End User

    17.4. Market Attractiveness Analysis

        17.4.1. By Country

        17.4.2. By Biomarker Type

        17.4.3. By Application

        17.4.4. By End User

    17.5. Country Level Analysis & Forecast

        17.5.1. GCC Countries Market Analysis

            17.5.1.1. Introduction

            17.5.1.2. Market Analysis and Forecast by Market Taxonomy

                17.5.1.2.1. By Biomarker Type

                17.5.1.2.2. By Application

                17.5.1.2.3. By End User

        17.5.2. Türkiye Market Analysis

            17.5.2.1. Introduction

            17.5.2.2. Market Analysis and Forecast by Market Taxonomy

                17.5.2.2.1. By Biomarker Type

                17.5.2.2.2. By Application

                17.5.2.2.3. By End User

        17.5.3. Northern Africa Market Analysis

            17.5.3.1. Introduction

            17.5.3.2. Market Analysis and Forecast by Market Taxonomy

                17.5.3.2.1. By Biomarker Type

                17.5.3.2.2. By Application

                17.5.3.2.3. By End User

        17.5.4. South Africa Market Analysis

            17.5.4.1. Introduction

            17.5.4.2. Market Analysis and Forecast by Market Taxonomy

                17.5.4.2.1. By Biomarker Type

                17.5.4.2.2. By Application

                17.5.4.2.3. By End User

    17.6. Market Trends

    17.7. Key Market Participants - Intensity Mapping

    17.8. Drivers and Restraints - Impact Analysis

18. Market Structure Analysis

    18.1. Market Analysis by Tier of Companies

    18.2. Market Share Analysis of Top Players

    18.3. Market Presence Analysis

19. Competition Analysis

    19.1. Competition Dashboard

    19.2. Branding and Promotional Strategies, By Key Players

    19.3. Key Development Analysis

    19.4. Competition Deep Dive

        19.4.1. Quanterix

            19.4.1.1. Overview

            19.4.1.2. Product Portfolio

            19.4.1.3. Key Financials

            19.4.1.4. Sales Footprint

            19.4.1.5. SWOT Analysis

            19.4.1.6. Strategy Overview

                19.4.1.6.1. Marketing Strategy

                19.4.1.6.2. Product Strategy

                19.4.1.6.3. Channel Strategy

        19.4.2. Qiagen

            19.4.2.1. Overview

            19.4.2.2. Product Portfolio

            19.4.2.3. Key Financials

            19.4.2.4. Sales Footprint

            19.4.2.5. SWOT Analysis

            19.4.2.6. Strategy Overview

                19.4.2.6.1. Marketing Strategy

                19.4.2.6.2. Product Strategy

                19.4.2.6.3. Channel Strategy

        19.4.3. ADx NeuroSciences NV

            19.4.3.1. Overview

            19.4.3.2. Product Portfolio

            19.4.3.3. Key Financials

            19.4.3.4. Sales Footprint

            19.4.3.5. SWOT Analysis

            19.4.3.6. Strategy Overview

                19.4.3.6.1. Marketing Strategy

                19.4.3.6.2. Product Strategy

                19.4.3.6.3. Channel Strategy

        19.4.4. Merck KGaA

            19.4.4.1. Overview

            19.4.4.2. Product Portfolio

            19.4.4.3. Key Financials

            19.4.4.4. Sales Footprint

            19.4.4.5. SWOT Analysis

            19.4.4.6. Strategy Overview

                19.4.4.6.1. Marketing Strategy

                19.4.4.6.2. Product Strategy

                19.4.4.6.3. Channel Strategy

        19.4.5. Enrolmmun

            19.4.5.1. Overview

            19.4.5.2. Product Portfolio

            19.4.5.3. Key Financials

            19.4.5.4. Sales Footprint

            19.4.5.5. SWOT Analysis

            19.4.5.6. Strategy Overview

                19.4.5.6.1. Marketing Strategy

                19.4.5.6.2. Product Strategy

                19.4.5.6.3. Channel Strategy

        19.4.6. Thermo Fisher Scientific

            19.4.6.1. Overview

            19.4.6.2. Product Portfolio

            19.4.6.3. Key Financials

            19.4.6.4. Sales Footprint

            19.4.6.5. SWOT Analysis

            19.4.6.6. Strategy Overview

                19.4.6.6.1. Marketing Strategy

                19.4.6.6.2. Product Strategy

                19.4.6.6.3. Channel Strategy

        19.4.7. ACOBIOM

            19.4.7.1. Overview

            19.4.7.2. Product Portfolio

            19.4.7.3. Key Financials

            19.4.7.4. Sales Footprint

            19.4.7.5. SWOT Analysis

            19.4.7.6. Strategy Overview

                19.4.7.6.1. Marketing Strategy

                19.4.7.6.2. Product Strategy

                19.4.7.6.3. Channel Strategy

        19.4.8. Banyan Biomarkers Inc

            19.4.8.1. Overview

            19.4.8.2. Product Portfolio

            19.4.8.3. Key Financials

            19.4.8.4. Sales Footprint

            19.4.8.5. SWOT Analysis

            19.4.8.6. Strategy Overview

                19.4.8.6.1. Marketing Strategy

                19.4.8.6.2. Product Strategy

                19.4.8.6.3. Channel Strategy

        19.4.9. Olink Biosciences

            19.4.9.1. Overview

            19.4.9.2. Product Portfolio

            19.4.9.3. Key Financials

            19.4.9.4. Sales Footprint

            19.4.9.5. SWOT Analysis

            19.4.9.6. Strategy Overview

                19.4.9.6.1. Marketing Strategy

                19.4.9.6.2. Product Strategy

                19.4.9.6.3. Channel Strategy

        19.4.10. Bio-Rad Laboratories Inc

            19.4.10.1. Overview

            19.4.10.2. Product Portfolio

            19.4.10.3. Key Financials

            19.4.10.4. Sales Footprint

            19.4.10.5. SWOT Analysis

            19.4.10.6. Strategy Overview

                19.4.10.6.1. Marketing Strategy

                19.4.10.6.2. Product Strategy

                19.4.10.6.3. Channel Strategy

20. Assumptions and Acronyms Used

21. Research Methodology

List of Tables

Table 01: Global Market Analysis 2017 to 2022 and Forecast 2023 to 2033, By Biomarker Type

Table 02: Global Market Analysis 2017 to 2022 and Forecast 2023 to 2033 By Application

Table 03: Global Market Analysis 2017 to 2022 and Forecast 2023 to 2033, by End User

Table 04: Global Market Analysis 2017 to 2022 and Forecast 2023 to 2033, by Region

Table 05: North America Market Value (US$ Million) Analysis 2017 to 2022 and Forecast 2023 to 2033, by Country

Table 06: North America Market Value (US$ Million) Analysis 2017 to 2022 and Forecast 2023 to 2033, By Biomarker Type

Table 07: North America Market Value (US$ Million) Analysis 2017 to 2022 and Forecast 2023 to 2033, By Application

Table 08: North America Market Value (US$ Million) Analysis 2017 to 2022 and Forecast 2023 to 2033, by End User

Table 09: Latin America Market Value (US$ Million) Analysis 2017 to 2022 and Forecast 2023 to 2033, by Country

Table 10: Latin America Market Value (US$ Million) Analysis 2017 to 2022 and Forecast 2023 to 2033, By Biomarker Type

Table 11: Latin America Market Value (US$ Million) Analysis 2017 to 2022 and Forecast 2023 to 2033, By Application

Table 12: Latin America Market Value (US$ Million) Analysis 2017 to 2022 and Forecast 2023 to 2033, by End User

Table 13: Europe Market Value (US$ Million) Analysis 2017 to 2022 and Forecast 2023 to 2033, by Country

Table 14: Europe Market Value (US$ Million) Analysis 2017 to 2022 and Forecast 2023 to 2033, By Biomarker Type

Table 15: Europe Market Analysis 2017 to 2022 and Forecast 2023 to 2033By Application

Table 16: Europe Market Value (US$ Million) Analysis 2017 to 2022 and Forecast 2023 to 2033, by End User

Table 17: East Asia Market Value (US$ Million) Analysis 2017 to 2022 and Forecast 2023 to 2033, by Country

Table 18: East Asia Market Value (US$ Million) Analysis 2017 to 2022 and Forecast 2023 to 2033, By Biomarker Type

Table 19: East Asia Market Value (US$ Million) Analysis 2017 to 2022 and Forecast 2023 to 2033, By Application

Table 20: East Asia Market Value (US$ Million) Analysis 2017 to 2022 and Forecast 2023 to 2033, by End User

Table 21: South Asia Market Value (US$ Million) Analysis 2017 to 2022 and Forecast 2023 to 2033, by Country

Table 22: South Asia Market Value (US$ Million) Analysis 2017 to 2022 and Forecast 2023 to 2033, By Biomarker Type

Table 23: South Asia Market Value (US$ Million) Analysis 2017 to 2022 and Forecast 2023 to 2033, By Application

Table 24: South Asia Market Value (US$ Million) Analysis 2017 to 2022 and Forecast 2023 to 2033, by End User

Table 25: Oceania Market Value (US$ Million) Analysis 2017 to 2022 and Forecast 2023 to 2033, by Country

Table 26: Oceania Market Value (US$ Million) Analysis 2017 to 2022 and Forecast 2023 to 2033, By Biomarker Type

Table 27: Oceania Market Analysis 2017 to 2022 and Forecast 2023 to 2033By Application

Table 28: Oceania Market Value (US$ Million) Analysis 2017 to 2022 and Forecast 2023 to 2033, by End User

Table 29: Middle East & Africa Market Value (US$ Million) Analysis 2017 to 2022 and Forecast 2023 to 2033, by Country

Table 30: Middle East & Africa Market Value (US$ Million) Analysis 2017 to 2022 and Forecast 2023 to 2033, By Biomarker Type

Table 31: Middle East & Africa Market Analysis 2017 to 2022 and Forecast 2023 to 2033By Application

Table 32: Middle East & Africa Market Value (US$ Million) Analysis 2017 to 2022 and Forecast 2023 to 2033, by End User

List of Charts

Figure 01: Global Market Value (US$ Million) Analysis, 2017 to 2022

Figure 02: Global Market Forecast & Y-o-Y Growth, 2023 to 2033

Figure 03: Global Market Absolute $ Opportunity (US$ Million) Analysis, 2023 to 2033

Figure 04: Global Market Value Share (%) Analysis 2022 and 2033, By Biomarker Type

Figure 05: Global Market Y-o-Y Growth (%) Analysis 2023 to 2033, By Biomarker Type

Figure 06: Global Market Attractiveness Analysis 2023 to 2033, By Biomarker Type

Figure 07: Global Market Value Share (%) Analysis 2022 and 2033, By Application

Figure 08: Global Market Y-o-Y Growth (%) Analysis 2023 to 2033, By Application

Figure 09: Global Market Attractiveness Analysis 2023 to 2033, By Application

Figure 10: Global Market Value Share (%) Analysis 2022 and 2033, by End User

Figure 11: Global Market Y-o-Y Growth (%) Analysis 2023 to 2033, by End User

Figure 12: Global Market Attractiveness Analysis 2023 to 2033, by End User

Figure 13: Global Market Value Share (%) Analysis 2022 and 2033, by Region

Figure 14: Global Market Y-o-Y Growth (%) Analysis 2023 to 2033, by Region

Figure 15: Global Market Attractiveness Analysis 2023 to 2033, by Region

Figure 16: North America Market Value (US$ Million) Analysis, 2017 to 2022

Figure 17: North America Market Value (US$ Million) Forecast, 2023 to 2033

Figure 18: North America Market Value Share, By Biomarker Type (2023 E)

Figure 19: North America Market Value Share, By Application (2023 E)

Figure 20: North America Market Value Share, by End User (2023 E)

Figure 21: North America Market Value Share, by Country (2023 E)

Figure 22: North America Market Attractiveness Analysis By Biomarker Type, 2023 to 2033

Figure 23: North America Market Attractiveness Analysis By Application, 2023 to 2033

Figure 24: North America Market Attractiveness Analysis by End User, 2023 to 2033

Figure 25: North America Market Attractiveness Analysis by Country, 2023 to 2033

Figure 26: USA Market Value Proportion Analysis, 2022

Figure 27: Global Vs. USA Growth Comparison

Figure 28: USA Market Share Analysis (%) By Biomarker Type, 2023 & 2033

Figure 29: USA Market Share Analysis (%) By Application, 2023 & 2033

Figure 30: USA Market Share Analysis (%) by End User, 2023 & 2033

Figure 31: Canada Market Value Proportion Analysis, 2022

Figure 32: Global Vs. Canada. Growth Comparison

Figure 33: Canada Market Share Analysis (%) By Biomarker Type, 2023 & 2033

Figure 34: Canada Market Share Analysis (%) By Application, 2023 & 2033

Figure 35: Canada Market Share Analysis (%) by End User, 2023 & 2033

Figure 36: Latin America Market Value (US$ Million) Analysis, 2017 to 2022

Figure 37: Latin America Market Value (US$ Million) Forecast, 2023 to 2033

Figure 38: Latin America Market Value Share, By Biomarker Type (2023 E)

Figure 39: Latin America Market Value Share, By Application (2023 E)

Figure 40: Latin America Market Value Share, by End User (2023 E)

Figure 41: Latin America Market Value Share, by Country (2023 E)

Figure 42: Latin America Market Attractiveness Analysis By Biomarker Type, 2023 to 2033

Figure 43: Latin America Market Attractiveness Analysis By Application, 2023 to 2033

Figure 44: Latin America Market Attractiveness Analysis by End User, 2023 to 2033

Figure 45: Latin America Market Attractiveness Analysis by Country, 2023 to 2033

Figure 46: Mexico Market Value Proportion Analysis, 2022

Figure 47: Global Vs Mexico Growth Comparison

Figure 48: Mexico Market Share Analysis (%) By Biomarker Type, 2023 & 2033

Figure 49: Mexico Market Share Analysis (%) By Application, 2023 & 2033

Figure 50: Mexico Market Share Analysis (%) by End User, 2023 & 2033

Figure 51: Brazil Market Value Proportion Analysis, 2022

Figure 52: Global Vs. Brazil. Growth Comparison

Figure 53: Brazil Market Share Analysis (%) By Biomarker Type, 2023 & 2033

Figure 54: Brazil Market Share Analysis (%) By Application, 2023 & 2033

Figure 55: Brazil Market Share Analysis (%) by End User, 2023 & 2033

Figure 56: Argentina Market Value Proportion Analysis, 2022

Figure 57: Global Vs Argentina Growth Comparison

Figure 58: Argentina Market Share Analysis (%) By Biomarker Type, 2023 & 2033

Figure 59: Argentina Market Share Analysis (%) By Application, 2023 & 2033

Figure 60: Argentina Market Share Analysis (%) by End User, 2023 & 2033

Figure 61: Europe Market Value (US$ Million) Analysis, 2017 to 2022

Figure 62: Europe Market Value (US$ Million) Forecast, 2023 to 2033

Figure 63: Europe Market Value Share, By Biomarker Type (2023 E)

Figure 64: Europe Market Value Share, By Application (2023 E)

Figure 65: Europe Market Value Share, by End User (2023 E)

Figure 66: Europe Market Value Share, by Country (2023 E)

Figure 67: Europe Market Attractiveness Analysis By Biomarker Type, 2023 to 2033

Figure 68: Europe Market Attractiveness Analysis By Application, 2023 to 2033

Figure 69: Europe Market Attractiveness Analysis by End User, 2023 to 2033

Figure 70: Europe Market Attractiveness Analysis by Country, 2023 to 2033

Figure 71: UK Market Value Proportion Analysis, 2022

Figure 72: Global Vs. UK Growth Comparison

Figure 73: UK Market Share Analysis (%) By Biomarker Type, 2023 & 2033

Figure 74: UK Market Share Analysis (%) By Application, 2023 & 2033

Figure 75: UK Market Share Analysis (%) by End User, 2023 & 2033

Figure 76: Germany Market Value Proportion Analysis, 2022

Figure 77: Global Vs. Germany Growth Comparison

Figure 78: Germany Market Share Analysis (%) By Biomarker Type, 2023 & 2033

Figure 79: Germany Market Share Analysis (%) By Application, 2023 & 2033

Figure 80: Germany Market Share Analysis (%) by End User, 2023 & 2033

Figure 81: Italy Market Value Proportion Analysis, 2022

Figure 82: Global Vs. Italy Growth Comparison

Figure 83: Italy Market Share Analysis (%) By Biomarker Type, 2023 & 2033

Figure 84: Italy Market Share Analysis (%) By Application, 2023 & 2033

Figure 85: Italy Market Share Analysis (%) by End User, 2023 & 2033

Figure 86: France Market Value Proportion Analysis, 2022

Figure 87: Global Vs France Growth Comparison

Figure 88: France Market Share Analysis (%) By Biomarker Type, 2023 & 2033

Figure 89: France Market Share Analysis (%) By Application, 2023 & 2033

Figure 90: France Market Share Analysis (%) by End User, 2023 & 2033

Figure 91: Spain Market Value Proportion Analysis, 2022

Figure 92: Global Vs Spain Growth Comparison

Figure 93: Spain Market Share Analysis (%) By Biomarker Type, 2023 & 2033

Figure 94: Spain Market Share Analysis (%) By Application, 2023 & 2033

Figure 95: Spain Market Share Analysis (%) by End User, 2023 & 2033

Figure 96: Russia Market Value Proportion Analysis, 2022

Figure 97: Global Vs Russia Growth Comparison

Figure 98: Russia Market Share Analysis (%) By Biomarker Type, 2023 & 2033

Figure 99: Russia Market Share Analysis (%) By Application, 2023 & 2033

Figure 100: Russia Market Share Analysis (%) by End User, 2023 & 2033

Figure 101: BENELUX Market Value Proportion Analysis, 2022

Figure 102: Global Vs BENELUX Growth Comparison

Figure 103: BENELUX Market Share Analysis (%) By Biomarker Type, 2023 & 2033

Figure 104: BENELUX Market Share Analysis (%) By Application, 2023 & 2033

Figure 105: BENELUX Market Share Analysis (%) by End User, 2023 & 2033

Figure 106: East Asia Market Value (US$ Million) Analysis, 2017 to 2022

Figure 107: East Asia Market Value (US$ Million) Forecast, 2023 to 2033

Figure 108: East Asia Market Value Share, By Biomarker Type (2023 E)

Figure 109: East Asia Market Value Share, By Application (2023 E)

Figure 110: East Asia Market Value Share, by End User (2023 E)

Figure 111: East Asia Market Value Share, by Country (2023 E)

Figure 112: East Asia Market Attractiveness Analysis By Biomarker Type, 2023 to 2033

Figure 113: East Asia Market Attractiveness Analysis By Application, 2023 to 2033

Figure 114: East Asia Market Attractiveness Analysis by End User, 2023 to 2033

Figure 115: East Asia Market Attractiveness Analysis by Country, 2023 to 2033

Figure 116: China Market Value Proportion Analysis, 2022

Figure 117: Global Vs. China Growth Comparison

Figure 118: China Market Share Analysis (%) By Biomarker Type, 2023 & 2033

Figure 119: China Market Share Analysis (%) By Application, 2023 & 2033

Figure 120: China Market Share Analysis (%) by End User, 2023 & 2033

Figure 121: Japan Market Value Proportion Analysis, 2022

Figure 122: Global Vs. Japan Growth Comparison

Figure 123: Japan Market Share Analysis (%) By Biomarker Type, 2023 & 2033

Figure 124: Japan Market Share Analysis (%) By Application, 2023 & 2033

Figure 125: Japan Market Share Analysis (%) by End User, 2023 & 2033

Figure 126: South Korea Market Value Proportion Analysis, 2022

Figure 127: Global Vs South Korea Growth Comparison

Figure 128: South Korea Market Share Analysis (%) By Biomarker Type, 2023 & 2033

Figure 129: South Korea Market Share Analysis (%) By Application, 2023 & 2033

Figure 130: South Korea Market Share Analysis (%) by End User, 2023 & 2033

Figure 131: South Asia Market Value (US$ Million) Analysis, 2017 to 2022

Figure 132: South Asia Market Value (US$ Million) Forecast, 2023 to 2033

Figure 133: South Asia Market Value Share, By Biomarker Type (2023 E)

Figure 134: South Asia Market Value Share, By Application (2023 E)

Figure 135: South Asia Market Value Share, by End User (2023 E)

Figure 136: South Asia Market Value Share, by Country (2023 E)

Figure 137: South Asia Market Attractiveness Analysis By Biomarker Type, 2023 to 2033

Figure 138: South Asia Market Attractiveness Analysis By Application, 2023 to 2033

Figure 139: South Asia Market Attractiveness Analysis by End User, 2023 to 2033

Figure 140: South Asia Market Attractiveness Analysis by Country, 2023 to 2033

Figure 141: India Market Value Proportion Analysis, 2022

Figure 142: Global Vs. India Growth Comparison

Figure 143: India Market Share Analysis (%) By Biomarker Type, 2023 & 2033

Figure 144: India Market Share Analysis (%) By Application, 2023 & 2033

Figure 145: India Market Share Analysis (%) by End User, 2023 & 2033

Figure 146: Indonesia Market Value Proportion Analysis, 2022

Figure 147: Global Vs. Indonesia Growth Comparison

Figure 148: Indonesia Market Share Analysis (%) By Biomarker Type, 2023 & 2033

Figure 149: Indonesia Market Share Analysis (%) By Application, 2023 & 2033

Figure 150: Indonesia Market Share Analysis (%) by End User, 2023 & 2033

Figure 151: Malaysia Market Value Proportion Analysis, 2022

Figure 152: Global Vs. Malaysia Growth Comparison

Figure 153: Malaysia Market Share Analysis (%) By Biomarker Type, 2023 & 2033

Figure 154: Malaysia Market Share Analysis (%) By Application, 2023 & 2033

Figure 155: Malaysia Market Share Analysis (%) by End User, 2023 & 2033

Figure 156: Thailand Market Value Proportion Analysis, 2022

Figure 157: Global Vs. Thailand Growth Comparison

Figure 158: Thailand Market Share Analysis (%) By Biomarker Type, 2023 & 2033

Figure 159: Thailand Market Share Analysis (%) By Application, 2023 & 2033

Figure 160: Thailand Market Share Analysis (%) by End User, 2023 & 2033

Figure 161: Oceania Market Value (US$ Million) Analysis, 2017 to 2022

Figure 162: Oceania Market Value (US$ Million) Forecast, 2023 to 2033

Figure 163: Oceania Market Value Share, By Biomarker Type (2023 E)

Figure 164: Oceania Market Value Share, By Application (2023 E)

Figure 165: Oceania Market Value Share, by End User (2023 E)

Figure 166: Oceania Market Value Share, by Country (2023 E)

Figure 167: Oceania Market Attractiveness Analysis By Biomarker Type, 2023 to 2033

Figure 168: Oceania Market Attractiveness Analysis By Application, 2023 to 2033

Figure 169: Oceania Market Attractiveness Analysis by End User, 2023 to 2033

Figure 170: Oceania Market Attractiveness Analysis by Country, 2023 to 2033

Figure 171: Australia Market Value Proportion Analysis, 2022

Figure 172: Global Vs. Australia Growth Comparison

Figure 173: Australia Market Share Analysis (%) By Biomarker Type, 2023 & 2033

Figure 174: Australia Market Share Analysis (%) By Application, 2023 & 2033

Figure 175: Australia Market Share Analysis (%) by End User, 2023 & 2033

Figure 176: New Zealand Market Value Proportion Analysis, 2022

Figure 177: Global Vs New Zealand Growth Comparison

Figure 178: New Zealand Market Share Analysis (%) By Biomarker Type, 2023 & 2033

Figure 179: New Zealand Market Share Analysis (%) By Application, 2023 & 2033

Figure 180: New Zealand Market Share Analysis (%) by End User, 2023 & 2033

Figure 181: Middle East & Africa Market Value (US$ Million) Analysis, 2017 to 2022

Figure 182: Middle East & Africa Market Value (US$ Million) Forecast, 2023 to 2033

Figure 183: Middle East & Africa Market Value Share, By Biomarker Type (2023 E)

Figure 184: Middle East & Africa Market Value Share, By Application (2023 E)

Figure 185: Middle East & Africa Market Value Share, by End User (2023 E)

Figure 186: Middle East & Africa Market Value Share, by Country (2023 E)

Figure 187: Middle East & Africa Market Attractiveness Analysis By Biomarker Type, 2023 to 2033

Figure 188: Middle East & Africa Market Attractiveness Analysis By Application, 2023 to 2033

Figure 189: Middle East & Africa Market Attractiveness Analysis by End User, 2023 to 2033

Figure 190: Middle East & Africa Market Attractiveness Analysis by Country, 2023 to 2033

Figure 191: GCC Countries Market Value Proportion Analysis, 2022

Figure 192: Global Vs GCC Countries Growth Comparison

Figure 193: GCC Countries Market Share Analysis (%) By Biomarker Type, 2023 & 2033

Figure 194: GCC Countries Market Share Analysis (%) By Application, 2023 & 2033

Figure 195: GCC Countries Market Share Analysis (%) by End User, 2023 & 2033

Figure 196: Türkiye Market Value Proportion Analysis, 2022

Figure 197: Global Vs. Türkiye Growth Comparison

Figure 198: Türkiye Market Share Analysis (%) By Biomarker Type, 2023 & 2033

Figure 199: Türkiye Market Share Analysis (%) By Application, 2023 & 2033

Figure 200: Türkiye Market Share Analysis (%) by End User, 2023 & 2033

Figure 201: South Africa Market Value Proportion Analysis, 2022

Figure 202: Global Vs. South Africa Growth Comparison

Figure 203: South Africa Market Share Analysis (%) By Biomarker Type, 2023 & 2033

Figure 204: South Africa Market Share Analysis (%) By Application, 2023 & 2033

Figure 205: South Africa Market Share Analysis (%) by End User, 2023 & 2033

Figure 206: Northern Africa Market Value Proportion Analysis, 2022

Figure 207: Global Vs Northern Africa Growth Comparison

Figure 208: Northern Africa Market Share Analysis (%) By Biomarker Type, 2023 & 2033

Figure 209: Northern Africa Market Share Analysis (%) By Application, 2023 & 2033

Figure 210: Northern Africa Market Share Analysis (%) by End User, 2023 & 2033

Explore Healthcare Insights

View Reports

Cognitive Impairment Biomarkers Market