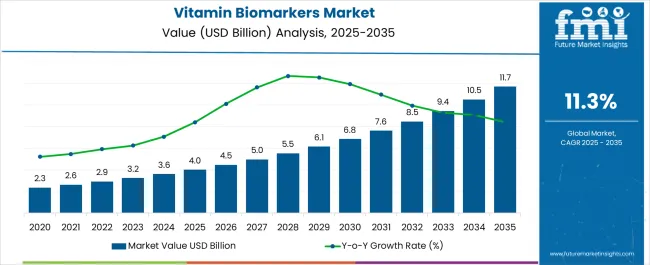
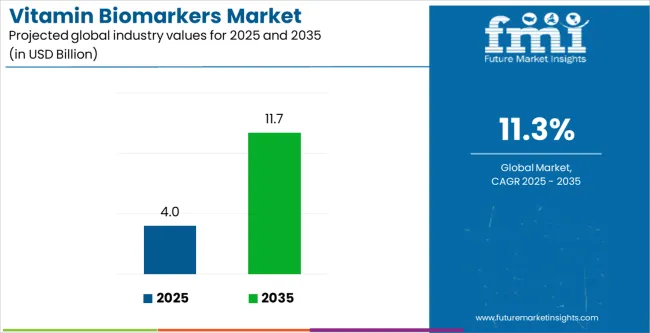
The vitamin biomarkers market size is projected to be worth USD 3.2 billion in 2023. The market is likely to surpass USD 9.8 billion by 2033 at a CAGR of 11.9% during the forecast period. The market for vitamin biomarkers has been experiencing significant growth and is expected to continue expanding.
The increasing prevalence of vitamin deficiency due to inadequate dietary intake, and the need for immediate and accurate diagnosis are the key drivers of this market growth. The market size is influenced by factors such as inadequate diet, lack of proteins in diet, malabsorption issues & even due to alcoholism & substance abuse.
In clinical diagnostics, vitamin biomarkers are used to identify deficiencies or excesses, monitor treatment efficacy, and guide dietary or supplementation interventions. The nutraceutical industry incorporates biomarkers to develop evidence-based products, while personalized medicine utilizes biomarkers for tailored interventions.
Other Drivers Propelling the Demand for Vitamin Biomarkers Market include:
Challenges for Companies /Manufacturers in the Vitamin Biomarkers Market:
Opportunities in the Vitamin Biomarkers Market Industry:
Latest Trends in the Vitamin Biomarkers Market:
Attributes | Details |
---|---|
Vitamin biomarkers Market Size (2023) | USD 3.2 billion |
Vitamin biomarkers Market Projected Size (2033) | USD 9.8 billion |
Value CAGR (2023 to 2033) | 11.9% |
From 2017 to 2022, the global vitamin biomarkers market experienced a CAGR of 12.2%, reaching a market size of USD 3.2 billion in 2023.
From 2017 to 2022, the global vitamin biomarkers industry witnessed significant growth as advancements in testing technologies have significantly contributed to the historic growth of the market.
There has been a shift in healthcare focus from reactive treatment to preventive care, emphasizing early detection and intervention. Vitamin biomarkers play a crucial role in identifying deficiencies at an early stage, allowing for timely interventions to prevent the onset of associated health issues, which has contributed to the growth of the market.
Future Forecast for Vitamin Biomarkers Market Industry:
Looking ahead, the global vitamin biomarkers market industry is expected to rise at a CAGR of 11.9% from 2023 to 2033. During the forecast period, the market size is expected to reach USD 9.8 billion by 2033.
The vitamin biomarkers industry is expected to continue its growth trajectory from 2023 to 2033, Emerging markets characterized by increasing disposable incomes, growing healthcare awareness, and improving healthcare infrastructure, present significant growth opportunities for the vitamin biomarkers market.
As these markets experience a shift towards preventive healthcare and personalized nutrition, the demand for biomarker-based assessments is expected to increase.
Ongoing research on the role of vitamins in health, advancements in understanding the mechanisms of vitamin metabolism, and the discovery of novel biomarkers will drive innovation and expand the range of biomarkers available for assessing vitamin status.
Country | The United States |
---|---|
Market Size (USD billion) by End of Forecast Period (2033) | USD 2.3 billion |
CAGR % 2023 to End of Forecast (2033) | 12.4% |
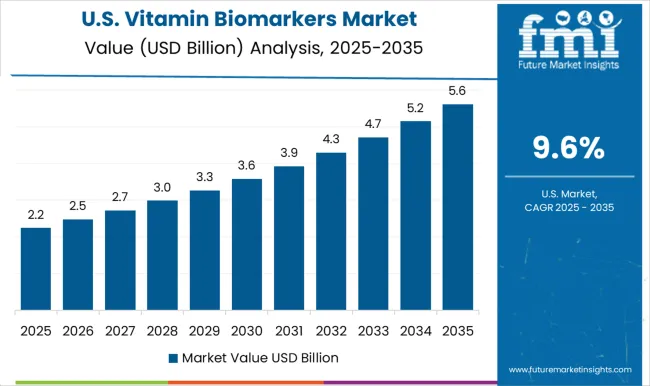
The vitamin biomarkers industry in the United States is expected to reach a market size of USD 2.3 billion by 2033, expanding at a CAGR of 12.4%. The opioid crisis remains a significant driver of the vitamin biomarkers market in the United States.
Association of Vit-D deficiency among patients consuming higher opioid dose for chronic pain is shown in various studies. There is a growing awareness and emphasis on maintaining optimal health and wellness among the population in the United States.
This driver motivates individuals to monitor their vitamin levels through biomarker testing to ensure they meet their nutritional needs and prevent deficiencies.
Country | The United Kingdom |
---|---|
Market Size (USD million) by End of Forecast Period (2033) | USD 303.1 million |
CAGR % 2023 to End of Forecast (2033) | 8.9% |
The vitamin biomarkers industry in the United Kingdom is expected to reach a market value of USD 303.1 million, expanding at a CAGR of 8.9% during the forecast period. Vitamin deficiencies, such as vitamin D, vitamin B12, and iron deficiencies, are common in the United Kingdom.
Factors such as poor dietary habits, limited sun exposure, vegetarian or vegan diets, and certain medical conditions contribute to the prevalence of these deficiencies. This drives the need for vitamin biomarker testing to identify and address deficiencies.
Country | China |
---|---|
Market Size (USD million) by End of Forecast Period (2033) | USD 902.4 million |
CAGR % 2023 to End of Forecast (2033) | 14.6% |
The vitamin biomarkers industry in China is anticipated to reach a market size of USD 902.4 million, moving at a CAGR of 14.6% during the forecast period. The Chinese government has implemented various initiatives and public health campaigns to address nutritional deficiencies and promote public health.
These initiatives raise awareness about the importance of vitamin intake and encourage individuals to monitor their vitamin levels through biomarker testing.
Country | Japan |
---|---|
Market Size (USD million) by End of Forecast Period (2033) | USD 612.8 million |
CAGR % 2023 to End of Forecast (2033) | 14.0% |
The vitamin biomarkers industry in Japan is estimated to reach a market size of USD 612.8 million by 2033, thriving at a CAGR of 14.0%. Japan is known for its technological advancements and integration of technology in healthcare.
This trend extends to the vitamin biomarkers market, where digital health solutions, wearable devices, and mobile apps are utilized for tracking nutrient intake, physical activity, and biomarker levels. Technology integration provides real-time feedback and personalized recommendations for optimizing vitamin status.
Country | South Korea |
---|---|
Market Size (USD million) by End of Forecast Period (2033) | USD 291.9 million |
CAGR % 2023 to End of Forecast (2033) | 12.9% |
The vitamin biomarkers industry in South Korea is expected to reach a market size of USD 291.9 million, expanding at a CAGR of 12.9% during the forecast period. South Korea has witnessed shifts in dietary patterns over the years, including an increased consumption of processed foods and a shift towards more Westernized diets.
These changes can contribute to vitamin deficiencies. Biomarker testing helps individuals and healthcare professionals identify and address nutrient gaps caused by these dietary shifts.
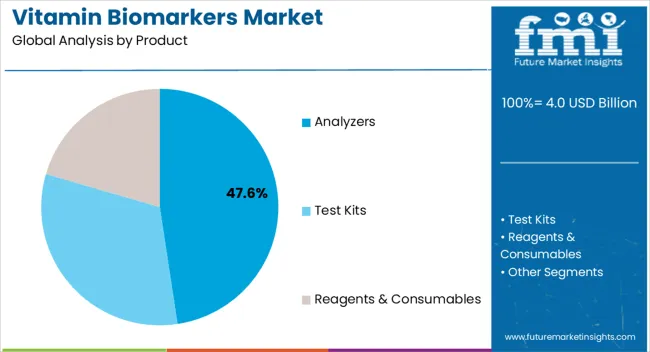
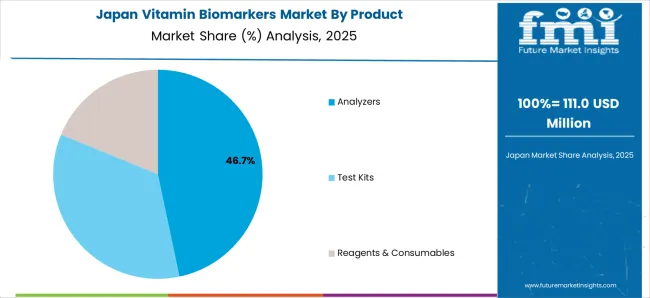
Analyzers are expected to dominate the vitamin biomarkers industry with a CAGR of 12.3% from 2023 to 2033. Analyzers used for vitamin biomarkers must possess high sensitivity and specificity to accurately detect and quantify low concentrations of biomarkers in complex biological samples.
The sensitivity of an analyzer determines its ability to detect even trace amounts of the biomarker, while specificity ensures that it measures only the target biomarker without interference from other compounds.
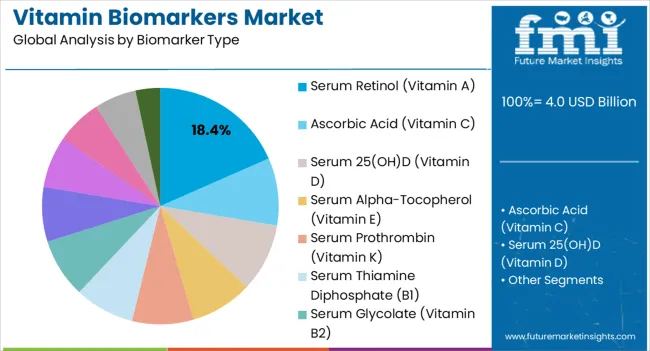
Serum 25(OH) D (Vitamin D) are expected to dominate the vitamin biomarkers industry with a CAGR of 13.8% from 2023 to 2033. Low serum 23 levels indicate vitamin D deficiency. Vitamin D deficiency is a significant public health concern in many parts of the world, particularly in developing countries.
Vitamin D deficiency can result in reduced bone density increasing risk factors like osteoporosis or even fractures. Vitamin D helps absorb and retain phosphorus and calcium in body.
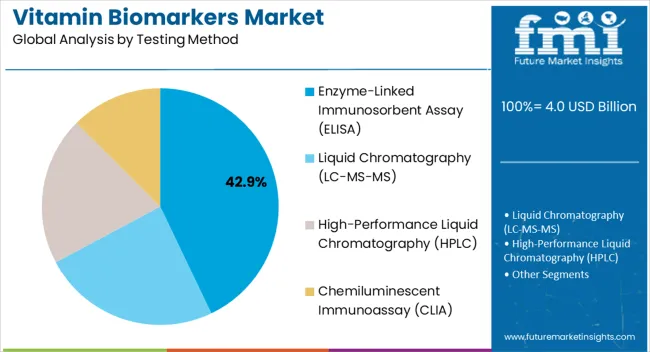
Enzyme-Linked Immunosorbent Assay (ELISA) are expected to dominate the vitamin biomarkers industry with a CAGR of 10.8% from 2023 to 2033. ELISA provides quantitative results, allowing for the precise measurement of vitamin biomarker levels in the sample.
Calibration curves are constructed using known concentrations of the vitamin biomarker, and the signal generated by the assay is compared to the calibration curve to determine the concentration of the vitamin in the sample.
Diagnostic Laboratories is expected to dominate the vitamin biomarkers industry with a CAGR of 13.3% from 2023 to 2033. Diagnostic laboratories are responsible for receiving and processing samples from individuals.
These samples may include blood, serum, plasma, urine, or other biological fluids that are collected for the measurement of vitamin biomarkers. Proper sample collection techniques are followed to ensure sample integrity and minimize pre-analytical errors. The laboratories employ validated and quality-controlled procedures to ensure accurate and reliable results.
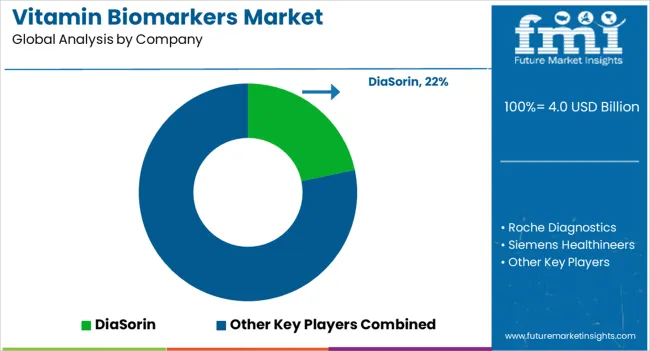
The vitamin biomarkers market is fiercely competitive, with many companies fighting for market dominance. To stay ahead of the competition in such a circumstance, essential players must develop effective conjugates.
Key Strategies Used by the Participants
Product Development
Companies are investing in research & development to deliver product that improve efficiency, dependability, and cost-effectiveness. Product innovation allows businesses to differentiate themselves from their competition while also catering to the changing demands of their clients.
Strategic Alliances & Collaborations
Key industry leaders frequently develop strategic partnerships and collaborations with other companies in order to harness their strengths and increase their market reach. Companies might also gain access to new technology and markets through such agreements.
Expansion into Emerging Markets
The vitamin biomarkers market is expanding rapidly in emerging regions such as China and India. Key firms are enhancing their distribution networks and developing local manufacturing facilities to increase their presence in these areas.
Acquisitions and mergers
Mergers and acquisitions are frequently used by key players in the vitamin biomarkers industry to consolidate their market position, extend their product range, and gain access to new markets.
Key Developments in the Vitamin Biomarkers Market:
Table 01: Global Market Value (US$ Million) Analysis and Forecast 2017 to 2033, By Region
Table 02A: Global Market Value (US$ Million) Analysis and Forecast 2017 to 2033, By Product
Table 02B: Global Market Volume (Units) Analysis and Forecast 2017 to 2033, By Product
Table 03: Global Market Value (US$ Million) Analysis and Forecast 2017 to 2033, By Biomarker Type
Table 04: Global Market Value (US$ Million) Analysis and Forecast 2017 to 2033, By Testing Method
Table 05: Global Market Value (US$ Million) Analysis and Forecast 2017 to 2033, by End User
Table 06: North America Market Value (US$ Million) Analysis 2017-2022 and Forecast 2023 to 2033, by Country
Table 07: North America Market Value (US$ Million) Analysis and Forecast 2017 to 2033, By Product
Table 08: North America Market Volume (Units) Analysis and Forecast 2017 to 2033, By Product
Table 09: North America Market Value (US$ Million) Analysis and Forecast 2017 to 2033, By Biomarker Type
Table 10: North America Market Value (US$ Million) Analysis and Forecast 2017 to 2033, By Testing Method
Table 11: North America Market Value (US$ Million) Analysis and Forecast 2017 to 2033, by End User
Table 12: Latin America Market Value (US$ Million) Analysis 2017-2022 and Forecast 2023 to 2033, by Country
Table 13: Latin America Market Value (US$ Million) Analysis and Forecast 2017 to 2033, By Product
Table 14: Latin America Market Volume (Units) Analysis and Forecast 2017 to 2033, By Product
Table 15: Latin America Market Value (US$ Million) Analysis and Forecast 2017 to 2033, By Biomarker Type
Table 16: Latin America Market Value (US$ Million) Analysis and Forecast 2017 to 2033, By Testing Method
Table 17: Latin America Market Value (US$ Million) Analysis and Forecast 2017 to 2033, by End User
Table 18: Europe Market Value (US$ Million) Analysis 2017-2022 and Forecast 2023 to 2033, by Country
Table 19: Europe Market Value (US$ Million) Analysis and Forecast 2017 to 2033, By Product
Table 20: Europe Market Volume (Units) Analysis and Forecast 2017 to 2033, By Product
Table 21: Europe Market Value (US$ Million) Analysis and Forecast 2017 to 2033, By Biomarker Type
Table 22: Europe Market Value (US$ Million) Analysis and Forecast 2017 to 2033, By Testing Method
Table 23: Europe Market Value (US$ Million) Analysis and Forecast 2017 to 2033, by End User
Table 24: South Asia Market Value (US$ Million) Analysis 2017-2022 and Forecast 2023 to 2033, by Country
Table 25: South Asia Market Value (US$ Million) Analysis and Forecast 2017 to 2033, By Product
Table 26: South Asia Market Volume (Units) Analysis and Forecast 2017 to 2033, By Product
Table 27: South Asia Market Value (US$ Million) Analysis and Forecast 2017 to 2033, By Biomarker Type
Table 28: South Asia Market Value (US$ Million) Analysis and Forecast 2017 to 2033, By Testing Method
Table 29: South Asia Market Value (US$ Million) Analysis and Forecast 2017 to 2033, by End User
Table 30: East Asia Market Value (US$ Million) Analysis 2017-2022 and Forecast 2023 to 2033, by Country
Table 31: East Asia Market Value (US$ Million) Analysis and Forecast 2017 to 2033, By Product
Table 32: East Asia Market Volume (Units) Analysis and Forecast 2017 to 2033, By Product
Table 33: East Asia Market Value (US$ Million) Analysis and Forecast 2017 to 2033, By Biomarker Type
Table 34: East Asia Market Value (US$ Million) Analysis and Forecast 2017 to 2033, By Testing Method
Table 35: East Asia Market Value (US$ Million) Analysis and Forecast 2017 to 2033, by End User
Table 36: Oceania Market Value (US$ Million) Analysis 2017-2022 and Forecast 2023 to 2033, by Country
Table 37: Oceania Market Value (US$ Million) Analysis and Forecast 2017 to 2033, By Product
Table 38: Oceania Market Volume (Units) Analysis and Forecast 2017 to 2033, By Product
Table 39: Oceania Market Value (US$ Million) Analysis and Forecast 2017 to 2033, By Biomarker Type
Table 40: Oceania Market Value (US$ Million) Analysis and Forecast 2017 to 2033, By Testing Method
Table 41: Oceania Market Value (US$ Million) Analysis and Forecast 2017 to 2033, by End User
Table 42: Middle East & Africa Market Value (US$ Million) Analysis 2017-2022 and Forecast 2023 to 2033, by Country
Table 43: Middle East & Africa Market Value (US$ Million) Analysis and Forecast 2017 to 2033, By Product
Table 44: Middle East & Africa Market Volume (Units) Analysis and Forecast 2017 to 2033, By Product
Table 45: Middle East & Africa Market Value (US$ Million) Analysis and Forecast 2017 to 2033, By Biomarker Type
Table 46: Middle East & Africa Market Value (US$ Million) Analysis and Forecast 2017 to 2033, By Testing Method
Table 47: Middle East & Africa Market Value (US$ Million) Analysis and Forecast 2017 to 2033, by End User
Figure 01: Global Market Volume (Units), 2017 to 2022
Figure 02: Global Market Volume (Units) & Y-o-Y Growth (%) Analysis,
Figure 03: Vitamin Biomarkers, Pricing Analysis per unit (US$), in 2022
Figure 04: Vitamin Biomarkers, Pricing Forecast per unit (US$), in 2033
Figure 05: Global Market Value (US$ Million) Analysis, 2017 to 2022
Figure 06: Global Market Forecast & Y-o-Y Growth, 2023 to 2033
Figure 07: Global Market Absolute $ Opportunity (US$ Million) Analysis, 2023 to 2033
Figure 08: Global Market Value Share (%) Analysis 2022 and 2033, By Product
Figure 09: Global Market Y-o-Y Growth (%) Analysis 2023 to 2033, By Product
Figure 10: Global Market Attractiveness Analysis 2023 to 2033, By Product
Figure 11: Global Market Value Share (%) Analysis 2022 and 2033, By Biomarker Type
Figure 12: Global Market Y-o-Y Growth (%) Analysis 2023 to 2033, By Biomarker Type
Figure 13: Global Market Attractiveness Analysis 2023 to 2033, By Biomarker Type
Figure 14: Global Market Value Share (%) Analysis 2022 and 2033, By Testing Method
Figure 15: Global Market Y-o-Y Growth (%) Analysis 2023 to 2033, By Testing Method
Figure 16: Global Market Attractiveness Analysis 2023 to 2033, By Testing Method
Figure 17: Global Market Value Share (%) Analysis 2022 and 2033, by End User
Figure 18: Global Market Y-o-Y Growth (%) Analysis 2023 to 2033, by End User
Figure 19: Global Market Attractiveness Analysis 2023 to 2033, by End User
Figure 20: Global Market Value Share (%) Analysis 2023 and 2033, by Region
Figure 21: Global Market Y-o-Y Growth (%) Analysis 2023 to 2033, by Region
Figure 22: Global Market Attractiveness Analysis 2023 to 2033, by Region
Figure 23: North America Market Value (US$ Million) Analysis, 2017 to 2022
Figure 24: North America Market Value (US$ Million) Forecast, 2022 to 2033
Figure 25: North America Market Value Share, By Product (2023 E)
Figure 26: North America Market Value Share, By Biomarker Type (2023 E)
Figure 27: North America Market Value Share, By Testing Method (2023 E)
Figure 28: North America Market Value Share, by End User (2023 E)
Figure 29: North America Market Value Share, by Country (2023 E)
Figure 30: North America Market Attractiveness Analysis By Product, 2023 to 2033
Figure 31: North America Market Attractiveness Analysis By Biomarker Type, 2023 to 2033
Figure 32: North America Market Attractiveness Analysis By Testing Method, 2023 to 2033
Figure 33: North America Market Attractiveness Analysis by End User, 2023 to 2033
Figure 34: North America Market Attractiveness Analysis by Country, 2023 to 2033
Figure 35: USA Market Value Proportion Analysis, 2023
Figure 36: Global Vs. USA Growth Comparison
Figure 37: USA Market Share Analysis (%) By Product, 2023 & 2033
Figure 38: USA Market Share Analysis (%) By Biomarker Type, 2023 & 2033
Figure 39: USA Market Share Analysis (%) By Testing Method, 2023 & 2033
Figure 40: USA Market Share Analysis (%) by End User, 2023 & 2033
Figure 41: Canada Market Value Proportion Analysis, 2023
Figure 42: Global Vs. Canada. Growth Comparison
Figure 43: Canada Market Share Analysis (%) By Product, 2023 & 2033
Figure 44: Canada Market Share Analysis (%) By Biomarker Type, 2023 & 2033
Figure 45: Canada Market Share Analysis (%) By Testing Method, 2023 & 2033
Figure 46: Canada Market Share Analysis (%) by End User, 2023 & 2033
Figure 47: Latin America Market Value (US$ Million) Analysis, 2017 to 2022
Figure 48: Latin America Market Value (US$ Million) Forecast, 2022 to 2033
Figure 49: Latin America Market Value Share, By Product (2023 E)
Figure 50: Latin America Market Value Share, By Biomarker Type (2023 E)
Figure 51: Latin America Market Value Share, By Testing Method (2023 E)
Figure 52: Latin America Market Value Share, by End User (2023 E)
Figure 53: Latin America Market Value Share, by Country (2023 E)
Figure 54: Latin America Market Attractiveness Analysis By Product, 2023 to 2033
Figure 55: Latin America Market Attractiveness Analysis By Biomarker Type, 2023 to 2033
Figure 56: Latin America Market Attractiveness Analysis By Testing Method, 2023 to 2033
Figure 57: Latin America Market Attractiveness Analysis by End User, 2023 to 2033
Figure 58: Latin America Market Attractiveness Analysis by Country, 2023 to 2033
Figure 59: Mexico Market Value Proportion Analysis, 2023
Figure 60: Global Vs Mexico Growth Comparison
Figure 61: Mexico Market Share Analysis (%) By Product, 2023 & 2033
Figure 62: Mexico Market Share Analysis (%) By Biomarker Type, 2023 & 2033
Figure 63: Mexico Market Share Analysis (%) By Testing Method, 2023 & 2033
Figure 64: Mexico Market Share Analysis (%) by End User, 2023 & 2033
Figure 65: Brazil Market Value Proportion Analysis, 2023
Figure 66: Global Vs. Brazil. Growth Comparison
Figure 67: Brazil Market Share Analysis (%) By Product, 2023 & 2033
Figure 68: Brazil Market Share Analysis (%) By Biomarker Type, 2023 & 2033
Figure 69: Brazil Market Share Analysis (%) By Testing Method, 2023 & 2033
Figure 70: Brazil Market Share Analysis (%) by End User, 2023 & 2033
Figure 71: Argentina Market Value Proportion Analysis, 2022
Figure 72: Global Vs Argentina Growth Comparison
Figure 73: Argentina Market Share Analysis (%) By Product, 2023 & 2033
Figure 74: Argentina Market Share Analysis (%) By Biomarker Type, 2023 & 2033
Figure 75: Argentina Market Share Analysis (%) By Testing Method, 2023 & 2033
Figure 76: Argentina Market Share Analysis (%) by End User, 2023 & 2033
Figure 77: Europe Market Value (US$ Million) Analysis, 2017 to 2022
Figure 78: Europe Market Value (US$ Million) Forecast, 2022 to 2033
Figure 79: Europe Market Value Share, By Product (2023 E)
Figure 80: Europe Market Value Share, By Biomarker Type (2023 E)
Figure 81: Europe Market Value Share, By Testing Method (2023 E)
Figure 82: Europe Market Value Share, by End User (2023 E)
Figure 83: Europe Market Value Share, by Country (2023 E)
Figure 84: Europe Market Attractiveness Analysis By Product, 2023 to 2033
Figure 85: Europe Market Attractiveness Analysis By Biomarker Type, 2023 to 2033
Figure 86: Europe Market Attractiveness Analysis By Testing Method, 2023 to 2033
Figure 87: Europe Market Attractiveness Analysis by End User, 2023 to 2033
Figure 88: Europe Market Attractiveness Analysis by Country, 2023 to 2033
Figure 89: UK Market Value Proportion Analysis, 2022
Figure 90: Global Vs. UK Growth Comparison
Figure 91: UK Market Share Analysis (%) By Product, 2023 & 2033
Figure 92: UK Market Share Analysis (%) By Biomarker Type, 2023 & 2033
Figure 93: UK Market Share Analysis (%) By Testing Method, 2023 & 2033
Figure 94: UK Market Share Analysis (%) by End User, 2023 & 2033
Figure 95: Germany Market Value Proportion Analysis, 2022
Figure 96: Global Vs. Germany Growth Comparison
Figure 97: Germany Market Share Analysis (%) By Product, 2023 & 2033
Figure 98: Germany Market Share Analysis (%) By Biomarker Type, 2023 & 2033
Figure 99: Germany Market Share Analysis (%) By Testing Method, 2023 & 2033
Figure 100: Germany Market Share Analysis (%) by End User, 2023 & 2033
Figure 101: Italy Market Value Proportion Analysis, 2022
Figure 102: Global Vs. Italy Growth Comparison
Figure 103: Italy Market Share Analysis (%) By Product, 2023 & 2033
Figure 104: Italy Market Share Analysis (%) By Biomarker Type, 2023 & 2033
Figure 105: Italy Market Share Analysis (%) By Testing Method, 2023 & 2033
Figure 106: Italy Market Share Analysis (%) by End User, 2023 & 2033
Figure 107: France Market Value Proportion Analysis, 2022
Figure 108: Global Vs France Growth Comparison
Figure 109: France Market Share Analysis (%) By Product, 2023 & 2033
Figure 110: France Market Share Analysis (%) By Biomarker Type, 2023 & 2033
Figure 111: France Market Share Analysis (%) By Testing Method, 2023 & 2033
Figure 112: France Market Share Analysis (%) by End User, 2023 & 2033
Figure 113: Spain Market Value Proportion Analysis, 2022
Figure 114: Global Vs Spain Growth Comparison
Figure 115: Spain Market Share Analysis (%) By Product, 2023 & 2033
Figure 116: Spain Market Share Analysis (%) By Biomarker Type, 2023 & 2033
Figure 117: Spain Market Share Analysis (%) By Testing Method, 2023 & 2033
Figure 118: Spain Market Share Analysis (%) by End User, 2023 & 2033
Figure 119: Russia Market Value Proportion Analysis, 2022
Figure 120: Global Vs Russia Growth Comparison
Figure 121: Russia Market Share Analysis (%) By Product, 2023 & 2033
Figure 122: Russia Market Share Analysis (%) By Biomarker Type, 2023 & 2033
Figure 123: Russia Market Share Analysis (%) By Testing Method, 2023 & 2033
Figure 124: Russia Market Share Analysis (%) by End User, 2023 & 2033
Figure 125: BENELUX Market Value Proportion Analysis, 2022
Figure 126: Global Vs BENELUX Growth Comparison
Figure 127: BENELUX Market Share Analysis (%) By Product, 2023 & 2033
Figure 128: BENELUX Market Share Analysis (%) By Biomarker Type, 2023 & 2033
Figure 129: BENELUX Market Share Analysis (%) By Testing Method, 2023 & 2033
Figure 130: BENELUX Market Share Analysis (%) by End User, 2023 & 2033
Figure 131: East Asia Market Value (US$ Million) Analysis, 2017 to 2022
Figure 132: East Asia Market Value (US$ Million) Forecast, 2022 to 2033
Figure 133: East Asia Market Value Share, By Product (2023 E)
Figure 134: East Asia Market Value Share, By Biomarker Type (2023 E)
Figure 135: East Asia Market Value Share, By Testing Method (2023 E)
Figure 136: East Asia Market Value Share, by End User (2023 E)
Figure 137: East Asia Market Value Share, by Country (2023 E)
Figure 138: East Asia Market Attractiveness Analysis By Product, 2023 to 2033
Figure 139: East Asia Market Attractiveness Analysis By Biomarker Type, 2023 to 2033
Figure 140: East Asia Market Attractiveness Analysis By Testing Method, 2023 to 2033
Figure 141: East Asia Market Attractiveness Analysis by End User, 2023 to 2033
Figure 142: East Asia Market Attractiveness Analysis by Country, 2023 to 2033
Figure 143: China Market Value Proportion Analysis, 2022
Figure 144: Global Vs. China Growth Comparison
Figure 145: China Market Share Analysis (%) By Product, 2023 & 2033
Figure 146: China Market Share Analysis (%) By Biomarker Type, 2023 & 2033
Figure 147: China Market Share Analysis (%) By Testing Method, 2023 & 2033
Figure 148: China Market Share Analysis (%) by End User, 2023 & 2033
Figure 149: Japan Market Value Proportion Analysis, 2022
Figure 150: Global Vs. Japan Growth Comparison
Figure 151: Japan Market Share Analysis (%) By Product, 2023 & 2033
Figure 152: Japan Market Share Analysis (%) By Biomarker Type, 2023 & 2033
Figure 153: Japan Market Share Analysis (%) By Testing Method, 2023 & 2033
Figure 154: Japan Market Share Analysis (%) by End User, 2023 & 2033
Figure 155: South Korea Market Value Proportion Analysis, 2022
Figure 156: Global Vs South Korea Growth Comparison
Figure 157: South Korea Market Share Analysis (%) By Product, 2023 & 2033
Figure 158: South Korea Market Share Analysis (%) By Biomarker Type, 2023 & 2033
Figure 159: South Korea Market Share Analysis (%) By Testing Method, 2023 & 2033
Figure 160: South Korea Market Share Analysis (%) by End User, 2023 & 2033
Figure 161: South Asia Market Value (US$ Million) Analysis, 2017 to 2022
Figure 162: South Asia Market Value (US$ Million) Forecast, 2022 to 2033
Figure 163: South Asia Market Value Share, By Product (2023 E)
Figure 164: South Asia Market Value Share, By Biomarker Type (2023 E)
Figure 165: South Asia Market Value Share, By Testing Method (2023 E)
Figure 166: South Asia Market Value Share, by End User (2023 E)
Figure 167: South Asia Market Value Share, by Country (2023 E)
Figure 168: South Asia Market Attractiveness Analysis By Product, 2023 to 2033
Figure 169: South Asia Market Attractiveness Analysis By Biomarker Type, 2023 to 2033
Figure 170: South Asia Market Attractiveness Analysis By Testing Method, 2023 to 2033
Figure 171: South Asia Market Attractiveness Analysis by End User, 2023 to 2033
Figure 172: South Asia Market Attractiveness Analysis by Country, 2023 to 2033
Figure 173: India Market Value Proportion Analysis, 2022
Figure 174: Global Vs. India Growth Comparison
Figure 175: India Market Share Analysis (%) By Product, 2023 & 2033
Figure 176: India Market Share Analysis (%) By Biomarker Type, 2023 & 2033
Figure 177: India Market Share Analysis (%) By Testing Method, 2023 & 2033
Figure 178: India Market Share Analysis (%) by End User, 2023 & 2033
Figure 179: Indonesia Market Value Proportion Analysis, 2022
Figure 180: Global Vs. Indonesia Growth Comparison
Figure 181: Indonesia Market Share Analysis (%) By Product, 2023 & 2033
Figure 182: Indonesia Market Share Analysis (%) By Biomarker Type, 2023 & 2033
Figure 183: Indonesia Market Share Analysis (%) By Testing Method, 2023 & 2033
Figure 184: Indonesia Market Share Analysis (%) by End User, 2023 & 2033
Figure 185: Malaysia Market Value Proportion Analysis, 2022
Figure 186: Global Vs. Malaysia Growth Comparison
Figure 187: Malaysia Market Share Analysis (%) By Product, 2023 & 2033
Figure 188: Malaysia Market Share Analysis (%) By Biomarker Type, 2023 & 2033
Figure 189: Malaysia Market Share Analysis (%) By Testing Method, 2023 & 2033
Figure 190: Malaysia Market Share Analysis (%) by End User, 2023 & 2033
Figure 191: Thailand Market Value Proportion Analysis, 2022
Figure 192: Global Vs. Thailand Growth Comparison
Figure 193: Thailand Market Share Analysis (%) By Product, 2023 & 2033
Figure 194: Thailand Market Share Analysis (%) By Biomarker Type, 2023 & 2033
Figure 195: Thailand Market Share Analysis (%) By Testing Method, 2023 & 2033
Figure 196: Thailand Market Share Analysis (%) by End User, 2023 & 2033
Figure 197: Oceania Market Value (US$ Million) Analysis, 2017 to 2022
Figure 198: Oceania Market Value (US$ Million) Forecast, 2022 to 2033
Figure 199: Oceania Market Value Share, By Product (2023 E)
Figure 200: Oceania Market Value Share, By Biomarker Type (2023 E)
Figure 201: Oceania Market Value Share, By Testing Method (2023 E)
Figure 202: Oceania Market Value Share, by End User (2023 E)
Figure 203: Oceania Market Value Share, by Country (2023 E)
Figure 204: Oceania Market Attractiveness Analysis By Product, 2023 to 2033
Figure 205: Oceania Market Attractiveness Analysis By Biomarker Type, 2023 to 2033
Figure 206: Oceania Market Attractiveness Analysis By Testing Method, 2023 to 2033
Figure 207: Oceania Market Attractiveness Analysis by End User, 2023 to 2033
Figure 208: Oceania Market Attractiveness Analysis by Country, 2023 to 2033
Figure 209: Australia Market Value Proportion Analysis, 2022
Figure 210: Global Vs. Australia Growth Comparison
Figure 211: Australia Market Share Analysis (%) By Product, 2023 & 2033
Figure 212: Australia Market Share Analysis (%) By Biomarker Type, 2023 & 2033
Figure 213: Australia Market Share Analysis (%) By Testing Method, 2023 & 2033
Figure 214: Australia Market Share Analysis (%) by End User, 2023 & 2033
Figure 215: New Zealand Market Value Proportion Analysis, 2022
Figure 216: Global Vs New Zealand Growth Comparison
Figure 217: New Zealand Market Share Analysis (%) By Product, 2023 & 2033
Figure 218: New Zealand Market Share Analysis (%) By Biomarker Type, 2023 & 2033
Figure 219: New Zealand Market Share Analysis (%) By Testing Method, 2023 & 2033
Figure 220: New Zealand Market Share Analysis (%) by End User, 2023 & 2033
Figure 221: Middle East & Africa Market Value (US$ Million) Analysis, 2017 to 2022
Figure 222: Middle East & Africa Market Value (US$ Million) Forecast, 2022 to 2033
Figure 223: Middle East & Africa Market Value Share, By Product (2023 E)
Figure 224: Middle East & Africa Market Value Share, By Biomarker Type (2023 E)
Figure 225: Middle East & Africa Market Value Share, By Testing Method (2023 E)
Figure 226: Middle East & Africa Market Value Share, by End User (2023 E)
Figure 227: Middle East & Africa Market Value Share, by Country (2023 E)
Figure 228: Middle East & Africa Market Attractiveness Analysis By Product, 2023 to 2033
Figure 229: Middle East & Africa Market Attractiveness Analysis By Biomarker Type, 2023 to 2033
Figure 230: Middle East & Africa Market Attractiveness Analysis By Testing Method, 2023 to 2033
Figure 231: Middle East & Africa Market Attractiveness Analysis by End User, 2023 to 2033
Figure 232: Middle East & Africa Market Attractiveness Analysis by Country, 2023 to 2033
Figure 233: GCC Countries Market Value Proportion Analysis, 2022
Figure 234: Global Vs GCC Countries Growth Comparison
Figure 235: GCC Countries Market Share Analysis (%) By Product, 2023 & 2033
Figure 236: GCC Countries Market Share Analysis (%) By Biomarker Type, 2023 & 2033
Figure 237: GCC Countries Market Share Analysis (%) By Testing Method, 2023 & 2033
Figure 238: GCC Countries Market Share Analysis (%) by End User, 2023 & 2033
Figure 239: Türkiye Market Value Proportion Analysis, 2022
Figure 240: Global Vs. Türkiye Growth Comparison
Figure 241: Türkiye Market Share Analysis (%) By Product, 2023 & 2033
Figure 242: Türkiye Market Share Analysis (%) By Biomarker Type, 2023 & 2033
Figure 243: Türkiye Market Share Analysis (%) By Testing Method, 2023 & 2033
Figure 244: Türkiye Market Share Analysis (%) by End User, 2023 & 2033
Figure 245: South Africa Market Value Proportion Analysis, 2022
Figure 246: Global Vs. South Africa Growth Comparison
Figure 247: South Africa Market Share Analysis (%) By Product, 2023 & 2033
Figure 248: South Africa Market Share Analysis (%) By Biomarker Type, 2023 & 2033
Figure 249: South Africa Market Share Analysis (%) By Testing Method, 2023 & 2033
Figure 250: South Africa Market Share Analysis (%) by End User, 2023 & 2033
Figure 251: Northern Africa Market Value Proportion Analysis, 2022
Figure 252: Global Vs Northern Africa Growth Comparison
Figure 253: Northern Africa Market Share Analysis (%) By Product, 2023 & 2033
Figure 254: Northern Africa Market Share Analysis (%) By Biomarker Type, 2023 & 2033
Figure 255: Northern Africa Market Share Analysis (%) By Testing Method, 2023 & 2033
Figure 256: Northern Africa Market Share Analysis (%) by End User, 2023 & 2033
The global vitamin biomarkers industry is expected to hit a value of USD 3.2 billion by 2023.
The vitamin biomarkers Market demand is set to expand by 11.9% during the assessment period.
Analyzers with an CAGR of 12.3% is projected to hold the dominant share of the market.
The market is predicted to exceed USD 9.8 billion by 2033.
The United States offers key opportunities for new entrants in the vitamin biomarkers industry.
Explore In-vitro Diagnostics Devices Insights
Thank you!
You will receive an email from our Business Development Manager. Please be sure to check your SPAM/JUNK folder too.