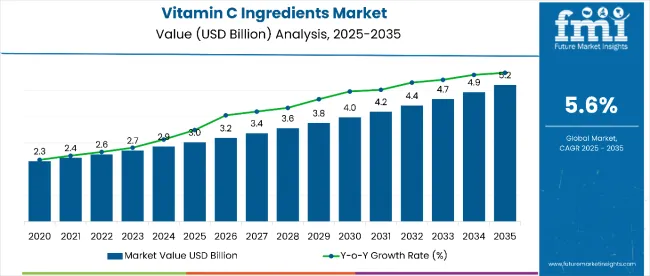
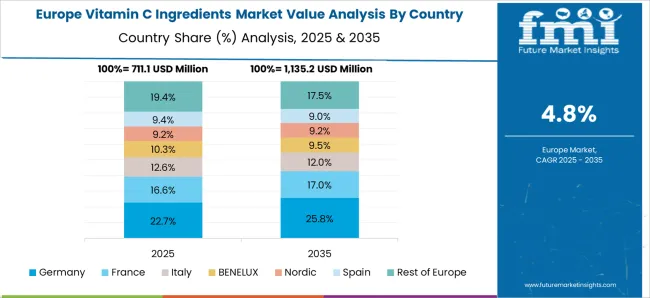
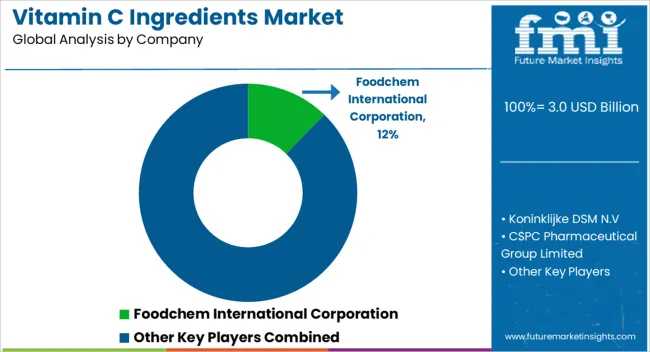
The global vitamin C ingredients market is expected to reach a market valuation of USD 4,657.5 million by the year 2033, accelerating with a CAGR of 5.6% from 2023 to 2033. As the inclination toward natural foods continues to rise, the market for vitamin C ingredients is poised to grow.
The demand for vitamin C-infused products has skyrocketed as consumers try to boost their immunity and prevent common illnesses. Vitamin C is widely used in immune-boosting products due to its powerful antioxidant properties and ability to stimulate white blood cell production.
A positive outlook for the market is further enhanced by the increasing demand for nutrient-dense and functional foods in the market. The benefits of vitamins are broad-ranging, including aiding in growth, digestion, and functioning effectively.
Cardiovascular illnesses account for 17.9 million deaths worldwide each year, according to the WHO. As awareness of various anticancer properties grows, the demand for vitamin C ingredients in various supplements is likely to increase.
New sources of vitamin C might be discovered in the future, as well as novel delivery systems and synthetic derivatives that enhance bioavailability or target specific organs. Genetically modified plants that produce higher levels of vitamin C may also be developed with advances in biotechnology and gene engineering.
Attributes | Key Statistics |
---|---|
Vitamin C Ingredients Market Size (2022) | 2,600 million |
Vitamin C Ingredients Estimated Market Size (2023) | 2,704 million |
Market Projected Size (2033) | 4,657.5 million |
Value CAGR (2023 to 2033) | 5.6% |
FMI analysis indicates that the vitamin C ingredients market will witness moderate growth over the forecast period owing to a shift in public perception of health and fitness, as well as consumer demand for well-balanced diets As a result, incorporating vitamin supplementation in one's daily diet has become standard to make up for any deficiencies.
Major manufacturers all around the world recognize the growing importance of vitamin C compounds in cosmetics and personal care products. Asia Pacific is forecast to have the fastest growth rate for vitamin C components.
There is a rapid expansion of the vitamin C market in this region due to several factors, including an increasingly large consumer base, an increase in disposable income, and greater public awareness regarding its potential health benefits.
While North America is expected to be the largest market during the projected period, Europe is expected to follow closely behind.
As a result of the high demand for vitamin supplements, the growing market for cosmetics that contain vitamin C, and the many players operating in this region, North America accounts for a significant share of the global vitamin C market. A changing cost of raw materials will constrain the market expansion of vitamin C ingredients.
Historically the vitamin C ingredient market witnessed a modest growth of around 2.4%. This was due to the fact that the Covid-19 pandemic had a beneficial impact on market growth due to the necessity for vitamin C in the development of individual immunity. It was also used to treat people with minor Covid-19 symptoms.
In addition, people were more likely to take vitamin C supplements in order to stay fit and build their immunity in order to avoid being infected by the virus.
Due to increased demand for clean-label food and beverage goods, the market has seen a paradigm shift in recent years, resulting in the development of many producers supplying clean-label vitamin C products to customers demanding antioxidants to support immune health.
Studies have indicated that vitamin C ingredients may play a role in the treatment of arterial hypertension, atherosclerosis, and cancer when administered in high doses. Patients with cancer have reported improved quality of life after receiving it.
As a result, the pharmaceutical and healthcare industries' demand for the product has soared. Thus, in the forecast period, the vitamin C ingredient market is anticipated to be growing at a CAGR of 5.6%.
The demand for fortified food and beverage has increased as the number of health-conscious people has increased. Consumers in developed and emerging countries, such as the United States, Germany, China, and India, are increasingly turning to nutrient-based and other goods containing functional ingredients to help prevent sickness or treat current health problems.
As a result, companies have begun to include vitamin C in their products in response to consumer demand for fortified foods and beverages. Furthermore, multiple government initiatives are being implemented to increase the supply of fortified food and beverages, particularly in developing countries.
For example, the Ministry of Health in China promotes the consumption of fortified food, owing to the rising health issues relating to age, myopia, and other diseases, which drive the demand for vitamin C ingredients.
The growing awareness of the need for high-quality, nutritious food is leading consumers to follow healthy eating plans. As millennials are interested in food, they strive to find high-quality products that are flavorful and nutrient-dense without sacrificing quality. Adding Vitamin C to foods enhances their flavor and provides significant nutritional benefits.
In recent decades, the popularity of dietary supplements containing vitamin C has increased due to the high prevalence of diseases such as cardiovascular disease and hypertension. Furthermore, vitamin C supplements are believed to enhance immune function by lowering these risks.
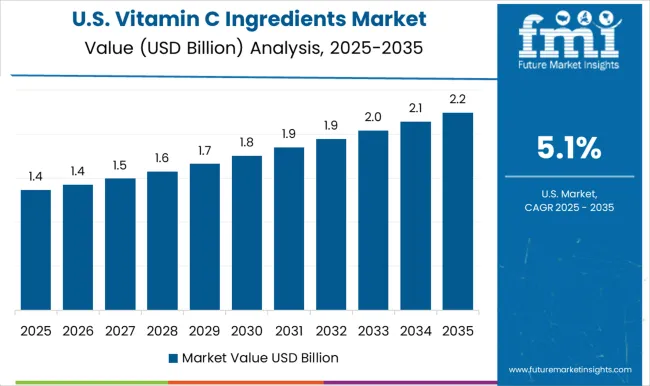
The United States has the highest obesity rate among other health disorders because of the country's increased intake of fatty foods and sugar-sweetened beverages. As a result, people are looking for healthier lifestyle solutions and other products that can help them avoid health-related problems. In 2022, the market held a share of 22.8% for the vitamin C ingredient market.
Furthermore, a considerable portion of the population is prescribed one of the following diet patterns: low-sodium, low fat, low-sugar, dairy-free, low-carb, and gluten-free. A large number of people choose vitamin C-rich nutrition to supplement their lack of nutritional value and to avoid dietary disorders.
The consumption of vitamin C components in East Asian countries, particularly China, is predicted to expand at a quicker rate because of the countries' cost-effective manufacturing facilities.
As a result, producers have been able to break into the functional food and beverage market with unique bioactive ingredients like ascorbic acid. In 2022, the country registered a growth rate of 7.9% in the vitamin C ingredient market.
Over the forecast period, the increased demand for health and dietary supplements in the region is expected to fuel market expansion. In addition, severe micronutrient shortages such as vitamins A, iodine, folate, iron, and zinc are common in China, making it a lucrative market for vitamin C manufacturers and suppliers worldwide.
The country is seeing an increase in personal disposable income, which, along with favorable government policies, is driving up demand. In addition, China's pharmaceutical industry is booming, which is driving up demand for vitamin C ingredients.
In Italy, there is a high level of awareness about dietary supplements, with 52% of adults using vitamins or mineral supplements. Furthermore, the expanding elderly population has fueled demand for vitamin C components, which are thought to aid in the prevention or treatment of several illnesses.
Furthermore, since the outbreak of the COVID-19 pandemic, people in the country have been resorting to supplements as a preventative strategy and to maintain their health. As a result, sales of dietary supplements such as vitamin C are expected to increase over the forecast period.
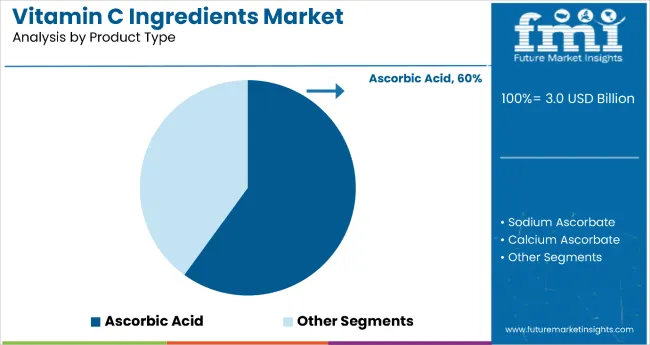
Sodium ascorbate is anticipated to be one of the most demanded vitamin C ingredients globally owing to its use as a reducing agent with high antioxidant qualities. The antioxidant diet supplement market generates a large amount of demand for sodium ascorbate.
The demand will continue to rise due to large investments and cutting-edge research and development by key industry players, as well as quick adoption in the pharmaceutical and medical industries.
However, the global sodium ascorbate market is constrained by a number of factors. Some of the limitations are connected to the supply of raw materials for the manufacturing process. Because production is strongly reliant on the availability of raw materials, raw material uncertainty, and foreign price changes may have a negative impact on the global market.
The market for Sodium Ascorbate is predominantly centered in East Asia, with Europe and North America following closely after. In addition, in the future decade, the region is expected to be the fastest-rising market.
The growth in demand is attributed to an increase in the number of people interested in fitness, and as a result, consumption of gym and nutritional supplements containing Sodium Ascorbate is increasing.
Currently, synthetic vitamin C ingredients are leading the market as they are easily available and at the same time are cost-effective. However, in the near future, the market is set to witness a shift in demand for more naturally sourced vitamin C ingredients owing to the rising focus of consumers on a sustainable and healthy lifestyle, which is likely to tip the scale toward natural vitamin C ingredients.
Manufacturers of vitamin C ingredients are aiming to broaden their reach by introducing new products, forming strategic relationships with existing companies, and purchasing small-scale producers in promising locations.
Furthermore, manufacturers have been experimenting with the application procedure in order to produce vitamin C-enriched products.
Attributes | Details |
---|---|
Market Size Value in 2023 | USD 2,704 million |
Market Forecast Value in 2033 | USD 4,657.5 million |
Global Growth Rate | 5.6% CAGR |
Forecast Period | 2023 to 2033 |
Historical Data Available for | 2018 to 2022 |
Market Analysis | USD million for Value |
Key Regions Covered | North America; Latin America; Western Europe; Eastern Europe; South Asia & Pacific; East Asia; Middle East & Africa |
Key Countries Covered | United States, Canada, Brazil, Mexico, Germany, United Kingdom, France, Spain, Italy, Russia, Poland, Czech, Republic, Romania, China, Japan, South Korea, India, Bangladesh, Australia, New Zealand, GCC countries, South Africa, Israel |
Kay Segments Covered | Product Type, Form, Source, Process, End Use, Region |
Key Companies Profiles | Foodchem International Corporation; Koninklijke DSM N.V; CSPC Pharmaceutical Group Limited; Northeast Pharmaceutical Group Co., Ltd; North China Pharmaceutical Co., Ltd; The TNN Development Limited; Microbelcaps; Hangzhou Focus Corporation; Beijing Heronsbill Food Material Co.,Ltd; Triveni Interchem Pvt. Ltd.; China BBCA Group Corporation |
Customization & Pricing | Available upon Request |
Table 1: Global Market Value (US$ Million) Forecast by Region, 2018 to 2033
Table 2: Global Market Volume (MT) Forecast by Region, 2018 to 2033
Table 3: Global Market Value (US$ Million) Forecast by Product Type, 2018 to 2033
Table 4: Global Market Volume (MT) Forecast by Product Type, 2018 to 2033
Table 5: Global Market Value (US$ Million) Forecast by Form, 2018 to 2033
Table 6: Global Market Volume (MT) Forecast by Form, 2018 to 2033
Table 7: Global Market Value (US$ Million) Forecast by Source, 2018 to 2033
Table 8: Global Market Volume (MT) Forecast by Source, 2018 to 2033
Table 9: Global Market Value (US$ Million) Forecast by Process, 2018 to 2033
Table 10: Global Market Volume (MT) Forecast by Process, 2018 to 2033
Table 11: Global Market Value (US$ Million) Forecast by End Use, 2018 to 2033
Table 12: Global Market Volume (MT) Forecast by End Use, 2018 to 2033
Table 13: North America Market Value (US$ Million) Forecast by Country, 2018 to 2033
Table 14: North America Market Volume (MT) Forecast by Country, 2018 to 2033
Table 15: North America Market Value (US$ Million) Forecast by Product Type, 2018 to 2033
Table 16: North America Market Volume (MT) Forecast by Product Type, 2018 to 2033
Table 17: North America Market Value (US$ Million) Forecast by Form, 2018 to 2033
Table 18: North America Market Volume (MT) Forecast by Form, 2018 to 2033
Table 19: North America Market Value (US$ Million) Forecast by Source, 2018 to 2033
Table 20: North America Market Volume (MT) Forecast by Source, 2018 to 2033
Table 21: North America Market Value (US$ Million) Forecast by Process, 2018 to 2033
Table 22: North America Market Volume (MT) Forecast by Process, 2018 to 2033
Table 23: North America Market Value (US$ Million) Forecast by End Use, 2018 to 2033
Table 24: North America Market Volume (MT) Forecast by End Use, 2018 to 2033
Table 25: Latin America Market Value (US$ Million) Forecast by Country, 2018 to 2033
Table 26: Latin America Market Volume (MT) Forecast by Country, 2018 to 2033
Table 27: Latin America Market Value (US$ Million) Forecast by Product Type, 2018 to 2033
Table 28: Latin America Market Volume (MT) Forecast by Product Type, 2018 to 2033
Table 29: Latin America Market Value (US$ Million) Forecast by Form, 2018 to 2033
Table 30: Latin America Market Volume (MT) Forecast by Form, 2018 to 2033
Table 31: Latin America Market Value (US$ Million) Forecast by Source, 2018 to 2033
Table 32: Latin America Market Volume (MT) Forecast by Source, 2018 to 2033
Table 33: Latin America Market Value (US$ Million) Forecast by Process, 2018 to 2033
Table 34: Latin America Market Volume (MT) Forecast by Process, 2018 to 2033
Table 35: Latin America Market Value (US$ Million) Forecast by End Use, 2018 to 2033
Table 36: Latin America Market Volume (MT) Forecast by End Use, 2018 to 2033
Table 37: Western Europe Market Value (US$ Million) Forecast by Country, 2018 to 2033
Table 38: Western Europe Market Volume (MT) Forecast by Country, 2018 to 2033
Table 39: Western Europe Market Value (US$ Million) Forecast by Product Type, 2018 to 2033
Table 40: Western Europe Market Volume (MT) Forecast by Product Type, 2018 to 2033
Table 41: Western Europe Market Value (US$ Million) Forecast by Form, 2018 to 2033
Table 42: Western Europe Market Volume (MT) Forecast by Form, 2018 to 2033
Table 43: Western Europe Market Value (US$ Million) Forecast by Source, 2018 to 2033
Table 44: Western Europe Market Volume (MT) Forecast by Source, 2018 to 2033
Table 45: Western Europe Market Value (US$ Million) Forecast by Process, 2018 to 2033
Table 46: Western Europe Market Volume (MT) Forecast by Process, 2018 to 2033
Table 47: Western Europe Market Value (US$ Million) Forecast by End Use, 2018 to 2033
Table 48: Western Europe Market Volume (MT) Forecast by End Use, 2018 to 2033
Table 49: Eastern Europe Market Value (US$ Million) Forecast by Country, 2018 to 2033
Table 50: Eastern Europe Market Volume (MT) Forecast by Country, 2018 to 2033
Table 51: Eastern Europe Market Value (US$ Million) Forecast by Product Type, 2018 to 2033
Table 52: Eastern Europe Market Volume (MT) Forecast by Product Type, 2018 to 2033
Table 53: Eastern Europe Market Value (US$ Million) Forecast by Form, 2018 to 2033
Table 54: Eastern Europe Market Volume (MT) Forecast by Form, 2018 to 2033
Table 55: Eastern Europe Market Value (US$ Million) Forecast by Source, 2018 to 2033
Table 56: Eastern Europe Market Volume (MT) Forecast by Source, 2018 to 2033
Table 57: Eastern Europe Market Value (US$ Million) Forecast by Process, 2018 to 2033
Table 58: Eastern Europe Market Volume (MT) Forecast by Process, 2018 to 2033
Table 59: Eastern Europe Market Value (US$ Million) Forecast by End Use, 2018 to 2033
Table 60: Eastern Europe Market Volume (MT) Forecast by End Use, 2018 to 2033
Table 61: South Asia and Pacific Market Value (US$ Million) Forecast by Country, 2018 to 2033
Table 62: South Asia and Pacific Market Volume (MT) Forecast by Country, 2018 to 2033
Table 63: South Asia and Pacific Market Value (US$ Million) Forecast by Product Type, 2018 to 2033
Table 64: South Asia and Pacific Market Volume (MT) Forecast by Product Type, 2018 to 2033
Table 65: South Asia and Pacific Market Value (US$ Million) Forecast by Form, 2018 to 2033
Table 66: South Asia and Pacific Market Volume (MT) Forecast by Form, 2018 to 2033
Table 67: South Asia and Pacific Market Value (US$ Million) Forecast by Source, 2018 to 2033
Table 68: South Asia and Pacific Market Volume (MT) Forecast by Source, 2018 to 2033
Table 69: South Asia and Pacific Market Value (US$ Million) Forecast by Process, 2018 to 2033
Table 70: South Asia and Pacific Market Volume (MT) Forecast by Process, 2018 to 2033
Table 71: South Asia and Pacific Market Value (US$ Million) Forecast by End Use, 2018 to 2033
Table 72: South Asia and Pacific Market Volume (MT) Forecast by End Use, 2018 to 2033
Table 73: East Asia Market Value (US$ Million) Forecast by Country, 2018 to 2033
Table 74: East Asia Market Volume (MT) Forecast by Country, 2018 to 2033
Table 75: East Asia Market Value (US$ Million) Forecast by Product Type, 2018 to 2033
Table 76: East Asia Market Volume (MT) Forecast by Product Type, 2018 to 2033
Table 77: East Asia Market Value (US$ Million) Forecast by Form, 2018 to 2033
Table 78: East Asia Market Volume (MT) Forecast by Form, 2018 to 2033
Table 79: East Asia Market Value (US$ Million) Forecast by Source, 2018 to 2033
Table 80: East Asia Market Volume (MT) Forecast by Source, 2018 to 2033
Table 81: East Asia Market Value (US$ Million) Forecast by Process, 2018 to 2033
Table 82: East Asia Market Volume (MT) Forecast by Process, 2018 to 2033
Table 83: East Asia Market Value (US$ Million) Forecast by End Use, 2018 to 2033
Table 84: East Asia Market Volume (MT) Forecast by End Use, 2018 to 2033
Table 85: Middle East and Africa Market Value (US$ Million) Forecast by Country, 2018 to 2033
Table 86: Middle East and Africa Market Volume (MT) Forecast by Country, 2018 to 2033
Table 87: Middle East and Africa Market Value (US$ Million) Forecast by Product Type, 2018 to 2033
Table 88: Middle East and Africa Market Volume (MT) Forecast by Product Type, 2018 to 2033
Table 89: Middle East and Africa Market Value (US$ Million) Forecast by Form, 2018 to 2033
Table 90: Middle East and Africa Market Volume (MT) Forecast by Form, 2018 to 2033
Table 91: Middle East and Africa Market Value (US$ Million) Forecast by Source, 2018 to 2033
Table 92: Middle East and Africa Market Volume (MT) Forecast by Source, 2018 to 2033
Table 93: Middle East and Africa Market Value (US$ Million) Forecast by Process, 2018 to 2033
Table 94: Middle East and Africa Market Volume (MT) Forecast by Process, 2018 to 2033
Table 95: Middle East and Africa Market Value (US$ Million) Forecast by End Use, 2018 to 2033
Table 96: Middle East and Africa Market Volume (MT) Forecast by End Use, 2018 to 2033
Figure 1: Global Market Value (US$ Million) by Product Type, 2023 to 2033
Figure 2: Global Market Value (US$ Million) by Form, 2023 to 2033
Figure 3: Global Market Value (US$ Million) by Source, 2023 to 2033
Figure 4: Global Market Value (US$ Million) by Process, 2023 to 2033
Figure 5: Global Market Value (US$ Million) by End Use, 2023 to 2033
Figure 6: Global Market Value (US$ Million) by Region, 2023 to 2033
Figure 7: Global Market Value (US$ Million) Analysis by Region, 2018 to 2033
Figure 8: Global Market Volume (MT) Analysis by Region, 2018 to 2033
Figure 9: Global Market Value Share (%) and BPS Analysis by Region, 2023 to 2033
Figure 10: Global Market Y-o-Y Growth (%) Projections by Region, 2023 to 2033
Figure 11: Global Market Value (US$ Million) Analysis by Product Type, 2018 to 2033
Figure 12: Global Market Volume (MT) Analysis by Product Type, 2018 to 2033
Figure 13: Global Market Value Share (%) and BPS Analysis by Product Type, 2023 to 2033
Figure 14: Global Market Y-o-Y Growth (%) Projections by Product Type, 2023 to 2033
Figure 15: Global Market Value (US$ Million) Analysis by Form, 2018 to 2033
Figure 16: Global Market Volume (MT) Analysis by Form, 2018 to 2033
Figure 17: Global Market Value Share (%) and BPS Analysis by Form, 2023 to 2033
Figure 18: Global Market Y-o-Y Growth (%) Projections by Form, 2023 to 2033
Figure 19: Global Market Value (US$ Million) Analysis by Source, 2018 to 2033
Figure 20: Global Market Volume (MT) Analysis by Source, 2018 to 2033
Figure 21: Global Market Value Share (%) and BPS Analysis by Source, 2023 to 2033
Figure 22: Global Market Y-o-Y Growth (%) Projections by Source, 2023 to 2033
Figure 23: Global Market Value (US$ Million) Analysis by Process, 2018 to 2033
Figure 24: Global Market Volume (MT) Analysis by Process, 2018 to 2033
Figure 25: Global Market Value Share (%) and BPS Analysis by Process, 2023 to 2033
Figure 26: Global Market Y-o-Y Growth (%) Projections by Process, 2023 to 2033
Figure 27: Global Market Value (US$ Million) Analysis by End Use, 2018 to 2033
Figure 28: Global Market Volume (MT) Analysis by End Use, 2018 to 2033
Figure 29: Global Market Value Share (%) and BPS Analysis by End Use, 2023 to 2033
Figure 30: Global Market Y-o-Y Growth (%) Projections by End Use, 2023 to 2033
Figure 31: Global Market Attractiveness by Product Type, 2023 to 2033
Figure 32: Global Market Attractiveness by Form, 2023 to 2033
Figure 33: Global Market Attractiveness by Source, 2023 to 2033
Figure 34: Global Market Attractiveness by Process, 2023 to 2033
Figure 35: Global Market Attractiveness by End Use, 2023 to 2033
Figure 36: Global Market Attractiveness by Region, 2023 to 2033
Figure 37: North America Market Value (US$ Million) by Product Type, 2023 to 2033
Figure 38: North America Market Value (US$ Million) by Form, 2023 to 2033
Figure 39: North America Market Value (US$ Million) by Source, 2023 to 2033
Figure 40: North America Market Value (US$ Million) by Process, 2023 to 2033
Figure 41: North America Market Value (US$ Million) by End Use, 2023 to 2033
Figure 42: North America Market Value (US$ Million) by Country, 2023 to 2033
Figure 43: North America Market Value (US$ Million) Analysis by Country, 2018 to 2033
Figure 44: North America Market Volume (MT) Analysis by Country, 2018 to 2033
Figure 45: North America Market Value Share (%) and BPS Analysis by Country, 2023 to 2033
Figure 46: North America Market Y-o-Y Growth (%) Projections by Country, 2023 to 2033
Figure 47: North America Market Value (US$ Million) Analysis by Product Type, 2018 to 2033
Figure 48: North America Market Volume (MT) Analysis by Product Type, 2018 to 2033
Figure 49: North America Market Value Share (%) and BPS Analysis by Product Type, 2023 to 2033
Figure 50: North America Market Y-o-Y Growth (%) Projections by Product Type, 2023 to 2033
Figure 51: North America Market Value (US$ Million) Analysis by Form, 2018 to 2033
Figure 52: North America Market Volume (MT) Analysis by Form, 2018 to 2033
Figure 53: North America Market Value Share (%) and BPS Analysis by Form, 2023 to 2033
Figure 54: North America Market Y-o-Y Growth (%) Projections by Form, 2023 to 2033
Figure 55: North America Market Value (US$ Million) Analysis by Source, 2018 to 2033
Figure 56: North America Market Volume (MT) Analysis by Source, 2018 to 2033
Figure 57: North America Market Value Share (%) and BPS Analysis by Source, 2023 to 2033
Figure 58: North America Market Y-o-Y Growth (%) Projections by Source, 2023 to 2033
Figure 59: North America Market Value (US$ Million) Analysis by Process, 2018 to 2033
Figure 60: North America Market Volume (MT) Analysis by Process, 2018 to 2033
Figure 61: North America Market Value Share (%) and BPS Analysis by Process, 2023 to 2033
Figure 62: North America Market Y-o-Y Growth (%) Projections by Process, 2023 to 2033
Figure 63: North America Market Value (US$ Million) Analysis by End Use, 2018 to 2033
Figure 64: North America Market Volume (MT) Analysis by End Use, 2018 to 2033
Figure 65: North America Market Value Share (%) and BPS Analysis by End Use, 2023 to 2033
Figure 66: North America Market Y-o-Y Growth (%) Projections by End Use, 2023 to 2033
Figure 67: North America Market Attractiveness by Product Type, 2023 to 2033
Figure 68: North America Market Attractiveness by Form, 2023 to 2033
Figure 69: North America Market Attractiveness by Source, 2023 to 2033
Figure 70: North America Market Attractiveness by Process, 2023 to 2033
Figure 71: North America Market Attractiveness by End Use, 2023 to 2033
Figure 72: North America Market Attractiveness by Country, 2023 to 2033
Figure 73: Latin America Market Value (US$ Million) by Product Type, 2023 to 2033
Figure 74: Latin America Market Value (US$ Million) by Form, 2023 to 2033
Figure 75: Latin America Market Value (US$ Million) by Source, 2023 to 2033
Figure 76: Latin America Market Value (US$ Million) by Process, 2023 to 2033
Figure 77: Latin America Market Value (US$ Million) by End Use, 2023 to 2033
Figure 78: Latin America Market Value (US$ Million) by Country, 2023 to 2033
Figure 79: Latin America Market Value (US$ Million) Analysis by Country, 2018 to 2033
Figure 80: Latin America Market Volume (MT) Analysis by Country, 2018 to 2033
Figure 81: Latin America Market Value Share (%) and BPS Analysis by Country, 2023 to 2033
Figure 82: Latin America Market Y-o-Y Growth (%) Projections by Country, 2023 to 2033
Figure 83: Latin America Market Value (US$ Million) Analysis by Product Type, 2018 to 2033
Figure 84: Latin America Market Volume (MT) Analysis by Product Type, 2018 to 2033
Figure 85: Latin America Market Value Share (%) and BPS Analysis by Product Type, 2023 to 2033
Figure 86: Latin America Market Y-o-Y Growth (%) Projections by Product Type, 2023 to 2033
Figure 87: Latin America Market Value (US$ Million) Analysis by Form, 2018 to 2033
Figure 88: Latin America Market Volume (MT) Analysis by Form, 2018 to 2033
Figure 89: Latin America Market Value Share (%) and BPS Analysis by Form, 2023 to 2033
Figure 90: Latin America Market Y-o-Y Growth (%) Projections by Form, 2023 to 2033
Figure 91: Latin America Market Value (US$ Million) Analysis by Source, 2018 to 2033
Figure 92: Latin America Market Volume (MT) Analysis by Source, 2018 to 2033
Figure 93: Latin America Market Value Share (%) and BPS Analysis by Source, 2023 to 2033
Figure 94: Latin America Market Y-o-Y Growth (%) Projections by Source, 2023 to 2033
Figure 95: Latin America Market Value (US$ Million) Analysis by Process, 2018 to 2033
Figure 96: Latin America Market Volume (MT) Analysis by Process, 2018 to 2033
Figure 97: Latin America Market Value Share (%) and BPS Analysis by Process, 2023 to 2033
Figure 98: Latin America Market Y-o-Y Growth (%) Projections by Process, 2023 to 2033
Figure 99: Latin America Market Value (US$ Million) Analysis by End Use, 2018 to 2033
Figure 100: Latin America Market Volume (MT) Analysis by End Use, 2018 to 2033
Figure 101: Latin America Market Value Share (%) and BPS Analysis by End Use, 2023 to 2033
Figure 102: Latin America Market Y-o-Y Growth (%) Projections by End Use, 2023 to 2033
Figure 103: Latin America Market Attractiveness by Product Type, 2023 to 2033
Figure 104: Latin America Market Attractiveness by Form, 2023 to 2033
Figure 105: Latin America Market Attractiveness by Source, 2023 to 2033
Figure 106: Latin America Market Attractiveness by Process, 2023 to 2033
Figure 107: Latin America Market Attractiveness by End Use, 2023 to 2033
Figure 108: Latin America Market Attractiveness by Country, 2023 to 2033
Figure 109: Western Europe Market Value (US$ Million) by Product Type, 2023 to 2033
Figure 110: Western Europe Market Value (US$ Million) by Form, 2023 to 2033
Figure 111: Western Europe Market Value (US$ Million) by Source, 2023 to 2033
Figure 112: Western Europe Market Value (US$ Million) by Process, 2023 to 2033
Figure 113: Western Europe Market Value (US$ Million) by End Use, 2023 to 2033
Figure 114: Western Europe Market Value (US$ Million) by Country, 2023 to 2033
Figure 115: Western Europe Market Value (US$ Million) Analysis by Country, 2018 to 2033
Figure 116: Western Europe Market Volume (MT) Analysis by Country, 2018 to 2033
Figure 117: Western Europe Market Value Share (%) and BPS Analysis by Country, 2023 to 2033
Figure 118: Western Europe Market Y-o-Y Growth (%) Projections by Country, 2023 to 2033
Figure 119: Western Europe Market Value (US$ Million) Analysis by Product Type, 2018 to 2033
Figure 120: Western Europe Market Volume (MT) Analysis by Product Type, 2018 to 2033
Figure 121: Western Europe Market Value Share (%) and BPS Analysis by Product Type, 2023 to 2033
Figure 122: Western Europe Market Y-o-Y Growth (%) Projections by Product Type, 2023 to 2033
Figure 123: Western Europe Market Value (US$ Million) Analysis by Form, 2018 to 2033
Figure 124: Western Europe Market Volume (MT) Analysis by Form, 2018 to 2033
Figure 125: Western Europe Market Value Share (%) and BPS Analysis by Form, 2023 to 2033
Figure 126: Western Europe Market Y-o-Y Growth (%) Projections by Form, 2023 to 2033
Figure 127: Western Europe Market Value (US$ Million) Analysis by Source, 2018 to 2033
Figure 128: Western Europe Market Volume (MT) Analysis by Source, 2018 to 2033
Figure 129: Western Europe Market Value Share (%) and BPS Analysis by Source, 2023 to 2033
Figure 130: Western Europe Market Y-o-Y Growth (%) Projections by Source, 2023 to 2033
Figure 131: Western Europe Market Value (US$ Million) Analysis by Process, 2018 to 2033
Figure 132: Western Europe Market Volume (MT) Analysis by Process, 2018 to 2033
Figure 133: Western Europe Market Value Share (%) and BPS Analysis by Process, 2023 to 2033
Figure 134: Western Europe Market Y-o-Y Growth (%) Projections by Process, 2023 to 2033
Figure 135: Western Europe Market Value (US$ Million) Analysis by End Use, 2018 to 2033
Figure 136: Western Europe Market Volume (MT) Analysis by End Use, 2018 to 2033
Figure 137: Western Europe Market Value Share (%) and BPS Analysis by End Use, 2023 to 2033
Figure 138: Western Europe Market Y-o-Y Growth (%) Projections by End Use, 2023 to 2033
Figure 139: Western Europe Market Attractiveness by Product Type, 2023 to 2033
Figure 140: Western Europe Market Attractiveness by Form, 2023 to 2033
Figure 141: Western Europe Market Attractiveness by Source, 2023 to 2033
Figure 142: Western Europe Market Attractiveness by Process, 2023 to 2033
Figure 143: Western Europe Market Attractiveness by End Use, 2023 to 2033
Figure 144: Western Europe Market Attractiveness by Country, 2023 to 2033
Figure 145: Eastern Europe Market Value (US$ Million) by Product Type, 2023 to 2033
Figure 146: Eastern Europe Market Value (US$ Million) by Form, 2023 to 2033
Figure 147: Eastern Europe Market Value (US$ Million) by Source, 2023 to 2033
Figure 148: Eastern Europe Market Value (US$ Million) by Process, 2023 to 2033
Figure 149: Eastern Europe Market Value (US$ Million) by End Use, 2023 to 2033
Figure 150: Eastern Europe Market Value (US$ Million) by Country, 2023 to 2033
Figure 151: Eastern Europe Market Value (US$ Million) Analysis by Country, 2018 to 2033
Figure 152: Eastern Europe Market Volume (MT) Analysis by Country, 2018 to 2033
Figure 153: Eastern Europe Market Value Share (%) and BPS Analysis by Country, 2023 to 2033
Figure 154: Eastern Europe Market Y-o-Y Growth (%) Projections by Country, 2023 to 2033
Figure 155: Eastern Europe Market Value (US$ Million) Analysis by Product Type, 2018 to 2033
Figure 156: Eastern Europe Market Volume (MT) Analysis by Product Type, 2018 to 2033
Figure 157: Eastern Europe Market Value Share (%) and BPS Analysis by Product Type, 2023 to 2033
Figure 158: Eastern Europe Market Y-o-Y Growth (%) Projections by Product Type, 2023 to 2033
Figure 159: Eastern Europe Market Value (US$ Million) Analysis by Form, 2018 to 2033
Figure 160: Eastern Europe Market Volume (MT) Analysis by Form, 2018 to 2033
Figure 161: Eastern Europe Market Value Share (%) and BPS Analysis by Form, 2023 to 2033
Figure 162: Eastern Europe Market Y-o-Y Growth (%) Projections by Form, 2023 to 2033
Figure 163: Eastern Europe Market Value (US$ Million) Analysis by Source, 2018 to 2033
Figure 164: Eastern Europe Market Volume (MT) Analysis by Source, 2018 to 2033
Figure 165: Eastern Europe Market Value Share (%) and BPS Analysis by Source, 2023 to 2033
Figure 166: Eastern Europe Market Y-o-Y Growth (%) Projections by Source, 2023 to 2033
Figure 167: Eastern Europe Market Value (US$ Million) Analysis by Process, 2018 to 2033
Figure 168: Eastern Europe Market Volume (MT) Analysis by Process, 2018 to 2033
Figure 169: Eastern Europe Market Value Share (%) and BPS Analysis by Process, 2023 to 2033
Figure 170: Eastern Europe Market Y-o-Y Growth (%) Projections by Process, 2023 to 2033
Figure 171: Eastern Europe Market Value (US$ Million) Analysis by End Use, 2018 to 2033
Figure 172: Eastern Europe Market Volume (MT) Analysis by End Use, 2018 to 2033
Figure 173: Eastern Europe Market Value Share (%) and BPS Analysis by End Use, 2023 to 2033
Figure 174: Eastern Europe Market Y-o-Y Growth (%) Projections by End Use, 2023 to 2033
Figure 175: Eastern Europe Market Attractiveness by Product Type, 2023 to 2033
Figure 176: Eastern Europe Market Attractiveness by Form, 2023 to 2033
Figure 177: Eastern Europe Market Attractiveness by Source, 2023 to 2033
Figure 178: Eastern Europe Market Attractiveness by Process, 2023 to 2033
Figure 179: Eastern Europe Market Attractiveness by End Use, 2023 to 2033
Figure 180: Eastern Europe Market Attractiveness by Country, 2023 to 2033
Figure 181: South Asia and Pacific Market Value (US$ Million) by Product Type, 2023 to 2033
Figure 182: South Asia and Pacific Market Value (US$ Million) by Form, 2023 to 2033
Figure 183: South Asia and Pacific Market Value (US$ Million) by Source, 2023 to 2033
Figure 184: South Asia and Pacific Market Value (US$ Million) by Process, 2023 to 2033
Figure 185: South Asia and Pacific Market Value (US$ Million) by End Use, 2023 to 2033
Figure 186: South Asia and Pacific Market Value (US$ Million) by Country, 2023 to 2033
Figure 187: South Asia and Pacific Market Value (US$ Million) Analysis by Country, 2018 to 2033
Figure 188: South Asia and Pacific Market Volume (MT) Analysis by Country, 2018 to 2033
Figure 189: South Asia and Pacific Market Value Share (%) and BPS Analysis by Country, 2023 to 2033
Figure 190: South Asia and Pacific Market Y-o-Y Growth (%) Projections by Country, 2023 to 2033
Figure 191: South Asia and Pacific Market Value (US$ Million) Analysis by Product Type, 2018 to 2033
Figure 192: South Asia and Pacific Market Volume (MT) Analysis by Product Type, 2018 to 2033
Figure 193: South Asia and Pacific Market Value Share (%) and BPS Analysis by Product Type, 2023 to 2033
Figure 194: South Asia and Pacific Market Y-o-Y Growth (%) Projections by Product Type, 2023 to 2033
Figure 195: South Asia and Pacific Market Value (US$ Million) Analysis by Form, 2018 to 2033
Figure 196: South Asia and Pacific Market Volume (MT) Analysis by Form, 2018 to 2033
Figure 197: South Asia and Pacific Market Value Share (%) and BPS Analysis by Form, 2023 to 2033
Figure 198: South Asia and Pacific Market Y-o-Y Growth (%) Projections by Form, 2023 to 2033
Figure 199: South Asia and Pacific Market Value (US$ Million) Analysis by Source, 2018 to 2033
Figure 200: South Asia and Pacific Market Volume (MT) Analysis by Source, 2018 to 2033
Figure 201: South Asia and Pacific Market Value Share (%) and BPS Analysis by Source, 2023 to 2033
Figure 202: South Asia and Pacific Market Y-o-Y Growth (%) Projections by Source, 2023 to 2033
Figure 203: South Asia and Pacific Market Value (US$ Million) Analysis by Process, 2018 to 2033
Figure 204: South Asia and Pacific Market Volume (MT) Analysis by Process, 2018 to 2033
Figure 205: South Asia and Pacific Market Value Share (%) and BPS Analysis by Process, 2023 to 2033
Figure 206: South Asia and Pacific Market Y-o-Y Growth (%) Projections by Process, 2023 to 2033
Figure 207: South Asia and Pacific Market Value (US$ Million) Analysis by End Use, 2018 to 2033
Figure 208: South Asia and Pacific Market Volume (MT) Analysis by End Use, 2018 to 2033
Figure 209: South Asia and Pacific Market Value Share (%) and BPS Analysis by End Use, 2023 to 2033
Figure 210: South Asia and Pacific Market Y-o-Y Growth (%) Projections by End Use, 2023 to 2033
Figure 211: South Asia and Pacific Market Attractiveness by Product Type, 2023 to 2033
Figure 212: South Asia and Pacific Market Attractiveness by Form, 2023 to 2033
Figure 213: South Asia and Pacific Market Attractiveness by Source, 2023 to 2033
Figure 214: South Asia and Pacific Market Attractiveness by Process, 2023 to 2033
Figure 215: South Asia and Pacific Market Attractiveness by End Use, 2023 to 2033
Figure 216: South Asia and Pacific Market Attractiveness by Country, 2023 to 2033
Figure 217: East Asia Market Value (US$ Million) by Product Type, 2023 to 2033
Figure 218: East Asia Market Value (US$ Million) by Form, 2023 to 2033
Figure 219: East Asia Market Value (US$ Million) by Source, 2023 to 2033
Figure 220: East Asia Market Value (US$ Million) by Process, 2023 to 2033
Figure 221: East Asia Market Value (US$ Million) by End Use, 2023 to 2033
Figure 222: East Asia Market Value (US$ Million) by Country, 2023 to 2033
Figure 223: East Asia Market Value (US$ Million) Analysis by Country, 2018 to 2033
Figure 224: East Asia Market Volume (MT) Analysis by Country, 2018 to 2033
Figure 225: East Asia Market Value Share (%) and BPS Analysis by Country, 2023 to 2033
Figure 226: East Asia Market Y-o-Y Growth (%) Projections by Country, 2023 to 2033
Figure 227: East Asia Market Value (US$ Million) Analysis by Product Type, 2018 to 2033
Figure 228: East Asia Market Volume (MT) Analysis by Product Type, 2018 to 2033
Figure 229: East Asia Market Value Share (%) and BPS Analysis by Product Type, 2023 to 2033
Figure 230: East Asia Market Y-o-Y Growth (%) Projections by Product Type, 2023 to 2033
Figure 231: East Asia Market Value (US$ Million) Analysis by Form, 2018 to 2033
Figure 232: East Asia Market Volume (MT) Analysis by Form, 2018 to 2033
Figure 233: East Asia Market Value Share (%) and BPS Analysis by Form, 2023 to 2033
Figure 234: East Asia Market Y-o-Y Growth (%) Projections by Form, 2023 to 2033
Figure 235: East Asia Market Value (US$ Million) Analysis by Source, 2018 to 2033
Figure 236: East Asia Market Volume (MT) Analysis by Source, 2018 to 2033
Figure 237: East Asia Market Value Share (%) and BPS Analysis by Source, 2023 to 2033
Figure 238: East Asia Market Y-o-Y Growth (%) Projections by Source, 2023 to 2033
Figure 239: East Asia Market Value (US$ Million) Analysis by Process, 2018 to 2033
Figure 240: East Asia Market Volume (MT) Analysis by Process, 2018 to 2033
Figure 241: East Asia Market Value Share (%) and BPS Analysis by Process, 2023 to 2033
Figure 242: East Asia Market Y-o-Y Growth (%) Projections by Process, 2023 to 2033
Figure 243: East Asia Market Value (US$ Million) Analysis by End Use, 2018 to 2033
Figure 244: East Asia Market Volume (MT) Analysis by End Use, 2018 to 2033
Figure 245: East Asia Market Value Share (%) and BPS Analysis by End Use, 2023 to 2033
Figure 246: East Asia Market Y-o-Y Growth (%) Projections by End Use, 2023 to 2033
Figure 247: East Asia Market Attractiveness by Product Type, 2023 to 2033
Figure 248: East Asia Market Attractiveness by Form, 2023 to 2033
Figure 249: East Asia Market Attractiveness by Source, 2023 to 2033
Figure 250: East Asia Market Attractiveness by Process, 2023 to 2033
Figure 251: East Asia Market Attractiveness by End Use, 2023 to 2033
Figure 252: East Asia Market Attractiveness by Country, 2023 to 2033
Figure 253: Middle East and Africa Market Value (US$ Million) by Product Type, 2023 to 2033
Figure 254: Middle East and Africa Market Value (US$ Million) by Form, 2023 to 2033
Figure 255: Middle East and Africa Market Value (US$ Million) by Source, 2023 to 2033
Figure 256: Middle East and Africa Market Value (US$ Million) by Process, 2023 to 2033
Figure 257: Middle East and Africa Market Value (US$ Million) by End Use, 2023 to 2033
Figure 258: Middle East and Africa Market Value (US$ Million) by Country, 2023 to 2033
Figure 259: Middle East and Africa Market Value (US$ Million) Analysis by Country, 2018 to 2033
Figure 260: Middle East and Africa Market Volume (MT) Analysis by Country, 2018 to 2033
Figure 261: Middle East and Africa Market Value Share (%) and BPS Analysis by Country, 2023 to 2033
Figure 262: Middle East and Africa Market Y-o-Y Growth (%) Projections by Country, 2023 to 2033
Figure 263: Middle East and Africa Market Value (US$ Million) Analysis by Product Type, 2018 to 2033
Figure 264: Middle East and Africa Market Volume (MT) Analysis by Product Type, 2018 to 2033
Figure 265: Middle East and Africa Market Value Share (%) and BPS Analysis by Product Type, 2023 to 2033
Figure 266: Middle East and Africa Market Y-o-Y Growth (%) Projections by Product Type, 2023 to 2033
Figure 267: Middle East and Africa Market Value (US$ Million) Analysis by Form, 2018 to 2033
Figure 268: Middle East and Africa Market Volume (MT) Analysis by Form, 2018 to 2033
Figure 269: Middle East and Africa Market Value Share (%) and BPS Analysis by Form, 2023 to 2033
Figure 270: Middle East and Africa Market Y-o-Y Growth (%) Projections by Form, 2023 to 2033
Figure 271: Middle East and Africa Market Value (US$ Million) Analysis by Source, 2018 to 2033
Figure 272: Middle East and Africa Market Volume (MT) Analysis by Source, 2018 to 2033
Figure 273: Middle East and Africa Market Value Share (%) and BPS Analysis by Source, 2023 to 2033
Figure 274: Middle East and Africa Market Y-o-Y Growth (%) Projections by Source, 2023 to 2033
Figure 275: Middle East and Africa Market Value (US$ Million) Analysis by Process, 2018 to 2033
Figure 276: Middle East and Africa Market Volume (MT) Analysis by Process, 2018 to 2033
Figure 277: Middle East and Africa Market Value Share (%) and BPS Analysis by Process, 2023 to 2033
Figure 278: Middle East and Africa Market Y-o-Y Growth (%) Projections by Process, 2023 to 2033
Figure 279: Middle East and Africa Market Value (US$ Million) Analysis by End Use, 2018 to 2033
Figure 280: Middle East and Africa Market Volume (MT) Analysis by End Use, 2018 to 2033
Figure 281: Middle East and Africa Market Value Share (%) and BPS Analysis by End Use, 2023 to 2033
Figure 282: Middle East and Africa Market Y-o-Y Growth (%) Projections by End Use, 2023 to 2033
Figure 283: Middle East and Africa Market Attractiveness by Product Type, 2023 to 2033
Figure 284: Middle East and Africa Market Attractiveness by Form, 2023 to 2033
Figure 285: Middle East and Africa Market Attractiveness by Source, 2023 to 2033
Figure 286: Middle East and Africa Market Attractiveness by Process, 2023 to 2033
Figure 287: Middle East and Africa Market Attractiveness by End Use, 2023 to 2033
Figure 288: Middle East and Africa Market Attractiveness by Country, 2023 to 2033
Vitamin C deficiency patients are the key consumer.
The global market is projecting a significant CAGR of 5.6% by 2033.
The market is estimated to secure a valuation of USD 2,704 million in 2023.
The market is estimated to reach USD 4,657.5 million by 2033.
The Sodium ascorbate segment holds high revenue potential.
Explore Similar Insights
Thank you!
You will receive an email from our Business Development Manager. Please be sure to check your SPAM/JUNK folder too.