Vitamin Premix Market Size and Share Forecast Outlook 2025 to 2035

The global vitamin premix market is worth USD 1.5 billion in 2025 and is slated to witness a valuation of USD 3.6 billion by 2035, reflecting a CAGR of 7.9%.
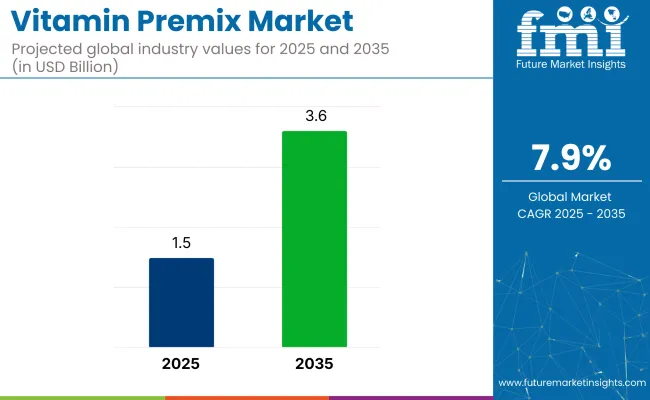
Quick Stats for Vitamin Premix Market

  • Market Value (2025): USD 1.5 billion
  • Forecast Value (2035): USD 3.6 billion
  • Forecast CAGR: 7.9%
  • Form Leader in 2025: Powder (66.4% Market Share)
  • Top Application: Food Sector (40% Market Share)
  • Key Growth Region: Asia Pacific (fastest growing market in Japan with 8.0% CAGR)

Vitamin Premix Market

Metric Value
Estimated Size (2025E) USD 1.5 billion
Projected Value (2035F) USD 3.6 billion
CAGR (2025 to 2035) 7.9%

Factors driving this growth include rising consumer awareness about fortified foods, increased demand for customized nutritional solutions, and the continued popularity of functional foods and nutraceuticals. The surge in demand for health-focused products, particularly those related to sports nutrition, is expected to contribute significantly to the market’s expansion.

The global market is projected to witness robust growth from 2025 to 2035, driven by the rising demand for customized, nutrient-rich food products across industries like food & beverage, pharmaceuticals, and nutraceuticals.

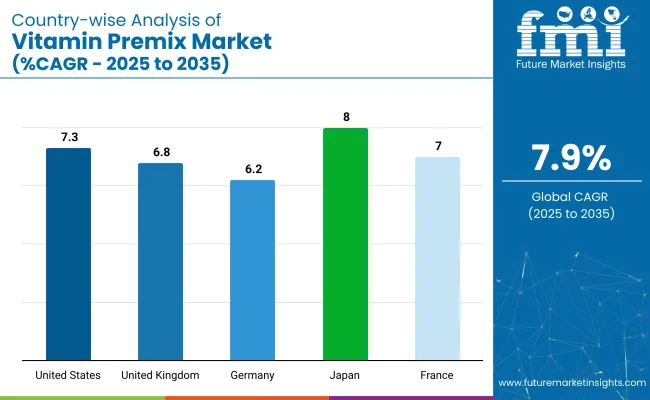
The powder form of vitamin premixes is anticipated to dominate the market, accounting for 66.4% of the market share in 2025. Meanwhile, the food sector by application segment holds 40% of the market share. Japanis anticipated to grow at a significant CAGR of 8.0%. Meanwhile, the USA and France closely follow this growth, rising at CAGRs of 7.3% and 7.0% respectively.

The market holds a significant share in several parent markets. In the functional food ingredients market, vitamin premixes contribute to about 10-12%, driven by their role in fortifying functional foods. In the nutraceuticals market, the share is approximately 8-10%, as premixes are essential in supplement formulations.

The dietary supplements market sees around 5-7% from vitamin premixes, given their use in enhancing product nutritional value. In the animal nutrition market, the share is about 6-8%, as vitamin premixes are widely used in animal feed. In the food fortification market, they account for 15-18% due to their widespread use in fortified products.

Vitamin Premix Market Analysis by Top Investment Segments

The global market is analyzed across several key segments, including form, function, application, and region. By form, the market is divided into powder and liquid segments. In terms of function, the segments include bone health, immunity, digestion, energy, heart health, weight management, vision health, brain health & memory, and resistance.

For applications, the market spans the food sector, dietary supplements, pharma OTC drugs, and pet food. Geographically, the market is segmented into regions such as North America, Latin America, Europe, East Asia, South Asia, Oceania, the Middle East and Africa (Others).

By Form, the Powder Segment Accounts for 66.4% of the Market Share

The powder segment is set to remain dominant due to its superior homogeneity and convenience. Powdered vitamin premixes offer better stability, extended shelf life, and are easier to transport, making them the preferred choice for manufacturers. This segment is expected to account for over 66.4% of the market share in 2025.
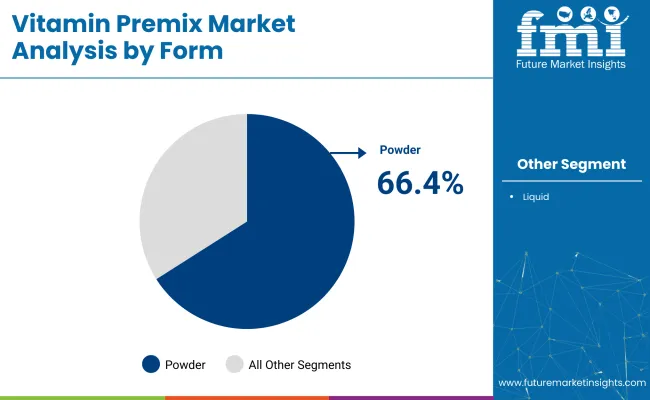
  • Powdered form ensures greater mixing efficiency.
  • Longer shelf life and cost-effectiveness.
  • Highly favored in various applications like animal feed and nutraceuticals.

Vitamin Premix Market By Form

By Function, Immunity-boosting Premixes Account for 30% of the Market Share

Immunity-boosting premixes will hold the largest share of 30% in the function segment. With rising health concerns and a growing emphasis on immune system support, immunity-based premixes are seeing increasing adoption across the food and supplement industries. This segment is projected to witness significant growth throughout the forecast period.

  • Immunity-enhancing ingredients are in high demand.
  • Increased consumer awareness of health and wellness.
  • Strong growth expected in dietary supplements.

By Application, the Food Sector Accounts for 40% of the Market Share

The food sector remains the largest application area, driven by the continuous demand for fortified foods. The segment accounts for 40% of the market share in 2025. This segment includes functional foods and ready-to-eat products, which are expected to grow substantially as consumers become more health-conscious and prioritize nutrition.
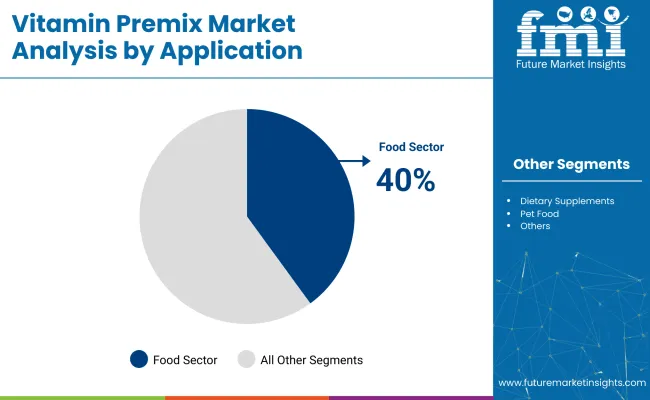
  • Growing demand for fortified and functional food products.
  • Increasing consumer preference for health-oriented products.
  • The rise in on-the-go meals and nutrition-focused diets.

Vitamin Premix Market By Application

Top Vitamin Premix Market Dynamics

Recent Trends in Vitamin Premix Market

  • Rising health awareness is driving demand for fortified foods and supplements.
  • Increasing consumer preference for personalized nutrition is boosting customized vitamin premixes.
  • The growing popularity of ready-to-eat food products is propelling the use of vitamin premixes.
  • Technological advancements in nutrient delivery systems are enhancing product efficacy and stability.

Challenges in the Vitamin Premix Market
  • Regulatory complexities across different regions may hinder market expansion.
  • Nutrient interactions in premixes can affect stability and bioavailability.
  • Supply chain disruptions can impact production and distribution efficiency.
  • High competition from local manufacturers with lower production costs.

Analyzing Top Countries Producing and Supplying Vitamin Premixes

Country Wise Analysis Of Vitamin Premix Market

The growth rates of the market across the top countries vary, with Japan projected to experience the highest CAGR of 8.0% from 2025 to 2035, driven by its aging population and increasing demand for functional foods. The USA follows closely with a 7.3% CAGR, supported by strong consumer demand for health and wellness products.

France and the UK are also expected to see solid growth, with CAGRs of 7.0% and 6.8%, respectively, driven by health-conscious consumers and increasing interest in functional foods. Germany, while growing at a slightly slower pace of 6.2%, benefits from its strong regulatory framework and developed healthcare sector.

The report covers an in-depth analysis of 40+ countries; five top-performing OECD countries are highlighted below.

United States Vitamin Premix Market Analysis

The vitamin premix revenue in the USA is expected to grow at a CAGR of 7.3% from 2025 to 2035. The country's strong demand for dietary supplements and functional foods is a key factor driving the growth of vitamin premix consumption.

The USA has a large and diverse consumer base that continues to prioritize health and wellness, making it a significant market for immune-boosting and personalized nutrition products. Key players are increasing their manufacturing capacities to meet the demand for vitamin premixes, particularly in the sports nutrition and dietary supplement sectors.

  • High consumer demand for health and wellness products.
  • Strong preference for sports nutrition and performance-enhancing supplements.
  • Growth in functional foods and dietary supplement sectors.

Vitamin Premix Demand Analysis in the UK

The sales of vitamin premix in the UK are projected to flourish at a CAGR of 6.8% from 2025 to 2035. The UK has witnessed a surge in the consumption of fortified foods and dietary supplements, particularly due to increased consumer awareness of nutritional deficiencies.

The country's increasing focus on functional foods and personalized nutrition is expected to boost the demand for vitamin premixes, with health-conscious consumers seeking tailored nutrient blends to support specific health needs.

  • Rise in demand for personalized nutrition and health-focused products.
  • Growing popularity of functional foods among the British population.
  • Government initiatives promoting public health and wellness.

Germany Vitamin Premix Sales Analysis

The vitamin premix market in Germany is forecasted to experience a CAGR of 6.2% from 2025 to 2035 in the vitamin premix market. As one of Europe's largest economies, Germany has a highly developed healthcare and food industry. The demand for vitamin premixes is supported by the country’s emphasis on healthy living and nutritional supplements.

  • Significant consumer base for fortified foods and dietary supplements.
  • Stringent regulatory standards ensure product quality and safety.
  • Expansion of the nutraceutical and animal feed markets.

Vitamin Premix Demand Analysis in France

The revenue from vitamin premix in France is expected to grow at a CAGR of 7.0% in the vitamin premix market from 2025 to 2035. The French market is growing due to the increasing demand for health-oriented food products, including fortified foods and functional beverages. A growing aging population and rising health consciousness among consumers are driving the demand for vitamin premixes in both food and nutraceutical applications.

  • Increasing demand for health and wellness products, especially among older people.
  • Rising popularity of fortified foods and functional beverages.
  • Strong distribution network for efficient market reach.

Japan Vitamin Premix Market Analysis

The sales of vitamin premix in Japan are projected to rise at a CAGR of 8.0% from 2025 to 2035. Japan is a leading market in Asia for functional foods and dietary supplements, with a strong focus on improving public health through fortified foods. The country's aging population and growing awareness about nutrition and wellness are major drivers for the increased consumption of vitamin premixes, particularly in functional foods and nutraceutical products.

  • Significant market growth driven by the aging population.
  • Rising demand for functional foods and dietary supplements.
  • Strong focus on public health and wellness initiatives.

Leading Vitamin Premix Suppliers

The market is moderately consolidated, with a few global leaders accounting for a significant share of revenues. Tier-one companies like DSM-Firmenich, Glanbia plc, Vitablend, SternVitamin GmbH & Co., and Watson Inc. are competing based on innovation, pricing, and strategic partnerships. These companies focus on enhancing product portfolios, expanding manufacturing capacities, and meeting the growing demand for fortified foods and dietary supplements.

Company strategies increasingly revolve around cost-effective manufacturing, real-time market responsiveness, and sustainability. Firms like DSM-Firmenich and Glanbia are investing in R&D to develop customized premixes tailored to specific nutritional needs.

Additionally, partnerships with food and beverage companies are being forged to integrate premixes into new product lines. SternVitamin and Watson Inc. are focusing on expanding their presence in emerging markets and enhancing their distribution networks to meet regional demands.

Recent Vitamin Premix Industry News

DSM (now DSM-Firmenich) opened a new Animal Nutrition & Health premix and additives plant in Sadat City, Egypt, in September 2025. This facility is designed to meet the rising demand from livestock farms and feed millers across Egypt, the Middle East, Southern Europe, and Africa, strengthening DSM’s position in the global premix market.

Vitamin Premix Market Report Scope

Report Attributes Details
Current Total Market Size (2025) USD 1.5 billion
Projected Market Size (2035) USD 3.6 billion
CAGR (2025 to 2035) 7.9%
Base Year for Estimation 2024
Historical Period 2020 to 2024
Projections Period 2025 to 2035
Market Analysis Parameters Revenue in USD billions/Volume in kilotons
By Form Powder, Liquid
By Function Bone Health, Immunity, Digestion, Energy, Heart Health, Weight Management, Vision Health, Brain Health & Memory, Resistance
By Application Food Sector, Dietary Supplements, Pharma OTC Drugs, Pet Food
Regions Covered North America, Latin America, Europe, Middle East and Africa, East Asia, South Asia, Oceania
Countries Covered United States, Canada, United Kingdom, Germany, France, China, Japan, South Korea, Brazil, Australia
Key Players DSM, Glanbia plc, Vitablend, SternVitamin GmbH & Co, Watson Inc., Wright Enrichment Inc., Zagro, Trouw Nutrition, Burkmann Industries, Inc., and Bar- Magen LTD
Additional Attributes Dollar sales by value, market share analysis by region, and country-level growth insights

Key Segments

By Form:

In this segment, the industry has been categorized into Powder and Liquid.

By Function:

This segment is further categorized into Bone Health, Immunity, Digestion, Energy, Heart Health, Weight Management, Vision Health, Brain Health & Memory, Resistance

By Application:

Different Applications include Food Sector, Dietary Supplements, Pharma OTC Drugs, Pet Food

By Region:

Industry analysis has been carried out in key countries of North America, Latin America, Europe, Middle East and Africa, East Asia, South Asia, and Oceania

Table of Content

  1. Executive Summary
    • Global Market Outlook
    • Demand-side Trends
    • Supply-side Trends
    • Technology Roadmap Analysis
    • Analysis and Recommendations
  2. Market Overview
    • Market Coverage / Taxonomy
    • Market Definition / Scope / Limitations
  3. Market Background
    • Market Dynamics
      • Drivers
      • Restraints
      • Opportunity
      • Trends
    • Scenario Forecast
      • Demand in Optimistic Scenario
      • Demand in Likely Scenario
      • Demand in Conservative Scenario
    • Opportunity Map Analysis
    • Product Life Cycle Analysis
    • Supply Chain Analysis
      • Supply Side Participants and their Roles
        • Producers
        • Mid-Level Participants (Traders/ Agents/ Brokers)
        • Wholesalers and Distributors
      • Value Added and Value Created at Node in the Supply Chain
      • List of Raw Material Suppliers
      • List of Existing and Potential Buyer’s
    • Investment Feasibility Matrix
    • Value Chain Analysis
      • Profit Margin Analysis
      • Wholesalers and Distributors
      • Retailers
    • PESTLE and Porter’s Analysis
    • Regulatory Landscape
      • By Key Regions
      • By Key Countries
    • Regional Parent Market Outlook
    • Production and Consumption Statistics
    • Import and Export Statistics
  4. Global Market Analysis 2020 to 2024 and Forecast, 2025 to 2035
    • Historical Market Size Value (USD Billion) & Volume (Kilotons) Analysis, 2020 to 2024
    • Current and Future Market Size Value (USD Billion) & Volume (Kilotons) Projections, 2025 to 2035
      • Y-o-Y Growth Trend Analysis
      • Absolute $ Opportunity Analysis
  5. Global Market Pricing Analysis 2020 to 2024 and Forecast 2025 to 2035
  6. Global Market Analysis 2020 to 2024 and Forecast 2025 to 2035, By Form
    • Introduction / Key Findings
    • Historical Market Size Value (USD Billion) & Volume (Kilotons) Analysis By Form, 2020 to 2024
    • Current and Future Market Size Value (USD Billion) & Volume (Kilotons) Analysis and Forecast By Form, 2025 to 2035
      • Powder
      • Liquid
    • Y-o-Y Growth Trend Analysis By Form, 2020 to 2024
    • Absolute $ Opportunity Analysis By Form, 2025 to 2035
  7. Global Market Analysis 2020 to 2024 and Forecast 2025 to 2035, By Function
    • Introduction / Key Findings
    • Historical Market Size Value (USD Billion) & Volume (Kilotons) Analysis By Function, 2020 to 2024
    • Current and Future Market Size Value (USD Billion) & Volume (Kilotons) Analysis and Forecast By Function, 2025 to 2035
      • Bone Health
      • Immunity
      • Digestion
      • Energy
      • Heart Health
      • Weight Management
      • Vision Health
      • Brain Health & Memory, Resistance
    • Y-o-Y Growth Trend Analysis By Function, 2020 to 2024
    • Absolute $ Opportunity Analysis By Function, 2025 to 2035
  8. Global Market Analysis 2020 to 2024 and Forecast 2025 to 2035, By Application
    • Introduction / Key Findings
    • Historical Market Size Value (USD Billion) & Volume (Kilotons) Analysis By Application, 2020 to 2024
    • Current and Future Market Size Value (USD Billion) & Volume (Kilotons) Analysis and Forecast By Application, 2025 to 2035
      • Food Sector
      • Dietary Supplements
      • Pharma OTC Drugs
      • Pet Food
    • Y-o-Y Growth Trend Analysis By Application, 2020 to 2024
    • Absolute $ Opportunity Analysis By Application, 2025 to 2035
  9. Global Market Analysis 2020 to 2024 and Forecast 2025 to 2035, By Region
    • Introduction
    • Historical Market Size Value (USD Billion) & Volume (Kilotons) Analysis By Region, 2020 to 2024
    • Current Market Size Value (USD Billion) & Volume (Kilotons) Analysis and Forecast By Region, 2025 to 2035
      • North America
      • Latin America
      • Western Europe
      • Eastern Europe
      • East Asia
      • South Asia & Pacific
      • Middle East and Africa
    • Market Attractiveness Analysis By Region
  10. North America Market Analysis 2020 to 2024 and Forecast 2025 to 2035, By Country
    • Historical Market Size Value (USD Billion) & Volume (Kilotons) Trend Analysis By Market Taxonomy, 2020 to 2024
    • Market Size Value (USD Billion) & Volume (Kilotons) Forecast By Market Taxonomy, 2025 to 2035
      • By Country
        • USA
        • Canada
        • Mexico
      • By Form
      • By Function
      • By Application
    • Market Attractiveness Analysis
      • By Country
      • By Form
      • By Function
      • By Application
    • Key Takeaways
  11. Latin America Market Analysis 2020 to 2024 and Forecast 2025 to 2035, By Country
    • Historical Market Size Value (USD Billion) & Volume (Kilotons) Trend Analysis By Market Taxonomy, 2020 to 2024
    • Market Size Value (USD Billion) & Volume (Kilotons) Forecast By Market Taxonomy, 2025 to 2035
      • By Country
        • Brazil
        • Argentina
        • Rest of LATAM
      • By Form
      • By Function
      • By Application
    • Market Attractiveness Analysis
      • By Country
      • By Form
      • By Function
      • By Application
    • Key Takeaways
  12. Western Europe Market Analysis 2020 to 2024 and Forecast 2025 to 2035, By Country
    • Historical Market Size Value (USD Billion) & Volume (Kilotons) Trend Analysis By Market Taxonomy, 2020 to 2024
    • Market Size Value (USD Billion) & Volume (Kilotons) Forecast By Market Taxonomy, 2025 to 2035
      • By Country
        • Germany
        • Italy
        • France
        • UK
        • Spain
        • BENELUX
        • Nordic
        • Rest of W.Europe
      • By Form
      • By Function
      • By Application
    • Market Attractiveness Analysis
      • By Country
      • By Form
      • By Function
      • By Application
    • Key Takeaways
  13. Eastern Europe Market Analysis 2020 to 2024 and Forecast 2025 to 2035, By Country
    • Historical Market Size Value (USD Billion) & Volume (Kilotons) Trend Analysis By Market Taxonomy, 2020 to 2024
    • Market Size Value (USD Billion) & Volume (Kilotons) Forecast By Market Taxonomy, 2025 to 2035
      • By Country
        • Russia
        • Hungary
        • Poland
        • Balkan & Baltics
        • Rest of E. Europe
      • By Form
      • By Function
      • By Application
    • Market Attractiveness Analysis
      • By Country
      • By Form
      • By Function
      • By Application
    • Key Takeaways
  14. East Asia Market Analysis 2020 to 2024 and Forecast 2025 to 2035, By Country
    • Historical Market Size Value (USD Billion) & Volume (Kilotons) Trend Analysis By Market Taxonomy, 2020 to 2024
    • Market Size Value (USD Billion) & Volume (Kilotons) Forecast By Market Taxonomy, 2025 to 2035
      • By Country
        • China
        • Japan
        • South Korea
      • By Form
      • By Function
      • By Application
    • Market Attractiveness Analysis
      • By Country
      • By Form
      • By Function
      • By Application
    • Key Takeaways
  15. South Asia & Pacific Market Analysis 2020 to 2024 and Forecast 2025 to 2035, By Country
    • Historical Market Size Value (USD Billion) & Volume (Kilotons) Trend Analysis By Market Taxonomy, 2020 to 2024
    • Market Size Value (USD Billion) & Volume (Kilotons) Forecast By Market Taxonomy, 2025 to 2035
      • By Country
        • India
        • Australia & New Zealand
        • ASEAN
        • Rest of SAP
      • By Form
      • By Function
      • By Application
    • Market Attractiveness Analysis
      • By Country
      • By Form
      • By Function
      • By Application
    • Key Takeaways
  16. Middle East and Africa Market Analysis 2020 to 2024 and Forecast 2025 to 2035, By Country
    • Historical Market Size Value (USD Billion) & Volume (Kilotons) Trend Analysis By Market Taxonomy, 2020 to 2024
    • Market Size Value (USD Billion) & Volume (Kilotons) Forecast By Market Taxonomy, 2025 to 2035
      • By Country
        • GCC Countries
        • Northern Africa
        • South Africa
        • Turkiye
        • Rest of MEA
      • By Form
      • By Function
      • By Application
    • Market Attractiveness Analysis
      • By Country
      • By Form
      • By Function
      • By Application
    • Key Takeaways
  17. Key Countries Market Analysis
    • USA
      • Pricing Analysis
      • Market Share Analysis, 2024
        • By Form
        • By Function
        • By Application
    • Canada
      • Pricing Analysis
      • Market Share Analysis, 2024
        • By Form
        • By Function
        • By Application
    • Brazil
      • Pricing Analysis
      • Market Share Analysis, 2024
        • By Form
        • By Function
        • By Application
    • Mexico
      • Pricing Analysis
      • Market Share Analysis, 2024
        • By Form
        • By Function
        • By Application
    • Argentina
      • Pricing Analysis
      • Market Share Analysis, 2024
        • By Form
        • By Function
        • By Application
  18. Market Structure Analysis
    • Competition Dashboard
    • Competition Benchmarking
    • Market Share Analysis of Top Players
      • By Regional
      • By Form
      • By Function
      • By Application
  19. Competition Analysis
    • Competition Deep Dive
      • DSM
        • Overview
        • Product Portfolio
        • Profitability by Market Segments (Product/Age /Sales Channel/Region)
        • Sales Footprint
        • Strategy Overview
          • Marketing Strategy
          • Product Strategy
          • Channel Strategy
      • Glanbia plc
        • Overview
        • Product Portfolio
        • Profitability by Market Segments (Product/Age /Sales Channel/Region)
        • Sales Footprint
        • Strategy Overview
          • Marketing Strategy
          • Product Strategy
          • Channel Strategy
      • Vitablend
        • Overview
        • Product Portfolio
        • Profitability by Market Segments (Product/Age /Sales Channel/Region)
        • Sales Footprint
        • Strategy Overview
          • Marketing Strategy
          • Product Strategy
          • Channel Strategy
      • SternVitamin GmbH & Co
        • Overview
        • Product Portfolio
        • Profitability by Market Segments (Product/Age /Sales Channel/Region)
        • Sales Footprint
        • Strategy Overview
          • Marketing Strategy
          • Product Strategy
          • Channel Strategy
      • Watson Inc.
        • Overview
        • Product Portfolio
        • Profitability by Market Segments (Product/Age /Sales Channel/Region)
        • Sales Footprint
        • Strategy Overview
          • Marketing Strategy
          • Product Strategy
          • Channel Strategy
      • Wright Enrichment Inc.
        • Overview
        • Product Portfolio
        • Profitability by Market Segments (Product/Age /Sales Channel/Region)
        • Sales Footprint
        • Strategy Overview
          • Marketing Strategy
          • Product Strategy
          • Channel Strategy
      • Zagro
        • Overview
        • Product Portfolio
        • Profitability by Market Segments (Product/Age /Sales Channel/Region)
        • Sales Footprint
        • Strategy Overview
          • Marketing Strategy
          • Product Strategy
          • Channel Strategy
      • Trouw Nutrition
        • Overview
        • Product Portfolio
        • Profitability by Market Segments (Product/Age /Sales Channel/Region)
        • Sales Footprint
        • Strategy Overview
          • Marketing Strategy
          • Product Strategy
          • Channel Strategy
      • Burkmann Industries, Inc.
        • Overview
        • Product Portfolio
        • Profitability by Market Segments (Product/Age /Sales Channel/Region)
        • Sales Footprint
        • Strategy Overview
          • Marketing Strategy
          • Product Strategy
          • Channel Strategy
      • Bar-Magen LTD Companies
        • Overview
        • Product Portfolio
        • Profitability by Market Segments (Product/Age /Sales Channel/Region)
        • Sales Footprint
        • Strategy Overview
          • Marketing Strategy
          • Product Strategy
          • Channel Strategy
  20. Assumptions & Acronyms Used
  21. Research Methodology

List of Tables

  • Table 1: Global Market Value (USD Billion) Forecast by Region, 2020-2035
  • Table 2: Global Market Volume (Kilotons) Forecast by Region, 2020-2035
  • Table 3: Global Market Value (USD Billion) Forecast by Form, 2020-2035
  • Table 4: Global Market Volume (Kilotons) Forecast by Form, 2020-2035
  • Table 5: Global Market Value (USD Billion) Forecast by Function, 2020-2035
  • Table 6: Global Market Volume (Kilotons) Forecast by Function, 2020-2035
  • Table 7: Global Market Value (USD Billion) Forecast by Application, 2020-2035
  • Table 8: Global Market Volume (Kilotons) Forecast by Application, 2020-2035
  • Table 9: North America Market Value (USD Billion) Forecast by Country, 2020-2035
  • Table 10: North America Market Volume (Kilotons) Forecast by Country, 2020-2035
  • Table 11: North America Market Value (USD Billion) Forecast by Form, 2020-2035
  • Table 12: North America Market Volume (Kilotons) Forecast by Form, 2020-2035
  • Table 13: North America Market Value (USD Billion) Forecast by Function, 2020-2035
  • Table 14: North America Market Volume (Kilotons) Forecast by Function, 2020-2035
  • Table 15: North America Market Value (USD Billion) Forecast by Application, 2020-2035
  • Table 16: North America Market Volume (Kilotons) Forecast by Application, 2020-2035
  • Table 17: Latin America Market Value (USD Billion) Forecast by Country, 2020-2035
  • Table 18: Latin America Market Volume (Kilotons) Forecast by Country, 2020-2035
  • Table 19: Latin America Market Value (USD Billion) Forecast by Form, 2020-2035
  • Table 20: Latin America Market Volume (Kilotons) Forecast by Form, 2020-2035
  • Table 21: Latin America Market Value (USD Billion) Forecast by Function, 2020-2035
  • Table 22: Latin America Market Volume (Kilotons) Forecast by Function, 2020-2035
  • Table 23: Latin America Market Value (USD Billion) Forecast by Application, 2020-2035
  • Table 24: Latin America Market Volume (Kilotons) Forecast by Application, 2020-2035
  • Table 25: Western Europe Market Value (USD Billion) Forecast by Country, 2020-2035
  • Table 26: Western Europe Market Volume (Kilotons) Forecast by Country, 2020-2035
  • Table 27: Western Europe Market Value (USD Billion) Forecast by Form, 2020-2035
  • Table 28: Western Europe Market Volume (Kilotons) Forecast by Form, 2020-2035
  • Table 29: Western Europe Market Value (USD Billion) Forecast by Function, 2020-2035
  • Table 30: Western Europe Market Volume (Kilotons) Forecast by Function, 2020-2035
  • Table 31: Western Europe Market Value (USD Billion) Forecast by Application, 2020-2035
  • Table 32: Western Europe Market Volume (Kilotons) Forecast by Application, 2020-2035
  • Table 33: Eastern Europe Market Value (USD Billion) Forecast by Country, 2020-2035
  • Table 34: Eastern Europe Market Volume (Kilotons) Forecast by Country, 2020-2035
  • Table 35: Eastern Europe Market Value (USD Billion) Forecast by Form, 2020-2035
  • Table 36: Eastern Europe Market Volume (Kilotons) Forecast by Form, 2020-2035
  • Table 37: Eastern Europe Market Value (USD Billion) Forecast by Function, 2020-2035
  • Table 38: Eastern Europe Market Volume (Kilotons) Forecast by Function, 2020-2035
  • Table 39: Eastern Europe Market Value (USD Billion) Forecast by Application, 2020-2035
  • Table 40: Eastern Europe Market Volume (Kilotons) Forecast by Application, 2020-2035
  • Table 41: East Asia Market Value (USD Billion) Forecast by Country, 2020-2035
  • Table 42: East Asia Market Volume (Kilotons) Forecast by Country, 2020-2035
  • Table 43: East Asia Market Value (USD Billion) Forecast by Form, 2020-2035
  • Table 44: East Asia Market Volume (Kilotons) Forecast by Form, 2020-2035
  • Table 45: East Asia Market Value (USD Billion) Forecast by Function, 2020-2035
  • Table 46: East Asia Market Volume (Kilotons) Forecast by Function, 2020-2035
  • Table 47: East Asia Market Value (USD Billion) Forecast by Application, 2020-2035
  • Table 48: East Asia Market Volume (Kilotons) Forecast by Application, 2020-2035
  • Table 49: South Asia & Pacific Market Value (USD Billion) Forecast by Country, 2020-2035
  • Table 50: South Asia & Pacific Market Volume (Kilotons) Forecast by Country, 2020-2035
  • Table 51: South Asia & Pacific Market Value (USD Billion) Forecast by Form, 2020-2035
  • Table 52: South Asia & Pacific Market Volume (Kilotons) Forecast by Form, 2020-2035
  • Table 53: South Asia & Pacific Market Value (USD Billion) Forecast by Function, 2020-2035
  • Table 54: South Asia & Pacific Market Volume (Kilotons) Forecast by Function, 2020-2035
  • Table 55: South Asia & Pacific Market Value (USD Billion) Forecast by Application, 2020-2035
  • Table 56: South Asia & Pacific Market Volume (Kilotons) Forecast by Application, 2020-2035
  • Table 57: Middle East and Africa Market Value (USD Billion) Forecast by Country, 2020-2035
  • Table 58: Middle East and Africa Market Volume (Kilotons) Forecast by Country, 2020-2035
  • Table 59: Middle East and Africa Market Value (USD Billion) Forecast by Form, 2020-2035
  • Table 60: Middle East and Africa Market Volume (Kilotons) Forecast by Form, 2020-2035
  • Table 61: Middle East and Africa Market Value (USD Billion) Forecast by Function, 2020-2035
  • Table 62: Middle East and Africa Market Volume (Kilotons) Forecast by Function, 2020-2035
  • Table 63: Middle East and Africa Market Value (USD Billion) Forecast by Application, 2020-2035
  • Table 64: Middle East and Africa Market Volume (Kilotons) Forecast by Application, 2020-2035

List of Figures

  • Figure 1: Global Market Volume (Kilotons) Forecast 2020-2035
  • Figure 2: Global Market Pricing Analysis
  • Figure 3: Global Market Value (USD Billion) Forecast 2020-2035
  • Figure 4: Global Market Value Share and BPS Analysis by Form, 2025 and 2035
  • Figure 5: Global Market Y-o-Y Growth Comparison by Form, 2025-2035
  • Figure 6: Global Market Attractiveness Analysis by Form
  • Figure 7: Global Market Value Share and BPS Analysis by Function, 2025 and 2035
  • Figure 8: Global Market Y-o-Y Growth Comparison by Function, 2025-2035
  • Figure 9: Global Market Attractiveness Analysis by Function
  • Figure 10: Global Market Value Share and BPS Analysis by Application, 2025 and 2035
  • Figure 11: Global Market Y-o-Y Growth Comparison by Application, 2025-2035
  • Figure 12: Global Market Attractiveness Analysis by Application
  • Figure 13: Global Market Value (USD Billion) Share and BPS Analysis by Region, 2025 and 2035
  • Figure 14: Global Market Y-o-Y Growth Comparison by Region, 2025-2035
  • Figure 15: Global Market Attractiveness Analysis by Region
  • Figure 16: North America Market Incremental $ Opportunity, 2025-2035
  • Figure 17: Latin America Market Incremental $ Opportunity, 2025-2035
  • Figure 18: Western Europe Market Incremental $ Opportunity, 2025-2035
  • Figure 19: Eastern Europe Market Incremental $ Opportunity, 2025-2035
  • Figure 20: East Asia Market Incremental $ Opportunity, 2025-2035
  • Figure 21: South Asia & Pacific Market Incremental $ Opportunity, 2025-2035
  • Figure 22: Middle East and Africa Market Incremental $ Opportunity, 2025-2035
  • Figure 23: North America Market Value Share and BPS Analysis by Country, 2025 and 2035
  • Figure 24: North America Market Value Share and BPS Analysis by Form, 2025 and 2035
  • Figure 25: North America Market Y-o-Y Growth Comparison by Form, 2025-2035
  • Figure 26: North America Market Attractiveness Analysis by Form
  • Figure 27: North America Market Value Share and BPS Analysis by Function, 2025 and 2035
  • Figure 28: North America Market Y-o-Y Growth Comparison by Function, 2025-2035
  • Figure 29: North America Market Attractiveness Analysis by Function
  • Figure 30: North America Market Value Share and BPS Analysis by Application, 2025 and 2035
  • Figure 31: North America Market Y-o-Y Growth Comparison by Application, 2025-2035
  • Figure 32: North America Market Attractiveness Analysis by Application
  • Figure 33: Latin America Market Value Share and BPS Analysis by Country, 2025 and 2035
  • Figure 34: Latin America Market Value Share and BPS Analysis by Form, 2025 and 2035
  • Figure 35: Latin America Market Y-o-Y Growth Comparison by Form, 2025-2035
  • Figure 36: Latin America Market Attractiveness Analysis by Form
  • Figure 37: Latin America Market Value Share and BPS Analysis by Function, 2025 and 2035
  • Figure 38: Latin America Market Y-o-Y Growth Comparison by Function, 2025-2035
  • Figure 39: Latin America Market Attractiveness Analysis by Function
  • Figure 40: Latin America Market Value Share and BPS Analysis by Application, 2025 and 2035
  • Figure 41: Latin America Market Y-o-Y Growth Comparison by Application, 2025-2035
  • Figure 42: Latin America Market Attractiveness Analysis by Application
  • Figure 43: Western Europe Market Value Share and BPS Analysis by Country, 2025 and 2035
  • Figure 44: Western Europe Market Value Share and BPS Analysis by Form, 2025 and 2035
  • Figure 45: Western Europe Market Y-o-Y Growth Comparison by Form, 2025-2035
  • Figure 46: Western Europe Market Attractiveness Analysis by Form
  • Figure 47: Western Europe Market Value Share and BPS Analysis by Function, 2025 and 2035
  • Figure 48: Western Europe Market Y-o-Y Growth Comparison by Function, 2025-2035
  • Figure 49: Western Europe Market Attractiveness Analysis by Function
  • Figure 50: Western Europe Market Value Share and BPS Analysis by Application, 2025 and 2035
  • Figure 51: Western Europe Market Y-o-Y Growth Comparison by Application, 2025-2035
  • Figure 52: Western Europe Market Attractiveness Analysis by Application
  • Figure 53: Eastern Europe Market Value Share and BPS Analysis by Country, 2025 and 2035
  • Figure 54: Eastern Europe Market Value Share and BPS Analysis by Form, 2025 and 2035
  • Figure 55: Eastern Europe Market Y-o-Y Growth Comparison by Form, 2025-2035
  • Figure 56: Eastern Europe Market Attractiveness Analysis by Form
  • Figure 57: Eastern Europe Market Value Share and BPS Analysis by Function, 2025 and 2035
  • Figure 58: Eastern Europe Market Y-o-Y Growth Comparison by Function, 2025-2035
  • Figure 59: Eastern Europe Market Attractiveness Analysis by Function
  • Figure 60: Eastern Europe Market Value Share and BPS Analysis by Application, 2025 and 2035
  • Figure 61: Eastern Europe Market Y-o-Y Growth Comparison by Application, 2025-2035
  • Figure 62: Eastern Europe Market Attractiveness Analysis by Application
  • Figure 63: East Asia Market Value Share and BPS Analysis by Country, 2025 and 2035
  • Figure 64: East Asia Market Value Share and BPS Analysis by Form, 2025 and 2035
  • Figure 65: East Asia Market Y-o-Y Growth Comparison by Form, 2025-2035
  • Figure 66: East Asia Market Attractiveness Analysis by Form
  • Figure 67: East Asia Market Value Share and BPS Analysis by Function, 2025 and 2035
  • Figure 68: East Asia Market Y-o-Y Growth Comparison by Function, 2025-2035
  • Figure 69: East Asia Market Attractiveness Analysis by Function
  • Figure 70: East Asia Market Value Share and BPS Analysis by Application, 2025 and 2035
  • Figure 71: East Asia Market Y-o-Y Growth Comparison by Application, 2025-2035
  • Figure 72: East Asia Market Attractiveness Analysis by Application
  • Figure 73: South Asia & Pacific Market Value Share and BPS Analysis by Country, 2025 and 2035
  • Figure 74: South Asia & Pacific Market Value Share and BPS Analysis by Form, 2025 and 2035
  • Figure 75: South Asia & Pacific Market Y-o-Y Growth Comparison by Form, 2025-2035
  • Figure 76: South Asia & Pacific Market Attractiveness Analysis by Form
  • Figure 77: South Asia & Pacific Market Value Share and BPS Analysis by Function, 2025 and 2035
  • Figure 78: South Asia & Pacific Market Y-o-Y Growth Comparison by Function, 2025-2035
  • Figure 79: South Asia & Pacific Market Attractiveness Analysis by Function
  • Figure 80: South Asia & Pacific Market Value Share and BPS Analysis by Application, 2025 and 2035
  • Figure 81: South Asia & Pacific Market Y-o-Y Growth Comparison by Application, 2025-2035
  • Figure 82: South Asia & Pacific Market Attractiveness Analysis by Application
  • Figure 83: Middle East and Africa Market Value Share and BPS Analysis by Country, 2025 and 2035
  • Figure 84: Middle East and Africa Market Value Share and BPS Analysis by Form, 2025 and 2035
  • Figure 85: Middle East and Africa Market Y-o-Y Growth Comparison by Form, 2025-2035
  • Figure 86: Middle East and Africa Market Attractiveness Analysis by Form
  • Figure 87: Middle East and Africa Market Value Share and BPS Analysis by Function, 2025 and 2035
  • Figure 88: Middle East and Africa Market Y-o-Y Growth Comparison by Function, 2025-2035
  • Figure 89: Middle East and Africa Market Attractiveness Analysis by Function
  • Figure 90: Middle East and Africa Market Value Share and BPS Analysis by Application, 2025 and 2035
  • Figure 91: Middle East and Africa Market Y-o-Y Growth Comparison by Application, 2025-2035
  • Figure 92: Middle East and Africa Market Attractiveness Analysis by Application
  • Figure 93: Global Market - Tier Structure Analysis
  • Figure 94: Global Market - Company Share Analysis

Frequently Asked Questions

What is the projected size of the vitamin premix market in 2025?

The market is valued at USD 1.5 billion in 2025.

What is the outlook on vitamin premix demand by 2035?

The market is forecasted to reach USD 3.6 billion by 2035, reflecting a CAGR of 7.9%.

Which form leads the vitamin premix market in 2025?

Powder form is expected to lead the market with a 66.4% share in 2025.

What is the projected share of the food sector in vitamin premix applications by 2025?

The food sector is projected to hold a 40% share of the market in 2025.

Which country is projected to have the fastest-growing vitamin premix market?

Japan is anticipated to be the fastest-growing market with a CAGR of 8.0% from 2025 to 2035.

Explore Similar Insights

Future Market Insights

Vitamin Premix Market