Vitamin Patches Market Size and Share Forecast Outlook 2025 to 2035

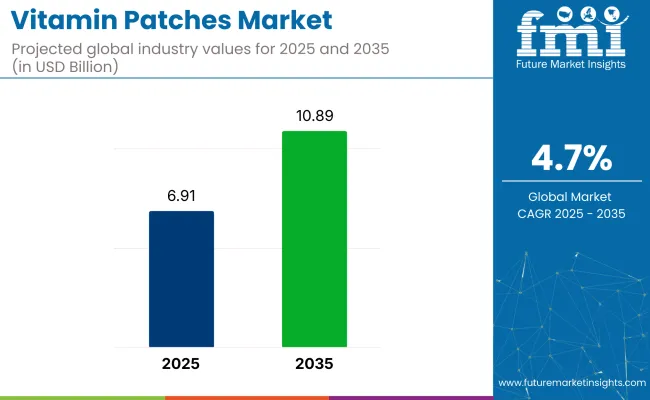
The global vitamin patches market is valued at USD 6.91 billion in 2025 and is projected to reach USD 10.89 billion by 2035, reflecting a CAGR of 4.7%. This growth is expected to be driven by rising health and wellness awareness, increasing consumer preference for non-invasive delivery systems, and technological advancements in transdermal formulations.
Quick Stats for Vitamin Patches Market

  • Market Value (2025): USD 6.91 billion
  • Forecast Value (2035): USD 10.89 billion
  • Forecast CAGR: 4.7%
  • Sales Channel Leader in 2025: Online (55% Market Share)
  • Top Patch Size Segment: Below & Upto 10 cm²(48% Market Share in 2025)
  • Key Growth Region: North America (USA is the fastest-growing market with 5.0% CAGR)
Metric Value
Market Value (2025) USD 6.91 billion
Market Value (2035) USD 10.89 billion
CAGR (2025 to 2035) 4.7%

Additionally, market expansion will be supported by strategic collaborations, research investments for new formulations, and the demand for preventive healthcare solutions worldwide.

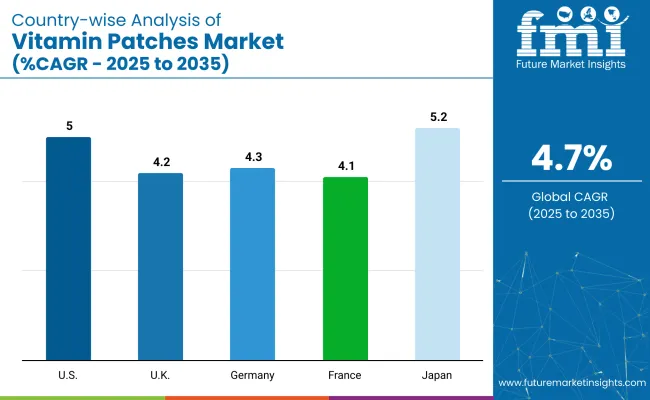
Japan is projected to hold the highest CAGR of 5.2% from 2025 to 2035, driven by strong demand for beauty-enhancing vitamin patches and advancements in transdermal technologies. The United States follows with a CAGR of 5.0%, supported by rising consumer preference for convenient, non-invasive supplementation solutions.

Germany is expected to register a steady CAGR of 4.3%, attributed to increasing demand for natural and herbal vitamin patches alongside robust regulatory standards ensuring product safety and quality. The online sales channel segment is expected to dominate the market with a 55% share in 2025, followed by below & upto 10 cm² patches holding a 48% market share due to effective absorption.

Government regulations are increasingly emphasising the safety, efficacy, and quality of vitamin patches, requiring manufacturers to adhere to stringent guidelines for transdermal products, including FDA and EMA approvals for health claims and ingredient transparency. Recent innovations have focused on developing advanced micro-reservoir systems for controlled nutrient release, hydrogel adhesives for better skin compatibility, and smart patches integrated with wearable sensors for real-time nutrient monitoring.

The vitamin patches market accounts for a small but growing share within its parent markets. It is estimated to hold around 3-5% of the overall food supplements and nutrition market, given its niche but expanding application. Within the transdermal drug delivery systems market, vitamin patches contribute approximately 6-8%, driven by rising consumer acceptance of non-invasive delivery methods.

In the broader nutraceuticals market, the share remains around 2-3%, while in the personal care and wellness market, it accounts for nearly 1-2%, reflecting its specialised position focused on preventive health, targeted nutrient delivery, and emerging smart patch innovations.

Analyzing Vitamin Patches Market by Top Investment Segments

The vitamin patches market is segmented by product type, adhesive type, application, sales channel, patch size, and region. By product type, the market is segmented into drug-in-adhesive, matrix patches, reservoir membrane patches, microneedle patches, micro-reservoir system, and vapor patches.

By adhesive type, it is classified into non-adhesive type, acrylic adhesives, silicone adhesives, hydrogel adhesives, and other adhesive types. By application, it is divided into pain management, CNS (central nervous system), respiratory, NRT (nicotine replacement therapy), cosmetics, and other applications.

By sales channel, it is segmented into online and offline. By patch size, it is segmented into below & upto 10 cm², 11-30 cm², and 31 & above cm². By region, the market is analyzed across North America, Latin America, Western Europe, Eastern Europe, East Asia, South Asia & Pacific, and MEA.

Drug-In-Adhesive to Lead Product Type Segment with Over 30.8% Market Share in 2025

The drug-in-adhesive segment is anticipated to hold the largest market share of 30.8% in 2025.

  • Additionally, its ease of formulation integration makes it highly preferred by manufacturers aiming for efficient transdermal delivery systems.
  • The segment’s popularity is further supported by its cost-effectiveness and compatibility with various vitamins, positioning it as the most lucrative product type in the vitamin patches market globally.

Hydrogel Adhesives to Lead Adhesive Type Segment with Over 15.2% Market Share in 2025

The hydrogel adhesives segment is expected to hold a significant market share of 15.2% in 2025, driven by its superior moisture retention and skin compatibility properties.

  • This adhesive type is highly preferred for vitamin patches due to its ability to enhance user comfort, reduce skin irritation, and provide effective nutrient absorption.
  • These adhesives are flexible and soothing nature makes it ideal for consumers with sensitive skin, positioning hydrogel adhesives as the most lucrative segment.

Pain Management to Lead Application Segment with Over 35% Market Share in 2025

The pain management segment is expected to hold the largest market share of 35% in 2025,

  • The segment is driven by the high demand for non-invasive pain relief solutions that provide targeted and continuous therapeutic effects.
  • Vitamin patches for pain management are preferred for their ease of use, sustained release, and ability to reduce discomfort without causing gastrointestinal side effects.

Online to Lead Sales Channel Segment with Over 55% Market Share in 2025

The online sales channel segment is expected to hold the largest market share of around 55% in 2025.
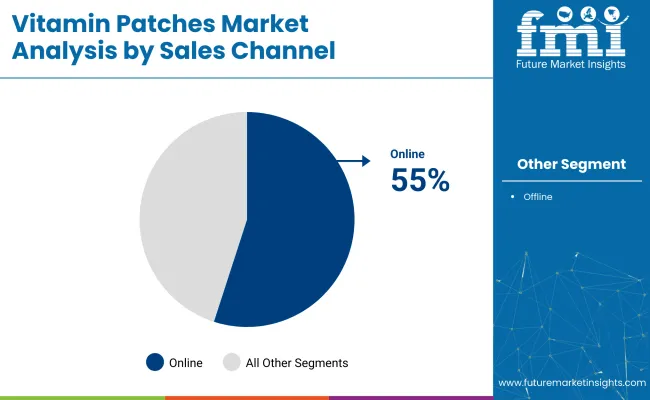
  • This dominance is driven by the increasing consumer preference for convenient purchasing options, wide product availability, and attractive discounts offered by online platforms.
  • Additionally, the rise in e-commerce penetration and digital marketing strategies adopted by manufacturers has boosted online sales, making it the most lucrative segment under the sales channel for the vitamin patches market globally.

Below & Upto 10 cm² Patches to Lead Patch Size Segment with Over 48% Market Share in 2025

The below & upto 10 cm² patch size segment is expected to hold the largest market share of 48% in 2025.
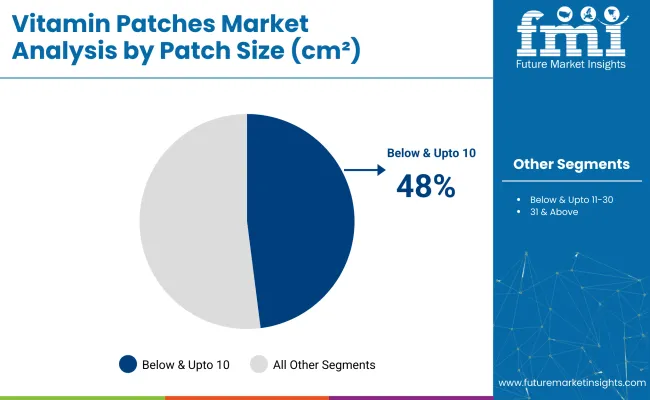
  • This is attributed to its ease of application, discreet appearance, and suitability for daily use without causing discomfort.
  • These smaller patches are highly preferred for vitamin delivery as they offer effective absorption while being convenient and comfortable for consumers.

Vitamin Patches Market Dynamics

The vitamin patches market is experiencing steady growth, driven by rising consumer preference for non-invasive nutrient delivery, increasing health and wellness awareness, and continuous innovations in transdermal technologies, including micro-reservoir and hydrogel adhesive systems, alongside growing demand for convenient and effective supplementation solutions.

Recent Trends in the Vitamin Patches Market

  • Increasing adoption of micro-reservoir and microneedle patch technologies for enhanced nutrient delivery.
  • Rising popularity of hydrogel adhesive patches for better skin compatibility and moisture retention.
  • Launch of smart vitamin patches integrated with wearable health monitoring sensors.
  • Development of customised patches targeting specific health and beauty needs, such as skin hydration and energy support.

Challenges in the Vitamin Patches Market
  • Stringent regulatory approvals are required for transdermal supplement products.
  • Limited consumer awareness in emerging markets affects sales potential.
  • High production costs associated with advanced patch formulations.
  • Intense competition among existing and new market players is impacting pricing strategies.

Analyzing Top Countries Using and Distributing Vitamin Patches

Among the top countries, Japan is projected to record the highest growth with a CAGR of 5.2%, driven by rising demand for beauty-enhancing vitamin patches and strong technological expertise. The United States follows closely with a CAGR of 5.0%, supported by high adoption of transdermal health supplements.

Germany and the United Kingdom are expected to grow at CAGRs of 4.3% and 4.2%, respectively, owing to increasing consumer preference for natural, vegan, and herbal patches. France will see a comparatively moderate growth at a CAGR of 4.1%, driven by discreet beauty and skincare vitamin patch demand in urban markets.

The report covers an in-depth analysis of 40+ countries; five top-performing OECD countries are highlighted below.

USA Vitamin Patches Market Analysis

The USA vitamin patches market is projected to grow at a CAGR of 5.0% from 2025 to 2035. Leading companies focus on developing multi-vitamin patches with enhanced bioavailability to cater to the wellness-focused consumer base.

  • Growing consumer preference for convenient nutrient delivery systems.
  • High adoption of transdermal technologies in healthcare supplements.
  • Expansion of online and retail pharmacy sales channels.
  • Rising investments in research to launch innovative formulations.

Vitamin Patches Demand Analysis in the UK

Sales of vitamin patches in the UK are expected to register a steady CAGR of 4.2% from 2025 to 2035.

  • Rising demand for vegan and cruelty-free vitamin patches.
  • Growing health and wellness trends among millennials.
  • Expansion of e-commerce platforms for easy accessibility.
  • Strategic partnerships with pharmacies and health stores.

Vitamin Patches Demand Analysis in Germany

Germany’s vitamin patches market is anticipated to grow at a CAGR of 4.3% from 2025 to 2035.

  • High demand for natural and herbal vitamin patches.
  • Strong regulatory framework ensuring product quality.
  • Increasing consumer expenditure on health supplements.
  • Rising popularity of patches for energy and immunity support.

France Vitamin Patches Market Analysis

Sales of vitamin patches in France are projected to grow at a CAGR of 4.1% from 2025 to 2035.

  • Rising popularity of discreet vitamin patches among urban users.
  • Strong distribution through pharmacies and wellness stores.
  • Growing interest in vitamin patches for beauty and skincare benefits.
  • Presence of local startups focusing on premium patch offerings.

Japan Vitamin Patches Market Analysis

Japan’s vitamin patches revenue is expected to grow at a CAGR of 5.2% from 2025 to 2035.

  • Rising demand for beauty-enhancing vitamin patches.
  • Strong technological expertise in transdermal systems.
  • High consumer trust in local brands for quality assurance.
  • Innovations targeting hydration and anti-aging benefits.

Leading Vitamin Patches Manufacturers and Suppliers

The market is relatively fragmented, with numerous tier-one and tier-two players competing based on product innovation, pricing, and regional expansion strategies. Leading companies are focusing on developing advanced transdermal technologies, launching customised formulations, and leveraging online sales channels to increase their market share.

Top players like Patch MD, B12 Patch, and Mary Ruth Organics are competing through continuous product innovations, introduction of multi-nutrient patches, and expansion into Asian and European markets to capture the rising demand for non-invasive wellness solutions.

Recent Vitamin Patches Industry News

  • In February 2024, NOW Foods introduced a Sambucus (elderberry) + zinc lozenge supplement, capitalizing on the rising demand for immune health products. (Source: NOW Foods)

Vitamin Patches Market - Report Scope

Report Attributes Details
Current Total Market Size (2025) USD 6.91 billion
Projected Market Size (2035) USD 10.89 billion
CAGR (2025 to 2035) 4.7%
Base Year for Estimation 2024
Historical Period 2020 to 2024
Projections Period 2025 to 2035
Market Analysis Parameters Revenue in USD billion/Volume in million unit
By Product Type Drug-In-Adhesive, Matrix Patches, Reservoir Membrane Patches, Microneedle Patches, Micro-Reservoir System, Vapor Patches
By Adhesive Type Non-Adhesive Type, Acrylic Adhesives, Silicone Adhesives, Hydrogel Adhesives, Other Adhesive Types
By Application Pain Management, CNS (Central Nervous System), Respiratory, NRT (Nicotine Replacement Therapy), Cosmetics, Other Applications
By Sales Channel Online, Offline
By Patch Size (cm²) Below & Upto 10, 11-30, 31 & Above
Regions Covered North America, Latin America, Western Europe, Eastern Europe, East Asia, South Asia & Pacific, Middle East & Africa
Countries Covered United States, Canada, United Kingdom, Germany, France, China, Japan, South Korea, Brazil, Australia
Key Players Nutraceuticals International Group, Nutrivend, Vita Patch, Vitamin Patch Company, Mary Ruth Organics, B12 Patch, Pillars of Wellness, Vitality Patch, Zahler, Vital Patch, Well Patch, Skinner Health, Aviva, Sundown Naturals, Life AID, Nutra Blast, Vita patch, Pepin Mfg,Mco Hospital Aids Pvt. Ltd, Bytox.
Additional Attributes Dollar sales by value, market share analysis by region, and country-wise analysis.

Key Segmentation

By Product Type:

As per product type, the industry has been categorized in Reservoir Membrane Patches, DIA (Single-Vitamin Patch, and Multi-Vitamin Patch), Vapour Patches, Matrix Patches, Microneedle Patches, and Micro-Reservoir System.

By Adhesive Type:

As per adhesive type, the industry has been categorized into Non-Adhesive Type, Acrylic Adhesives, Silicone Adhesives, Hydrogel Adhesives, and Other Adhesive Types.

By Application:

This segment is further categorized in CNS, Pain Management (Cancer Pain, Severe Chronic Pain, Pain & Inflammation, and Post-herpetic neuralgia), Respiratory, NRT (Nicotine Replacement Therapy), Cosmetics and Other Applications.

By Sales Channel:

As per sales channel, the industry has been categorized into Online, and Offline (Modern Trade, Pharma/ Drug Store, and Other Store Based).

By Patch Size (cm2):

This segment is further categorized into Below & Upto 10 cm2, 11-30 cm2, and 31 cm2 & above.

By Region:

Industry analysis has been carried out in key countries of North America, Latin America, Europe, East Asia, South Asia, Oceania, and the Middle East & Africa.

Table of Content

  1. Executive Summary
    • Global Market Outlook
    • Demand-side Trends
    • Supply-side Trends
    • Technology Roadmap Analysis
    • Analysis and Recommendations
  2. Market Overview
    • Market Coverage/Taxonomy
    • Market Definition/Scope/Limitations
  3. Market Background
    • Market Dynamics
      • Drivers
      • Restraints
      • Opportunity
      • Trends
    • Scenario Forecast
      • Demand in Optimistic Scenario
      • Demand in Likely Scenario
      • Demand in Conservative Scenario
    • Opportunity Map Analysis
    • Product Life Cycle Analysis
    • Supply Chain Analysis
      • Supply Side Participants and their Roles
        • Producers
        • Mid-Level Participants (Traders/ Agents/ Brokers)
        • Wholesalers and Distributors
      • Value Added and Value Created at Node in the Supply Chain
      • List of Raw Material Suppliers
      • List of Existing and Potential Buyer’s
    • Investment Feasibility Matrix
    • Value Chain Analysis
      • Profit Margin Analysis
      • Wholesalers and Distributors
      • Retailers
    • PESTLE and Porter’s Analysis
    • Regulatory Landscape
      • By Key Regions
      • By Key Countries
    • Regional Parent Market Outlook
    • Production and Consumption Statistics
    • Import and Export Statistics
  4. Global Market Analysis 2020 to 2024 and Forecast, 2025 to 2035
    • Historical Market Size Value (USD Billion) & Volume (Million Units) Analysis, 2020 to 2024
    • Current and Future Market Size Value (USD Billion) & Volume (Million Units) Projections, 2025 to 2035
      • Y-o-Y Growth Trend Analysis
      • Absolute $ Opportunity Analysis
  5. Global Market Pricing Analysis 2020 to 2024 and Forecast 2025 to 2035
  6. Global Market Analysis 2020 to 2024 and Forecast 2025 to 2035, By Product Type
    • Introduction/Key Findings
    • Historical Market Size Value (USD Billion) & Volume (Million Units) Analysis By Product Type, 2020 to 2024
    • Current and Future Market Size Value (USD Billion) & Volume (Million Units) Analysis and Forecast By Product Type, 2025 to 2035
      • Drug-In-Adhesive
      • Matrix Patches
      • Reservoir Membrane Patches
      • Microneedle Patches
      • Micro-Reservoir System
      • Vapor Patches
    • Y-o-Y Growth Trend Analysis By Product Type, 2020 to 2024
    • Absolute $ Opportunity Analysis By Product Type, 2025 to 2035
  7. Global Market Analysis 2020 to 2024 and Forecast 2025 to 2035, By Adhesive Type
    • Introduction/Key Findings
    • Historical Market Size Value (USD Billion) & Volume (Million Units) Analysis By Adhesive Type, 2020 to 2024
    • Current and Future Market Size Value (USD Billion) & Volume (Million Units) Analysis and Forecast By Adhesive Type, 2025 to 2035
      • Non-Adhesive Type
      • Acrylic Adhesives
      • Silicone Adhesives
      • Hydrogel Adhesives
      • Other Adhesive Types
    • Y-o-Y Growth Trend Analysis By Adhesive Type, 2020 to 2024
    • Absolute $ Opportunity Analysis By Adhesive Type, 2025 to 2035
  8. Global Market Analysis 2020 to 2024 and Forecast 2025 to 2035, By Application
    • Introduction/Key Findings
    • Historical Market Size Value (USD Billion) & Volume (Million Units) Analysis By Application, 2020 to 2024
    • Current and Future Market Size Value (USD Billion) & Volume (Million Units) Analysis and Forecast By Application, 2025 to 2035
      • Pain Management
      • CNS (Central Nervous System)
      • Respiratory
      • NRT (Nicotine Replacement Therapy)
      • Cosmetics
      • Other Applications
    • Y-o-Y Growth Trend Analysis By Application, 2020 to 2024
    • Absolute $ Opportunity Analysis By Application, 2025 to 2035
  9. Global Market Analysis 2020 to 2024 and Forecast 2025 to 2035, By Sales Channel
    • Introduction/Key Findings
    • Historical Market Size Value (USD Billion) & Volume (Million Units) Analysis By Sales Channel, 2020 to 2024
    • Current and Future Market Size Value (USD Billion) & Volume (Million Units) Analysis and Forecast By Sales Channel, 2025 to 2035
      • Online
      • Offline
    • Y-o-Y Growth Trend Analysis By Sales Channel, 2020 to 2024
    • Absolute $ Opportunity Analysis By Sales Channel, 2025 to 2035
  10. Global Market Analysis 2020 to 2024 and Forecast 2025 to 2035, By Patch Size (cm2)
    • Introduction/Key Findings
    • Historical Market Size Value (USD Billion) & Volume (Million Units) Analysis By Patch Size (cm2), 2020 to 2024
    • Current and Future Market Size Value (USD Billion) & Volume (Million Units) Analysis and Forecast By Patch Size (cm2), 2025 to 2035
      • Below & Upto 10
      • 11 to 30
      • 31 & Above
    • Y-o-Y Growth Trend Analysis By Patch Size (cm2), 2020 to 2024
    • Absolute $ Opportunity Analysis By Patch Size (cm2), 2025 to 2035
  11. Global Market Analysis 2020 to 2024 and Forecast 2025 to 2035, By Region
    • Introduction
    • Historical Market Size Value (USD Billion) & Volume (Million Units) Analysis By Region, 2020 to 2024
    • Current Market Size Value (USD Billion) & Volume (Million Units) Analysis and Forecast By Region, 2025 to 2035
      • U.S.
      • Latin America
      • Western Europe
      • Eastern Europe
      • East Asia
      • South Asia & Pacific
      • Middle East and Africa
    • Market Attractiveness Analysis By Region
  12. U.S. Market Analysis 2020 to 2024 and Forecast 2025 to 2035, By Country
    • Historical Market Size Value (USD Billion) & Volume (Million Units) Trend Analysis By Market Taxonomy, 2020 to 2024
    • Market Size Value (USD Billion) & Volume (Million Units) Forecast By Market Taxonomy, 2025 to 2035
      • By Country
        • Canada
        • Brazil
        • Mexico
        • Argentina
      • By Product Type
      • By Adhesive Type
      • By Application
      • By Sales Channel
      • By Patch Size (cm2)
    • Market Attractiveness Analysis
      • By Country
      • By Product Type
      • By Adhesive Type
      • By Application
      • By Sales Channel
      • By Patch Size (cm2)
    • Key Takeaways
  13. Latin America Market Analysis 2020 to 2024 and Forecast 2025 to 2035, By Country
    • Historical Market Size Value (USD Billion) & Volume (Million Units) Trend Analysis By Market Taxonomy, 2020 to 2024
    • Market Size Value (USD Billion) & Volume (Million Units) Forecast By Market Taxonomy, 2025 to 2035
      • By Country
        • Brazil
        • Argentina
        • Rest of LATAM
      • By Product Type
      • By Adhesive Type
      • By Application
      • By Sales Channel
      • By Patch Size (cm2)
    • Market Attractiveness Analysis
      • By Country
      • By Product Type
      • By Adhesive Type
      • By Application
      • By Sales Channel
      • By Patch Size (cm2)
    • Key Takeaways
  14. Western Europe Market Analysis 2020 to 2024 and Forecast 2025 to 2035, By Country
    • Historical Market Size Value (USD Billion) & Volume (Million Units) Trend Analysis By Market Taxonomy, 2020 to 2024
    • Market Size Value (USD Billion) & Volume (Million Units) Forecast By Market Taxonomy, 2025 to 2035
      • By Country
        • Germany
        • Italy
        • France
        • UK
        • Spain
        • BENELUX
        • Nordic
        • Rest of W.Europe
      • By Product Type
      • By Adhesive Type
      • By Application
      • By Sales Channel
      • By Patch Size (cm2)
    • Market Attractiveness Analysis
      • By Country
      • By Product Type
      • By Adhesive Type
      • By Application
      • By Sales Channel
      • By Patch Size (cm2)
    • Key Takeaways
  15. Eastern Europe Market Analysis 2020 to 2024 and Forecast 2025 to 2035, By Country
    • Historical Market Size Value (USD Billion) & Volume (Million Units) Trend Analysis By Market Taxonomy, 2020 to 2024
    • Market Size Value (USD Billion) & Volume (Million Units) Forecast By Market Taxonomy, 2025 to 2035
      • By Country
        • Russia
        • Hungary
        • Poland
        • Balkan & Baltics
        • Rest of E. Europe
      • By Product Type
      • By Adhesive Type
      • By Application
      • By Sales Channel
      • By Patch Size (cm2)
    • Market Attractiveness Analysis
      • By Country
      • By Product Type
      • By Adhesive Type
      • By Application
      • By Sales Channel
      • By Patch Size (cm2)
    • Key Takeaways
  16. East Asia Market Analysis 2020 to 2024 and Forecast 2025 to 2035, By Country
    • Historical Market Size Value (USD Billion) & Volume (Million Units) Trend Analysis By Market Taxonomy, 2020 to 2024
    • Market Size Value (USD Billion) & Volume (Million Units) Forecast By Market Taxonomy, 2025 to 2035
      • By Country
        • China
        • Japan
        • South Korea
      • By Product Type
      • By Adhesive Type
      • By Application
      • By Sales Channel
      • By Patch Size (cm2)
    • Market Attractiveness Analysis
      • By Country
      • By Product Type
      • By Adhesive Type
      • By Application
      • By Sales Channel
      • By Patch Size (cm2)
    • Key Takeaways
  17. South Asia & Pacific Market Analysis 2020 to 2024 and Forecast 2025 to 2035, By Country
    • Historical Market Size Value (USD Billion) & Volume (Million Units) Trend Analysis By Market Taxonomy, 2020 to 2024
    • Market Size Value (USD Billion) & Volume (Million Units) Forecast By Market Taxonomy, 2025 to 2035
      • By Country
        • India
        • Australia & New Zealand
        • ASEAN
        • Rest of SAP
      • By Product Type
      • By Adhesive Type
      • By Application
      • By Sales Channel
      • By Patch Size (cm2)
    • Market Attractiveness Analysis
      • By Country
      • By Product Type
      • By Adhesive Type
      • By Application
      • By Sales Channel
      • By Patch Size (cm2)
    • Key Takeaways
  18. Middle East and Africa Market Analysis 2020 to 2024 and Forecast 2025 to 2035, By Country
    • Historical Market Size Value (USD Billion) & Volume (Million Units) Trend Analysis By Market Taxonomy, 2020 to 2024
    • Market Size Value (USD Billion) & Volume (Million Units) Forecast By Market Taxonomy, 2025 to 2035
      • By Country
        • GCC Countries
        • Northern Africa
        • South Africa
        • Turkiye
        • Rest of MEA
      • By Product Type
      • By Adhesive Type
      • By Application
      • By Sales Channel
      • By Patch Size (cm2)
    • Market Attractiveness Analysis
      • By Country
      • By Product Type
      • By Adhesive Type
      • By Application
      • By Sales Channel
      • By Patch Size (cm2)
    • Key Takeaways
  19. Key Countries Market Analysis
    • U.S.
      • Pricing Analysis
      • Market Share Analysis, 2024
        • By Product Type
        • By Adhesive Type
        • By Application
        • By Sales Channel
        • By Patch Size (cm2)
    • Canada
      • Pricing Analysis
      • Market Share Analysis, 2024
        • By Product Type
        • By Adhesive Type
        • By Application
        • By Sales Channel
        • By Patch Size (cm2)
    • Brazil
      • Pricing Analysis
      • Market Share Analysis, 2024
        • By Product Type
        • By Adhesive Type
        • By Application
        • By Sales Channel
        • By Patch Size (cm2)
    • Mexico
      • Pricing Analysis
      • Market Share Analysis, 2024
        • By Product Type
        • By Adhesive Type
        • By Application
        • By Sales Channel
        • By Patch Size (cm2)
    • Argentina
      • Pricing Analysis
      • Market Share Analysis, 2024
        • By Product Type
        • By Adhesive Type
        • By Application
        • By Sales Channel
        • By Patch Size (cm2)
  20. Market Structure Analysis
    • Competition Dashboard
    • Competition Benchmarking
    • Market Share Analysis of Top Players
      • By Regional
      • By Product Type
      • By Adhesive Type
      • By Application
      • By Sales Channel
      • By Patch Size (cm2)
  21. Competition Analysis
    • Competition Deep Dive
      • Nutraceuticals International Group
        • Overview
        • Product Portfolio
        • Profitability by Market Segments (Product/Age /Sales Channel/Region)
        • Sales Footprint
        • Strategy Overview
          • Marketing Strategy
          • Product Strategy
          • Channel Strategy
      • Nutrivend
        • Overview
        • Product Portfolio
        • Profitability by Market Segments (Product/Age /Sales Channel/Region)
        • Sales Footprint
        • Strategy Overview
          • Marketing Strategy
          • Product Strategy
          • Channel Strategy
      • VitaPatch
        • Overview
        • Product Portfolio
        • Profitability by Market Segments (Product/Age /Sales Channel/Region)
        • Sales Footprint
        • Strategy Overview
          • Marketing Strategy
          • Product Strategy
          • Channel Strategy
      • Vitamin Patch Company
        • Overview
        • Product Portfolio
        • Profitability by Market Segments (Product/Age /Sales Channel/Region)
        • Sales Footprint
        • Strategy Overview
          • Marketing Strategy
          • Product Strategy
          • Channel Strategy
      • MaryRuth Organics
        • Overview
        • Product Portfolio
        • Profitability by Market Segments (Product/Age /Sales Channel/Region)
        • Sales Footprint
        • Strategy Overview
          • Marketing Strategy
          • Product Strategy
          • Channel Strategy
      • B12 Patch
        • Overview
        • Product Portfolio
        • Profitability by Market Segments (Product/Age /Sales Channel/Region)
        • Sales Footprint
        • Strategy Overview
          • Marketing Strategy
          • Product Strategy
          • Channel Strategy
      • Pillars of Wellness
        • Overview
        • Product Portfolio
        • Profitability by Market Segments (Product/Age /Sales Channel/Region)
        • Sales Footprint
        • Strategy Overview
          • Marketing Strategy
          • Product Strategy
          • Channel Strategy
      • Vitality Patch
        • Overview
        • Product Portfolio
        • Profitability by Market Segments (Product/Age /Sales Channel/Region)
        • Sales Footprint
        • Strategy Overview
          • Marketing Strategy
          • Product Strategy
          • Channel Strategy
      • Zahler
        • Overview
        • Product Portfolio
        • Profitability by Market Segments (Product/Age /Sales Channel/Region)
        • Sales Footprint
        • Strategy Overview
          • Marketing Strategy
          • Product Strategy
          • Channel Strategy
      • Vital Patch
        • Overview
        • Product Portfolio
        • Profitability by Market Segments (Product/Age /Sales Channel/Region)
        • Sales Footprint
        • Strategy Overview
          • Marketing Strategy
          • Product Strategy
          • Channel Strategy
      • WellPatch
        • Overview
        • Product Portfolio
        • Profitability by Market Segments (Product/Age /Sales Channel/Region)
        • Sales Footprint
        • Strategy Overview
          • Marketing Strategy
          • Product Strategy
          • Channel Strategy
      • Skinner Health
        • Overview
        • Product Portfolio
        • Profitability by Market Segments (Product/Age /Sales Channel/Region)
        • Sales Footprint
        • Strategy Overview
          • Marketing Strategy
          • Product Strategy
          • Channel Strategy
      • Aviva
        • Overview
        • Product Portfolio
        • Profitability by Market Segments (Product/Age /Sales Channel/Region)
        • Sales Footprint
        • Strategy Overview
          • Marketing Strategy
          • Product Strategy
          • Channel Strategy
      • Sundown Naturals
        • Overview
        • Product Portfolio
        • Profitability by Market Segments (Product/Age /Sales Channel/Region)
        • Sales Footprint
        • Strategy Overview
          • Marketing Strategy
          • Product Strategy
          • Channel Strategy
      • LifeAID
        • Overview
        • Product Portfolio
        • Profitability by Market Segments (Product/Age /Sales Channel/Region)
        • Sales Footprint
        • Strategy Overview
          • Marketing Strategy
          • Product Strategy
          • Channel Strategy
      • NutraBlast
        • Overview
        • Product Portfolio
        • Profitability by Market Segments (Product/Age /Sales Channel/Region)
        • Sales Footprint
        • Strategy Overview
          • Marketing Strategy
          • Product Strategy
          • Channel Strategy
      • Vitapatch
        • Overview
        • Product Portfolio
        • Profitability by Market Segments (Product/Age /Sales Channel/Region)
        • Sales Footprint
        • Strategy Overview
          • Marketing Strategy
          • Product Strategy
          • Channel Strategy
      • Pepin mfg
        • Overview
        • Product Portfolio
        • Profitability by Market Segments (Product/Age /Sales Channel/Region)
        • Sales Footprint
        • Strategy Overview
          • Marketing Strategy
          • Product Strategy
          • Channel Strategy
      • Mco Hospital Aids Pvt. Ltd
        • Overview
        • Product Portfolio
        • Profitability by Market Segments (Product/Age /Sales Channel/Region)
        • Sales Footprint
        • Strategy Overview
          • Marketing Strategy
          • Product Strategy
          • Channel Strategy
      • Bytox
        • Overview
        • Product Portfolio
        • Profitability by Market Segments (Product/Age /Sales Channel/Region)
        • Sales Footprint
        • Strategy Overview
          • Marketing Strategy
          • Product Strategy
          • Channel Strategy
  22. Assumptions & Acronyms Used
  23. Research Methodology

List of Tables

  • Table 1: Global Market Value (USD Billion) Forecast by Region, 2020-2035
  • Table 2: Global Market Volume (Million Units) Forecast by Region, 2020-2035
  • Table 3: Global Market Value (USD Billion) Forecast by Product Type, 2020-2035
  • Table 4: Global Market Volume (Million Units) Forecast by Product Type, 2020-2035
  • Table 5: Global Market Value (USD Billion) Forecast by Adhesive Type, 2020-2035
  • Table 6: Global Market Volume (Million Units) Forecast by Adhesive Type, 2020-2035
  • Table 7: Global Market Value (USD Billion) Forecast by Application, 2020-2035
  • Table 8: Global Market Volume (Million Units) Forecast by Application, 2020-2035
  • Table 9: Global Market Value (USD Billion) Forecast by Sales Channel, 2020-2035
  • Table 10: Global Market Volume (Million Units) Forecast by Sales Channel, 2020-2035
  • Table 11: Global Market Value (USD Billion) Forecast by Patch Size (cm2), 2020-2035
  • Table 12: Global Market Volume (Million Units) Forecast by Patch Size (cm2), 2020-2035
  • Table 13: USA Market Value (USD Billion) Forecast by Country, 2020-2035
  • Table 14: USA Market Volume (Million Units) Forecast by Country, 2020-2035
  • Table 15: USA Market Value (USD Billion) Forecast by Product Type, 2020-2035
  • Table 16: USA Market Volume (Million Units) Forecast by Product Type, 2020-2035
  • Table 17: USA Market Value (USD Billion) Forecast by Adhesive Type, 2020-2035
  • Table 18: USA Market Volume (Million Units) Forecast by Adhesive Type, 2020-2035
  • Table 19: USA Market Value (USD Billion) Forecast by Application, 2020-2035
  • Table 20: USA Market Volume (Million Units) Forecast by Application, 2020-2035
  • Table 21: USA Market Value (USD Billion) Forecast by Sales Channel, 2020-2035
  • Table 22: USA Market Volume (Million Units) Forecast by Sales Channel, 2020-2035
  • Table 23: USA Market Value (USD Billion) Forecast by Patch Size (cm2), 2020-2035
  • Table 24: USA Market Volume (Million Units) Forecast by Patch Size (cm2), 2020-2035
  • Table 25: Latin America Market Value (USD Billion) Forecast by Country, 2020-2035
  • Table 26: Latin America Market Volume (Million Units) Forecast by Country, 2020-2035
  • Table 27: Latin America Market Value (USD Billion) Forecast by Product Type, 2020-2035
  • Table 28: Latin America Market Volume (Million Units) Forecast by Product Type, 2020-2035
  • Table 29: Latin America Market Value (USD Billion) Forecast by Adhesive Type, 2020-2035
  • Table 30: Latin America Market Volume (Million Units) Forecast by Adhesive Type, 2020-2035
  • Table 31: Latin America Market Value (USD Billion) Forecast by Application, 2020-2035
  • Table 32: Latin America Market Volume (Million Units) Forecast by Application, 2020-2035
  • Table 33: Latin America Market Value (USD Billion) Forecast by Sales Channel, 2020-2035
  • Table 34: Latin America Market Volume (Million Units) Forecast by Sales Channel, 2020-2035
  • Table 35: Latin America Market Value (USD Billion) Forecast by Patch Size (cm2), 2020-2035
  • Table 36: Latin America Market Volume (Million Units) Forecast by Patch Size (cm2), 2020-2035
  • Table 37: Western Europe Market Value (USD Billion) Forecast by Country, 2020-2035
  • Table 38: Western Europe Market Volume (Million Units) Forecast by Country, 2020-2035
  • Table 39: Western Europe Market Value (USD Billion) Forecast by Product Type, 2020-2035
  • Table 40: Western Europe Market Volume (Million Units) Forecast by Product Type, 2020-2035
  • Table 41: Western Europe Market Value (USD Billion) Forecast by Adhesive Type, 2020-2035
  • Table 42: Western Europe Market Volume (Million Units) Forecast by Adhesive Type, 2020-2035
  • Table 43: Western Europe Market Value (USD Billion) Forecast by Application, 2020-2035
  • Table 44: Western Europe Market Volume (Million Units) Forecast by Application, 2020-2035
  • Table 45: Western Europe Market Value (USD Billion) Forecast by Sales Channel, 2020-2035
  • Table 46: Western Europe Market Volume (Million Units) Forecast by Sales Channel, 2020-2035
  • Table 47: Western Europe Market Value (USD Billion) Forecast by Patch Size (cm2), 2020-2035
  • Table 48: Western Europe Market Volume (Million Units) Forecast by Patch Size (cm2), 2020-2035
  • Table 49: Eastern Europe Market Value (USD Billion) Forecast by Country, 2020-2035
  • Table 50: Eastern Europe Market Volume (Million Units) Forecast by Country, 2020-2035
  • Table 51: Eastern Europe Market Value (USD Billion) Forecast by Product Type, 2020-2035
  • Table 52: Eastern Europe Market Volume (Million Units) Forecast by Product Type, 2020-2035
  • Table 53: Eastern Europe Market Value (USD Billion) Forecast by Adhesive Type, 2020-2035
  • Table 54: Eastern Europe Market Volume (Million Units) Forecast by Adhesive Type, 2020-2035
  • Table 55: Eastern Europe Market Value (USD Billion) Forecast by Application, 2020-2035
  • Table 56: Eastern Europe Market Volume (Million Units) Forecast by Application, 2020-2035
  • Table 57: Eastern Europe Market Value (USD Billion) Forecast by Sales Channel, 2020-2035
  • Table 58: Eastern Europe Market Volume (Million Units) Forecast by Sales Channel, 2020-2035
  • Table 59: Eastern Europe Market Value (USD Billion) Forecast by Patch Size (cm2), 2020-2035
  • Table 60: Eastern Europe Market Volume (Million Units) Forecast by Patch Size (cm2), 2020-2035
  • Table 61: East Asia Market Value (USD Billion) Forecast by Country, 2020-2035
  • Table 62: East Asia Market Volume (Million Units) Forecast by Country, 2020-2035
  • Table 63: East Asia Market Value (USD Billion) Forecast by Product Type, 2020-2035
  • Table 64: East Asia Market Volume (Million Units) Forecast by Product Type, 2020-2035
  • Table 65: East Asia Market Value (USD Billion) Forecast by Adhesive Type, 2020-2035
  • Table 66: East Asia Market Volume (Million Units) Forecast by Adhesive Type, 2020-2035
  • Table 67: East Asia Market Value (USD Billion) Forecast by Application, 2020-2035
  • Table 68: East Asia Market Volume (Million Units) Forecast by Application, 2020-2035
  • Table 69: East Asia Market Value (USD Billion) Forecast by Sales Channel, 2020-2035
  • Table 70: East Asia Market Volume (Million Units) Forecast by Sales Channel, 2020-2035
  • Table 71: East Asia Market Value (USD Billion) Forecast by Patch Size (cm2), 2020-2035
  • Table 72: East Asia Market Volume (Million Units) Forecast by Patch Size (cm2), 2020-2035
  • Table 73: South Asia & Pacific Market Value (USD Billion) Forecast by Country, 2020-2035
  • Table 74: South Asia & Pacific Market Volume (Million Units) Forecast by Country, 2020-2035
  • Table 75: South Asia & Pacific Market Value (USD Billion) Forecast by Product Type, 2020-2035
  • Table 76: South Asia & Pacific Market Volume (Million Units) Forecast by Product Type, 2020-2035
  • Table 77: South Asia & Pacific Market Value (USD Billion) Forecast by Adhesive Type, 2020-2035
  • Table 78: South Asia & Pacific Market Volume (Million Units) Forecast by Adhesive Type, 2020-2035
  • Table 79: South Asia & Pacific Market Value (USD Billion) Forecast by Application, 2020-2035
  • Table 80: South Asia & Pacific Market Volume (Million Units) Forecast by Application, 2020-2035
  • Table 81: South Asia & Pacific Market Value (USD Billion) Forecast by Sales Channel, 2020-2035
  • Table 82: South Asia & Pacific Market Volume (Million Units) Forecast by Sales Channel, 2020-2035
  • Table 83: South Asia & Pacific Market Value (USD Billion) Forecast by Patch Size (cm2), 2020-2035
  • Table 84: South Asia & Pacific Market Volume (Million Units) Forecast by Patch Size (cm2), 2020-2035
  • Table 85: Middle East and Africa Market Value (USD Billion) Forecast by Country, 2020-2035
  • Table 86: Middle East and Africa Market Volume (Million Units) Forecast by Country, 2020-2035
  • Table 87: Middle East and Africa Market Value (USD Billion) Forecast by Product Type, 2020-2035
  • Table 88: Middle East and Africa Market Volume (Million Units) Forecast by Product Type, 2020-2035
  • Table 89: Middle East and Africa Market Value (USD Billion) Forecast by Adhesive Type, 2020-2035
  • Table 90: Middle East and Africa Market Volume (Million Units) Forecast by Adhesive Type, 2020-2035
  • Table 91: Middle East and Africa Market Value (USD Billion) Forecast by Application, 2020-2035
  • Table 92: Middle East and Africa Market Volume (Million Units) Forecast by Application, 2020-2035
  • Table 93: Middle East and Africa Market Value (USD Billion) Forecast by Sales Channel, 2020-2035
  • Table 94: Middle East and Africa Market Volume (Million Units) Forecast by Sales Channel, 2020-2035
  • Table 95: Middle East and Africa Market Value (USD Billion) Forecast by Patch Size (cm2), 2020-2035
  • Table 96: Middle East and Africa Market Volume (Million Units) Forecast by Patch Size (cm2), 2020-2035

List of Figures

  • Figure 1: Global Market Volume (Million Units) Forecast 2020-2035
  • Figure 2: Global Market Pricing Analysis
  • Figure 3: Global Market Value (USD Billion) Forecast 2020-2035
  • Figure 4: Global Market Value Share and BPS Analysis by Product Type, 2025 and 2035
  • Figure 5: Global Market Y-o-Y Growth Comparison by Product Type, 2025-2035
  • Figure 6: Global Market Attractiveness Analysis by Product Type
  • Figure 7: Global Market Value Share and BPS Analysis by Adhesive Type, 2025 and 2035
  • Figure 8: Global Market Y-o-Y Growth Comparison by Adhesive Type, 2025-2035
  • Figure 9: Global Market Attractiveness Analysis by Adhesive Type
  • Figure 10: Global Market Value Share and BPS Analysis by Application, 2025 and 2035
  • Figure 11: Global Market Y-o-Y Growth Comparison by Application, 2025-2035
  • Figure 12: Global Market Attractiveness Analysis by Application
  • Figure 13: Global Market Value Share and BPS Analysis by Sales Channel, 2025 and 2035
  • Figure 14: Global Market Y-o-Y Growth Comparison by Sales Channel, 2025-2035
  • Figure 15: Global Market Attractiveness Analysis by Sales Channel
  • Figure 16: Global Market Value Share and BPS Analysis by Patch Size (cm2), 2025 and 2035
  • Figure 17: Global Market Y-o-Y Growth Comparison by Patch Size (cm2), 2025-2035
  • Figure 18: Global Market Attractiveness Analysis by Patch Size (cm2)
  • Figure 19: Global Market Value (USD Billion) Share and BPS Analysis by Region, 2025 and 2035
  • Figure 20: Global Market Y-o-Y Growth Comparison by Region, 2025-2035
  • Figure 21: Global Market Attractiveness Analysis by Region
  • Figure 22: USA Market Incremental $ Opportunity, 2025-2035
  • Figure 23: Latin America Market Incremental $ Opportunity, 2025-2035
  • Figure 24: Western Europe Market Incremental $ Opportunity, 2025-2035
  • Figure 25: Eastern Europe Market Incremental $ Opportunity, 2025-2035
  • Figure 26: East Asia Market Incremental $ Opportunity, 2025-2035
  • Figure 27: South Asia & Pacific Market Incremental $ Opportunity, 2025-2035
  • Figure 28: Middle East and Africa Market Incremental $ Opportunity, 2025-2035
  • Figure 29: USA Market Value Share and BPS Analysis by Country, 2025 and 2035
  • Figure 30: USA Market Value Share and BPS Analysis by Product Type, 2025 and 2035
  • Figure 31: USA Market Y-o-Y Growth Comparison by Product Type, 2025-2035
  • Figure 32: USA Market Attractiveness Analysis by Product Type
  • Figure 33: USA Market Value Share and BPS Analysis by Adhesive Type, 2025 and 2035
  • Figure 34: USA Market Y-o-Y Growth Comparison by Adhesive Type, 2025-2035
  • Figure 35: USA Market Attractiveness Analysis by Adhesive Type
  • Figure 36: USA Market Value Share and BPS Analysis by Application, 2025 and 2035
  • Figure 37: USA Market Y-o-Y Growth Comparison by Application, 2025-2035
  • Figure 38: USA Market Attractiveness Analysis by Application
  • Figure 39: USA Market Value Share and BPS Analysis by Sales Channel, 2025 and 2035
  • Figure 40: USA Market Y-o-Y Growth Comparison by Sales Channel, 2025-2035
  • Figure 41: USA Market Attractiveness Analysis by Sales Channel
  • Figure 42: USA Market Value Share and BPS Analysis by Patch Size (cm2), 2025 and 2035
  • Figure 43: USA Market Y-o-Y Growth Comparison by Patch Size (cm2), 2025-2035
  • Figure 44: USA Market Attractiveness Analysis by Patch Size (cm2)
  • Figure 45: Latin America Market Value Share and BPS Analysis by Country, 2025 and 2035
  • Figure 46: Latin America Market Value Share and BPS Analysis by Product Type, 2025 and 2035
  • Figure 47: Latin America Market Y-o-Y Growth Comparison by Product Type, 2025-2035
  • Figure 48: Latin America Market Attractiveness Analysis by Product Type
  • Figure 49: Latin America Market Value Share and BPS Analysis by Adhesive Type, 2025 and 2035
  • Figure 50: Latin America Market Y-o-Y Growth Comparison by Adhesive Type, 2025-2035
  • Figure 51: Latin America Market Attractiveness Analysis by Adhesive Type
  • Figure 52: Latin America Market Value Share and BPS Analysis by Application, 2025 and 2035
  • Figure 53: Latin America Market Y-o-Y Growth Comparison by Application, 2025-2035
  • Figure 54: Latin America Market Attractiveness Analysis by Application
  • Figure 55: Latin America Market Value Share and BPS Analysis by Sales Channel, 2025 and 2035
  • Figure 56: Latin America Market Y-o-Y Growth Comparison by Sales Channel, 2025-2035
  • Figure 57: Latin America Market Attractiveness Analysis by Sales Channel
  • Figure 58: Latin America Market Value Share and BPS Analysis by Patch Size (cm2), 2025 and 2035
  • Figure 59: Latin America Market Y-o-Y Growth Comparison by Patch Size (cm2), 2025-2035
  • Figure 60: Latin America Market Attractiveness Analysis by Patch Size (cm2)
  • Figure 61: Western Europe Market Value Share and BPS Analysis by Country, 2025 and 2035
  • Figure 62: Western Europe Market Value Share and BPS Analysis by Product Type, 2025 and 2035
  • Figure 63: Western Europe Market Y-o-Y Growth Comparison by Product Type, 2025-2035
  • Figure 64: Western Europe Market Attractiveness Analysis by Product Type
  • Figure 65: Western Europe Market Value Share and BPS Analysis by Adhesive Type, 2025 and 2035
  • Figure 66: Western Europe Market Y-o-Y Growth Comparison by Adhesive Type, 2025-2035
  • Figure 67: Western Europe Market Attractiveness Analysis by Adhesive Type
  • Figure 68: Western Europe Market Value Share and BPS Analysis by Application, 2025 and 2035
  • Figure 69: Western Europe Market Y-o-Y Growth Comparison by Application, 2025-2035
  • Figure 70: Western Europe Market Attractiveness Analysis by Application
  • Figure 71: Western Europe Market Value Share and BPS Analysis by Sales Channel, 2025 and 2035
  • Figure 72: Western Europe Market Y-o-Y Growth Comparison by Sales Channel, 2025-2035
  • Figure 73: Western Europe Market Attractiveness Analysis by Sales Channel
  • Figure 74: Western Europe Market Value Share and BPS Analysis by Patch Size (cm2), 2025 and 2035
  • Figure 75: Western Europe Market Y-o-Y Growth Comparison by Patch Size (cm2), 2025-2035
  • Figure 76: Western Europe Market Attractiveness Analysis by Patch Size (cm2)
  • Figure 77: Eastern Europe Market Value Share and BPS Analysis by Country, 2025 and 2035
  • Figure 78: Eastern Europe Market Value Share and BPS Analysis by Product Type, 2025 and 2035
  • Figure 79: Eastern Europe Market Y-o-Y Growth Comparison by Product Type, 2025-2035
  • Figure 80: Eastern Europe Market Attractiveness Analysis by Product Type
  • Figure 81: Eastern Europe Market Value Share and BPS Analysis by Adhesive Type, 2025 and 2035
  • Figure 82: Eastern Europe Market Y-o-Y Growth Comparison by Adhesive Type, 2025-2035
  • Figure 83: Eastern Europe Market Attractiveness Analysis by Adhesive Type
  • Figure 84: Eastern Europe Market Value Share and BPS Analysis by Application, 2025 and 2035
  • Figure 85: Eastern Europe Market Y-o-Y Growth Comparison by Application, 2025-2035
  • Figure 86: Eastern Europe Market Attractiveness Analysis by Application
  • Figure 87: Eastern Europe Market Value Share and BPS Analysis by Sales Channel, 2025 and 2035
  • Figure 88: Eastern Europe Market Y-o-Y Growth Comparison by Sales Channel, 2025-2035
  • Figure 89: Eastern Europe Market Attractiveness Analysis by Sales Channel
  • Figure 90: Eastern Europe Market Value Share and BPS Analysis by Patch Size (cm2), 2025 and 2035
  • Figure 91: Eastern Europe Market Y-o-Y Growth Comparison by Patch Size (cm2), 2025-2035
  • Figure 92: Eastern Europe Market Attractiveness Analysis by Patch Size (cm2)
  • Figure 93: East Asia Market Value Share and BPS Analysis by Country, 2025 and 2035
  • Figure 94: East Asia Market Value Share and BPS Analysis by Product Type, 2025 and 2035
  • Figure 95: East Asia Market Y-o-Y Growth Comparison by Product Type, 2025-2035
  • Figure 96: East Asia Market Attractiveness Analysis by Product Type
  • Figure 97: East Asia Market Value Share and BPS Analysis by Adhesive Type, 2025 and 2035
  • Figure 98: East Asia Market Y-o-Y Growth Comparison by Adhesive Type, 2025-2035
  • Figure 99: East Asia Market Attractiveness Analysis by Adhesive Type
  • Figure 100: East Asia Market Value Share and BPS Analysis by Application, 2025 and 2035
  • Figure 101: East Asia Market Y-o-Y Growth Comparison by Application, 2025-2035
  • Figure 102: East Asia Market Attractiveness Analysis by Application
  • Figure 103: East Asia Market Value Share and BPS Analysis by Sales Channel, 2025 and 2035
  • Figure 104: East Asia Market Y-o-Y Growth Comparison by Sales Channel, 2025-2035
  • Figure 105: East Asia Market Attractiveness Analysis by Sales Channel
  • Figure 106: East Asia Market Value Share and BPS Analysis by Patch Size (cm2), 2025 and 2035
  • Figure 107: East Asia Market Y-o-Y Growth Comparison by Patch Size (cm2), 2025-2035
  • Figure 108: East Asia Market Attractiveness Analysis by Patch Size (cm2)
  • Figure 109: South Asia & Pacific Market Value Share and BPS Analysis by Country, 2025 and 2035
  • Figure 110: South Asia & Pacific Market Value Share and BPS Analysis by Product Type, 2025 and 2035
  • Figure 111: South Asia & Pacific Market Y-o-Y Growth Comparison by Product Type, 2025-2035
  • Figure 112: South Asia & Pacific Market Attractiveness Analysis by Product Type
  • Figure 113: South Asia & Pacific Market Value Share and BPS Analysis by Adhesive Type, 2025 and 2035
  • Figure 114: South Asia & Pacific Market Y-o-Y Growth Comparison by Adhesive Type, 2025-2035
  • Figure 115: South Asia & Pacific Market Attractiveness Analysis by Adhesive Type
  • Figure 116: South Asia & Pacific Market Value Share and BPS Analysis by Application, 2025 and 2035
  • Figure 117: South Asia & Pacific Market Y-o-Y Growth Comparison by Application, 2025-2035
  • Figure 118: South Asia & Pacific Market Attractiveness Analysis by Application
  • Figure 119: South Asia & Pacific Market Value Share and BPS Analysis by Sales Channel, 2025 and 2035
  • Figure 120: South Asia & Pacific Market Y-o-Y Growth Comparison by Sales Channel, 2025-2035
  • Figure 121: South Asia & Pacific Market Attractiveness Analysis by Sales Channel
  • Figure 122: South Asia & Pacific Market Value Share and BPS Analysis by Patch Size (cm2), 2025 and 2035
  • Figure 123: South Asia & Pacific Market Y-o-Y Growth Comparison by Patch Size (cm2), 2025-2035
  • Figure 124: South Asia & Pacific Market Attractiveness Analysis by Patch Size (cm2)
  • Figure 125: Middle East and Africa Market Value Share and BPS Analysis by Country, 2025 and 2035
  • Figure 126: Middle East and Africa Market Value Share and BPS Analysis by Product Type, 2025 and 2035
  • Figure 127: Middle East and Africa Market Y-o-Y Growth Comparison by Product Type, 2025-2035
  • Figure 128: Middle East and Africa Market Attractiveness Analysis by Product Type
  • Figure 129: Middle East and Africa Market Value Share and BPS Analysis by Adhesive Type, 2025 and 2035
  • Figure 130: Middle East and Africa Market Y-o-Y Growth Comparison by Adhesive Type, 2025-2035
  • Figure 131: Middle East and Africa Market Attractiveness Analysis by Adhesive Type
  • Figure 132: Middle East and Africa Market Value Share and BPS Analysis by Application, 2025 and 2035
  • Figure 133: Middle East and Africa Market Y-o-Y Growth Comparison by Application, 2025-2035
  • Figure 134: Middle East and Africa Market Attractiveness Analysis by Application
  • Figure 135: Middle East and Africa Market Value Share and BPS Analysis by Sales Channel, 2025 and 2035
  • Figure 136: Middle East and Africa Market Y-o-Y Growth Comparison by Sales Channel, 2025-2035
  • Figure 137: Middle East and Africa Market Attractiveness Analysis by Sales Channel
  • Figure 138: Middle East and Africa Market Value Share and BPS Analysis by Patch Size (cm2), 2025 and 2035
  • Figure 139: Middle East and Africa Market Y-o-Y Growth Comparison by Patch Size (cm2), 2025-2035
  • Figure 140: Middle East and Africa Market Attractiveness Analysis by Patch Size (cm2)
  • Figure 141: Global Market - Tier Structure Analysis
  • Figure 142: Global Market - Company Share Analysis

Frequently Asked Questions

What is the current market size of vitamin patches in 2025?

The market is valued at USD 6.91 billion in 2025.

What is the projected market size of vitamin patches by 2035?

The market is projected to reach USD 10.89 billion by 2035.

What is the forecasted CAGR for vitamin patches from 2025 to 2035?

The market is expected to grow at a CAGR of 4.7% during this period.

Which product type holds the largest share in the vitamin patches market?

The drug-in-adhesive segment holds the largest share at 30.8%.

Which country is the fastest-growing market for the vitamin patches market?

The USA is the fastest-growing market with a CAGR of 5.4%.

Explore Similar Insights

Future Market Insights

Vitamin Patches Market