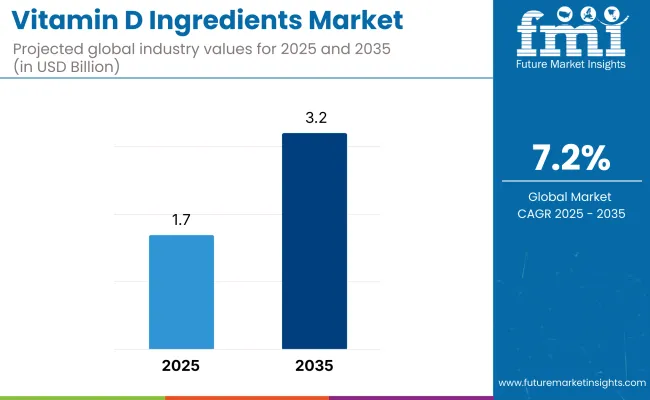
The global vitamin D ingredients market is estimated to be worth USD 1.7 billion by 2025 and is projected to reach a value of USD 3.2 billion by 2035, reflecting a CAGR of 7.2% over the assessment period 2025 to 2035.
| Metrics | Values |
|---|---|
| Industry Size (2025E) | USD 1.7 Billion |
| Industry Value (2035F) | USD 3.2 Billion |
| CAGR (2025 to 2035) | 7.2% |
The expanding awareness regarding vitamin D deficiency, its health implications across all age groups, and the preventive potential of supplementation in chronic disease management have emerged as fundamental drivers shaping the trajectory of this market. The prevalence of lifestyle-related disorders, coupled with increasing research on the immunomodulatory role of vitamin D, particularly during global health crises, has intensified consumer and regulatory interest in fortification initiatives and supplement adoption.
Dominance of vitamin D3 in the segment landscape is not incidental; it is grounded in its physiological efficacy and its proven absorption profile compared to D2. Vitamin D3 sourced from both animal-based and increasingly from vegan/lichen-based sources continues to witness formulation innovation in tablets, soft gels, gummies, fortified beverages, and dairy alternatives.
This ingredient is increasingly incorporated into pediatric, adult, and geriatric nutrition products, which are gaining traction through over-the-counter and D2C nutraceutical platforms. Concurrently, food processors are integrating vitamin D into mainstream food applications such as breakfast cereals, plant-based milks, and cooking oils in response to both voluntary fortification policies and mandatory government directives in select countries.
The supply side of the market has remained robust, with leading players such as DSM-Firmenich and BASF SE investing in high-quality synthesis and micronization technologies to improve product stability and bioavailability.
Indian manufacturers such as Fermenta Biotech Ltd. and Dishman Carbogen Amcis Ltd. are sustaining competitive advantage through large-scale production capacities, cost-effective manufacturing, and expanding compliance across pharmaceutical and food-grade certifications. Moreover, clean-label positioning, organic certification trends, and tailored microencapsulation techniques are helping ingredient providers differentiate their offerings in a mature yet evolving landscape.
Formulation-specific innovations, regulatory harmonization across regions, and expanding use-cases in personalized nutrition are expected to significantly support market expansion over the next decade. Additionally, favorable policy movements-including fortification mandates and public health supplementation programs-will continue to reinforce the commercial potential of vitamin D ingredients globally.
The industry and industry factors are some of the challenges even though this is a high-growth opportunity. Plant-based vitamin D could be extremely costly to manufacture, affecting cost and availability. Conditions of regulation for vitamin D fortification and dosing limits by region can pose challenges to businesses. Consumer skepticism towards the effectiveness of certain types of vitamin D (particularly synthetic ones) is a challenge that must be overcome by open sourcing and scientific testing.
The industry evolves further with the use of water-dispersible and microencapsulated ingredients, which enhance their bioavailability and stability for different uses. Mainstream industries are seeing an unprecedented march of fortified merchandise, with efforts from food and beverage companies as well as from vitamin D companies.
Sustainability is also seeing increased focus, with brands adopting more environmentally friendly processes and green packing due to growing environmental pressure.
As the demand for health-focused and natural products keeps rising, the Indsutry is set to grow further with the driving forces of product development, strategic expansion, and eco-friendly initiatives.
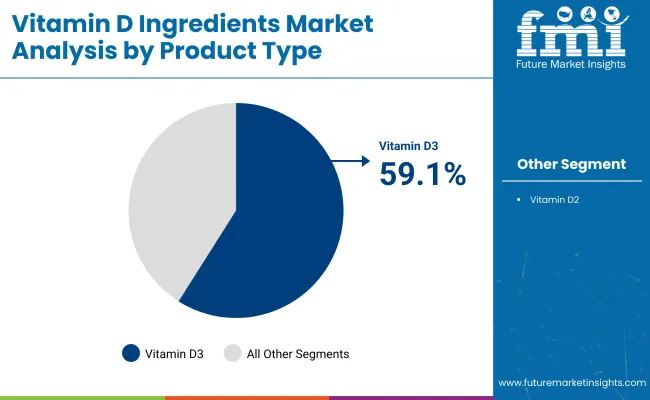
Accounting for approximately 59.1% of global market share in 2025, the vitamin D3 segment is projected to expand at a CAGR of 7.8% through 2035. This growth reflects its dominant role across nutraceutical, pharmaceutical, and functional food domains due to superior bioavailability and proven physiological performance.
Vitamin D3 has been increasingly positioned as a foundational micronutrient in addressing global deficiency burdens, with formulators favoring it over alternatives owing to its stability, absorption efficiency, and regulatory acceptance across major geographies. Its inclusion in fortified foods, beverages, and personalized health solutions has demonstrated measurable gains in consumer trust and clinical validation.
The segment’s expansion has been supported by evolving dietary guidelines and public health mandates, which continue to prioritize D3 in population-wide intervention strategies. Moreover, with vegan-compliant D3 now emerging as a viable source, demand has begun shifting toward clean-label, sustainable, and allergen-free solutions, widening its footprint in plant-based and lifestyle-specific nutrition.
Market leadership is expected to remain concentrated among innovation-focused players investing in microencapsulation, precision delivery formats, and value-added blends. As aging populations and immune-supporting formulations dominate new product pipelines, D3’s strategic relevance will remain intact across all end-use categories over the forecast horizon.
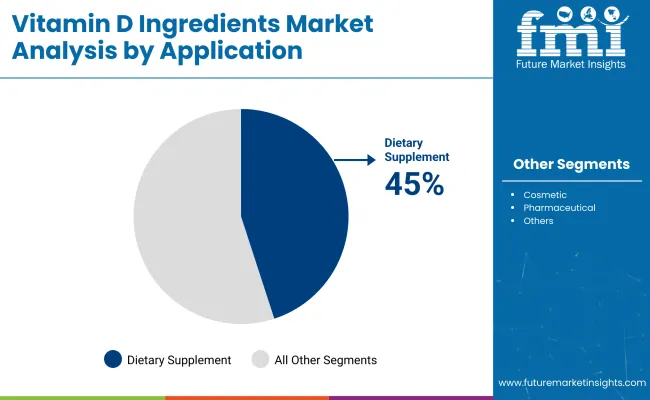
The dietary supplements segment is expected to hold over 45% revenue share of the global vitamin D ingredients market in 2025, expanding steadily at a CAGR of 7.5% through 2035. This segment’s prominence is underpinned by the rising adoption of preventive healthcare and the mainstreaming of wellness-oriented consumption patterns.
Vitamin D’s well-documented role in musculoskeletal health, immune regulation, and chronic disease prevention has positioned it as a cornerstone ingredient in global supplement formulations. Consumers are increasingly drawn to daily-use products supported by scientific substantiation, and vitamin D's evidence base offers a compelling foundation for sustained demand.
As the supplement sector shifts from reactive to proactive health management, vitamin D is being integrated into condition-specific blends targeting immunity, bone density, mood stabilization, and metabolic support.
Digital health platforms, DTC brands, and personalized nutrition models have enabled rapid expansion of this segment, while innovations in delivery formats-such as gummies, softgels, and orodispersibles-have diversified access.
Regulatory clarity across North America and Europe, along with rising consumer education in Asia-Pacific and Latin America, continues to unlock new demographic cohorts. Over the forecast period, strategic partnerships between ingredient suppliers and supplement brands will further elevate vitamin D’s role as a high-impact, cross-functional supplement ingredient.
The industry is fuelled by growing health awareness, rising incidence of vitamin D deficiency, and food & beverage fortification approvals.
Pharmaceutical manufacturers emphasize high-purity and bioavailable ingredients such as Vitamin D2 and D3, emphasizing therapeutic effectiveness. The food & beverage industry is experiencing robust demand for fortified dairy, plant-based milk, and functional foods due to consumer interest in immunity-boosting foods.
In animal nutrition, affordable and stable vitamin D products are important for the health and productivity of livestock. Personal care companies are adding Vitamin D-enriched skincare for its anti-aging and skin-shielding properties.
Regulatory endorsement of vitamin D fortification and advances in microencapsulation for enhanced stability remain key drivers in the industry.
The shift toward natural and plant-derived sources, as well as novel delivery formats (liposomal, nano emulsions, and gummies), will drive future growth.
| Countries | CAGR (2025 to 2035) |
|---|---|
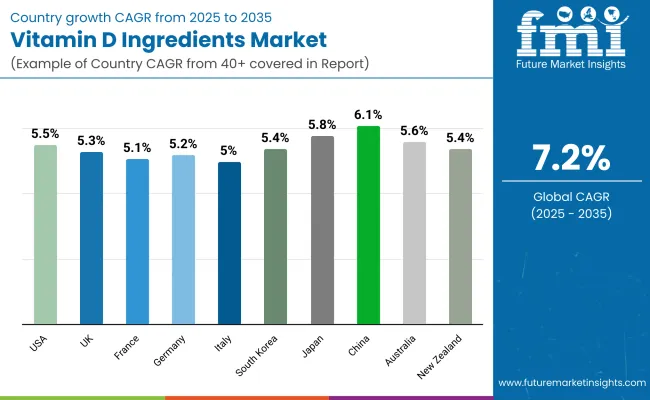
| USA | 5.5% |
| UK | 5.3% |
| France | 5.1% |
| Germany | 5.2% |
| Italy | 5.0% |
| South Korea | 5.4% |
| Japan | 5.8% |
| China | 6.1% |
| Australia | 5.6% |
| New Zealand | 5.4% |
The USA industry is anticipated to register a CAGR of 5.5% in 2025 to 2035. Increased consciousness regarding the necessity of this nutrient for immunity and bone health has driven demand for supplements and fortified foods. An inactive lifestyle and decreased sun exposure led to endemic deficiencies, and supplementation has been promoted by health experts as well as government authorities.
Further, older people increasingly use supplementation to support the upkeep of bone density and the hindrance of exacerbation of osteoporosis. The dominant presence of large pharma and nutraceutical players in the sector also stimulates innovation through enhanced formulation with greater bioavailability.
Excellent quality and evidence-based supplements are what America's shelf-aware customers need, and hence producers have invested in clinical trials and research. The industry has also been helped by increasing retail and e-commerce penetration, which increases availability.
Regulatory encouragement of enrichment of staple foods like cereals and dairy further expands the industry. In addition, trends in personalized nutrition and the popularity of functional foods also influence the industry's growth. Firms use marketing campaigns and influencer support to enhance consumer education further, thus allowing sustained demand growth.
The UK industry is likely to expand at a CAGR of 5.3% during 2025 to 2035. The nation receives little sunlight, particularly in winter, and as a result, there has been a focus on supplementation. Government programs and social health campaigns suggest consumption for the prevention of deficiency, further driving the industry.
A steep rise in the incidence of osteoporosis and other bone conditions in aging populations has fuelled demand for premium products. In addition, demand for plant-based and vegan supplements has created space for innovation from non-animal sources.
British manufacturers emphasize environmentally friendly and organic production of products to respond to growing demands for natural care health solutions. Online sales' dramatic increase has significantly increased industry access, with online platforms providing an assortment of products.
Functional foods and drinks fortified with this vitamin are also becoming increasingly popular, an indicator of the shift towards convenient nutrition foods: health professionals and dietitians industry supplementation as a component of daily nutrition aggressively, ensuring consistent industry growth. Incorporation into immunity and wellness multi-nutrient formulas also ensures wider consumer uptake.
The French industry is forecast to grow at a CAGR of 5.1% during the period from 2025 to 2035. France is increasingly concerned about preventive care, and hence, supplement consumption for the maintenance of bone as well as immune health is growing.
The aging population in the country has worked to increase awareness of osteoporosis and proper intake. Moreover, limited sunlight in some areas has promoted the consumption of fortified foods and supplements. French consumers value pharmaceutical-grade products, emphasizing safety, efficacy, and scientific support.
Growing e-commerce and internet-based healthcare sites have offered additional access to supplementation. Businesses gain from clean-label trends by employing organic and natural sources in the hope of attracting health-oriented consumers. Functional foods such as plant milk and dairy products are highly fortified to boost consumer convenience.
The government-funded schemes also promote consumer awareness of the necessity of having optimum levels of nutrients, with increased consumption following. With pharma and nutraceutical industry players working actively on research and development, France's industry can grow consistently in the long run.
Germany's industry will expand at a rate of 5.2% CAGR from 2025 to 2035. Germany's geographical position leads to receiving limited sunlight exposure, especially during winter, hence the need for supplementation by most people. Consumer demand has been high, fueled by growing awareness of the interaction between this nutrient and bone health.
The aging population and increasing prevalence of osteoporosis contribute to the aggravation of the industry's expansion. Furthermore, German consumers also prefer scientifically proven quality supplements, resulting in extensive usage of pharmaceutical-grade products.
Functional foods that are fortified such as plant and dairy foods remain on the rise. Public health initiatives and official approval in promotion to ensure adequate intake make it increasingly well known. Greater accessibility as a result of the increase in e-commerce and online health sites makes it more accessible for consumers to make supplements a part of their lives. Firms invest in sophisticated formulations, including liposomal forms, to enhance efficacy and bioavailability. With ongoing R&D activity, Germany's industry is expected to grow steadily in the long term.
Italy's industry will grow at a CAGR of 5.0% from 2025 to 2035. The Mediterranean diet is popular in Italy, but consumption is a problem because of the lack of sunlight exposure during some seasons. The growing population of older people, who are susceptible to osteoporosis and bone diseases, is a major driver of industry growth.
Moreover, healthcare professionals stress the role of this nutrient in the immune system, leading to increased consumption of supplements. Italian consumers demand quality and scientifically tested products, ensuring consistent demand for premium products.
The use of fortified foods, such as dairy and plant foods, is gradually increasing in Italy. Increasing consumer interest in organic and natural supplements has encouraged manufacturers to launch plant-based sources. Online distribution channels have also expanded industry coverage, with e-commerce serving as a significant distribution channel. Public awareness campaigns and government efforts aimed at preventive care also account for consistent demand. With ongoing research on supplement formulations, Italy's industry continues to be geared for sustainable growth.
China's industry is poised to grow at a CAGR of 6.1% between 2025 and 2035. Changes in demographics via fast-paced urbanization and dietary pattern shifts have resulted in greater deficiencies among consumers. Public health programs initiated by the government and public campaigns further drive consumer demand for supplements and fortified foods.
The availability of e-commerce platforms and online health solutions increases convenience. Local firms emphasize affordable solutions to cater to a large base of consumers. With consumer needs changing to high-end formulations, the industry is bound to grow forever.
The industry in Australia will grow in 2025 to 2035 with a CAGR of 5.6%. Increased awareness about the advantages and high preventive health culture are a few of the significant drivers for increased demand. Supplements and functional foods enriched with this nutrient gain increasing popularity.
Increased application of e-commerce and retail expansion increases the availability of products. Consumer education programs and government health programs further push industry penetration. With ongoing trends in health consciousness, Australia's industry continues to grow at a steady rate.
The New Zealand industry is to grow at a CAGR of 5.4% during 2025 to 2035. The country's preventive health priority and wellness trend favor increasing consumption of supplements. Limited sunlight in winter boosts demand.
A wide variety of high-end supplement brands and the rising availability of online retailing channels fuel growth in the industry. Government-initiated public health campaigns and nutrition advice for food consumption guarantee consistent growth in the industry.
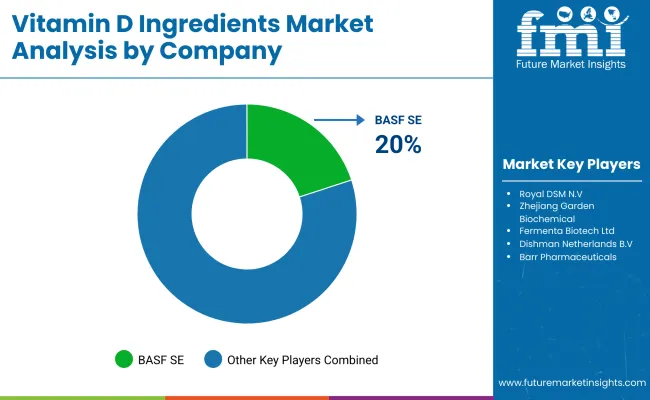
BASF SE (20-24%)
Industry leader in vitamin D ingredients for pharmaceutical industries, food, and sustainable methods for animal nutrition.
Royal DSM N.V. (18-22%)
Maintains strong innovation initiatives stimulating the development of vitamin D formulations in dietary supplements and fortification with forthcoming growth in health and wellness.
Zhejiang Garden Biochemical (12-16%)
The largest global manufacturer of vitamin D3, using advanced production technologies for high-profile solutions profiles.
Fermenta Biotech Ltd (8-12%)
Special Empowered in sustainable vitamin D production, human health, and animal nutrition applications.
Dishman Netherlands B.V. (6-10%)
A major supplier of vitamin D derivatives of pharmaceutical grade with high purity formulations for specialized markets.
Other Key Players (25-35% Combined)
By product type, the industry is segmented into vitamin D2 and vitamin D3.
By source, the segmentation includes eggs, milk, fish, fruits, plants, vegetables, animals, and others such as fungi, microalgae, yeast, and plants.
By application the industry is categorized into beverages, food, cosmetics, pharmaceuticals, pet food & animal feed, and others.
By form, the segmentation comprises resin, powder, and liquid forms.
By region, the industry is divided into North America, Latin America, Western Europe, Eastern Europe, South Asia & Pacific, East Asia, Central Asia, Balkan and Baltic Countries, Russia and Belarus, and The Middle East & Africa.
The industry is projected to grow at a CAGR of 6.0% from 2025 to 2035.
The industry is expected to reach a valuation of approximately USD 3.13 billion by 2035.
Vitamin D3 is anticipated to be the fastest-growing segment in the industry.
The rising prevalence of vitamin D deficiency, government-led fortification initiatives, growing demand for fortified dairy and plant-based products, and consumer preference for high-bioavailability vitamin D formulations are key drivers of industry growth.
Koninklijke DSM N.V., Zhejiang Xinhecheng Co Ltd, BASF SE, Fermenta Biotech Ltd, PHW Group, Synthesia, Bio-Tech Pharmacal, McKinley Resources Inc, Taizhou Hisound Pharmaceutical Co Ltd, and Stabicoat Vitamins are the key players in the industry.


Our Research Products

The "Full Research Suite" delivers actionable market intel, deep dives on markets or technologies, so clients act faster, cut risk, and unlock growth.

The Leaderboard benchmarks and ranks top vendors, classifying them as Established Leaders, Leading Challengers, or Disruptors & Challengers.

Locates where complements amplify value and substitutes erode it, forecasting net impact by horizon

We deliver granular, decision-grade intel: market sizing, 5-year forecasts, pricing, adoption, usage, revenue, and operational KPIs—plus competitor tracking, regulation, and value chains—across 60 countries broadly.

Spot the shifts before they hit your P&L. We track inflection points, adoption curves, pricing moves, and ecosystem plays to show where demand is heading, why it is changing, and what to do next across high-growth markets and disruptive tech

Real-time reads of user behavior. We track shifting priorities, perceptions of today’s and next-gen services, and provider experience, then pace how fast tech moves from trial to adoption, blending buyer, consumer, and channel inputs with social signals (#WhySwitch, #UX).

Partner with our analyst team to build a custom report designed around your business priorities. From analysing market trends to assessing competitors or crafting bespoke datasets, we tailor insights to your needs.
Supplier Intelligence
Discovery & Profiling
Capacity & Footprint
Performance & Risk
Compliance & Governance
Commercial Readiness
Who Supplies Whom
Scorecards & Shortlists
Playbooks & Docs
Category Intelligence
Definition & Scope
Demand & Use Cases
Cost Drivers
Market Structure
Supply Chain Map
Trade & Policy
Operating Norms
Deliverables
Buyer Intelligence
Account Basics
Spend & Scope
Procurement Model
Vendor Requirements
Terms & Policies
Entry Strategy
Pain Points & Triggers
Outputs
Pricing Analysis
Benchmarks
Trends
Should-Cost
Indexation
Landed Cost
Commercial Terms
Deliverables
Brand Analysis
Positioning & Value Prop
Share & Presence
Customer Evidence
Go-to-Market
Digital & Reputation
Compliance & Trust
KPIs & Gaps
Outputs
Full Research Suite comprises of:
Market outlook & trends analysis
Interviews & case studies
Strategic recommendations
Vendor profiles & capabilities analysis
5-year forecasts
8 regions and 60+ country-level data splits
Market segment data splits
12 months of continuous data updates
DELIVERED AS:
PDF EXCEL ONLINE
Vitamin Ingredients Market Size and Share Forecast Outlook 2025 to 2035
Vitamin C Ingredients Market Size and Share Forecast Outlook 2025 to 2035
Prenatal Vitamin Ingredients Market Size and Share Forecast Outlook 2025 to 2035
Ingredients Market for Plant-based Food & Beverages Size and Share Forecast Outlook 2025 to 2035
Dairy Ingredients Market Size and Share Forecast Outlook 2025 to 2035
Vitamin D Testing Market Analysis by Component, Type, and Region: Forecast for 2025 to 2035
Vitamin D Deficiency Treatment Market
Vitamin and Mineral Supplement Market Insights - Trends & Forecast 2025 to 2035
Vitamin and Mineral Market – Growth, Innovations & Health Trends
Almond Ingredients Market Size, Growth, and Forecast for 2025 to 2035
Sourdough Ingredients Market Analysis - Size and Share Forecast Outlook 2025 to 2035
Glandular Ingredients Market Size and Share Forecast Outlook 2025 to 2035
Bean Ingredients Market Size and Share Forecast Outlook 2025 to 2035
Milk Ingredients Market Analysis - Size, Share, and Forecast Outlook 2025 to 2035
Malt Ingredients Market Analysis by Raw Material, Product Type, Grade, End-use, and Region through 2035
Pet Food Ingredients Market Size and Share Forecast Outlook 2025 to 2035
Lipid-Based Vitamin C Market Analysis - Size and Share Forecast Outlook 2025 to 2035
Modified Milk Ingredients Market Size and Share Forecast Outlook 2025 to 2035
Food Coating Ingredients Market Analysis – Size, Share, and Forecast Outlook 2025 to 2035
Demand for Vegan Vitamin D3 Supplements in UK Size and Share Forecast Outlook 2025 to 2035

Thank you!
You will receive an email from our Business Development Manager. Please be sure to check your SPAM/JUNK folder too.
Chat With
MaRIA