Vitamin E Antioxidant Creams Market Forecast and Outlook 2025 to 2035

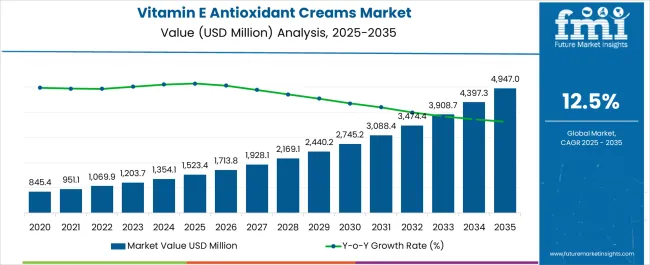
The global vitamin E antioxidant creams market is projected to grow from USD 1,523.4 million in 2025 to approximately USD 4,947 million by 2035, recording an absolute increase of USD 3,440.3 million over the forecast period. This translates into a total growth of 227.8%, with the market forecast to expand at a compound annual growth rate (CAGR) of 12.5% between 2025 and 2035. The overall market size is expected to grow by nearly 3.28X during the same period, supported by increasing consumer awareness about antioxidant benefits, rising demand for anti-aging products, and growing focus on UV protection and skin barrier enhancement.
Quik Stats for Vitamin E Antioxidant Creams Market

  • Vitamin E Antioxidant Creams Market Value (2025): USD 1,523.4 million
  • Vitamin E Antioxidant Creams Market Forecast Value (2035): USD 4,947 million
  • Vitamin E Antioxidant Creams Market Forecast CAGR: 12.5%
  • Leading Function in Vitamin E Antioxidant Creams Market: Free Radical Protection (55.6%)
  • Key Growth Regions in Vitamin E Antioxidant Creams Market: North America, Asia Pacific, and Europe
  • Key Players in Vitamin E Antioxidant Creams Market: Skin Ceuticals, The Ordinary, Paula's Choice, Drunk Elephant, Estée Lauder, L'Oréal, Kiehl's, Clinique, Murad, Derma E

Vitamin E Antioxidant Creams Market Market Value Analysis

Between 2025 and 2030, the vitamin E antioxidant creams market is projected to expand from USD 1,523.4 million to USD 2,746.3 million, resulting in a value increase of USD 1,235.9 million, which represents 35.9% of the total forecast growth for the decade. This phase of growth will be shaped by rising consumer awareness about skin protection benefits, increasing demand for natural and organic formulations, and growing penetration of premium skincare products in emerging markets. Beauty and skincare brands are expanding their vitamin E product portfolios to address the growing demand for multifunctional antioxidant solutions.

Vitamin E Antioxidant Creams Market Key Takeaways

From 2030 to 2035, the market is forecast to grow from USD 2,746.3 million to USD 4,947 million, adding another USD 2,204.4 million, which constitutes 64.1% of the overall ten-year expansion. This period is expected to be characterized by expansion of e-commerce channels, integration of advanced delivery systems in formulations, and development of personalized skincare solutions. The growing adoption of clean beauty trends and dermatologist-recommended products will drive demand for premium vitamin E antioxidant creams with enhanced efficacy and safety profiles.

Between 2020 and 2025, the vitamin E antioxidant creams market experienced robust expansion, driven by increasing consumer focus on preventive skincare and growing awareness of environmental skin damage. The market developed as beauty brands recognized the need for effective antioxidant solutions to combat pollution, UV exposure, and aging concerns. Social media influence and dermatologist recommendations began emphasizing the importance of vitamin E in daily skincare routines for maintaining healthy skin barrier function.

Metric Value
Estimated Value in (2025E) USD 1,523.4 million
Forecast Value in (2035F) USD 4,947 million
Forecast CAGR (2025 to 2035) 12.5%

Why the Vitamin E Antioxidant Creams Market is Growing?

Market expansion is being supported by the increasing consumer awareness about the harmful effects of free radicals on skin health and the corresponding demand for effective antioxidant protection. Modern consumers are increasingly focused on preventive skincare measures that can protect against environmental damage, premature aging, and UV-induced skin damage. Vitamin E's proven efficacy in neutralizing free radicals and supporting skin barrier function makes it a preferred ingredient in premium skincare formulations.

The growing emphasis on clean beauty and natural ingredients is driving demand for vitamin E products derived from natural sources such as soy, sunflower, and wheat germ. Consumer preference for multifunctional products that combine antioxidant protection with moisturizing and anti-aging benefits is creating opportunities for innovative formulations. The rising influence of social media beauty trends and dermatologist recommendations is also contributing to increased product adoption across different age groups and demographics.

Segmental Analysis

The market is segmented by function, source, product type, channel, claim, and region. By function, the market is divided into free radical protection, UV damage repair, moisturizing & barrier support, and anti-aging. Based on source, the market is categorized into synthetic tocopherol, natural tocopherol (soy, sunflower, wheat germ), mixed tocopherols, and tocotrienols. In terms of product type, the market is segmented into creams/lotions, serums, oils, and balms. By channel, the market is classified into e-commerce, pharmacies, mass retail, and specialty beauty retail. By claim, the market is divided into natural/organic, clean-label, dermatologist-tested, and vegan. Regionally, the market is divided into North America, Europe, East Asia, South Asia & Pacific, Latin America, and Middle East & Africa.
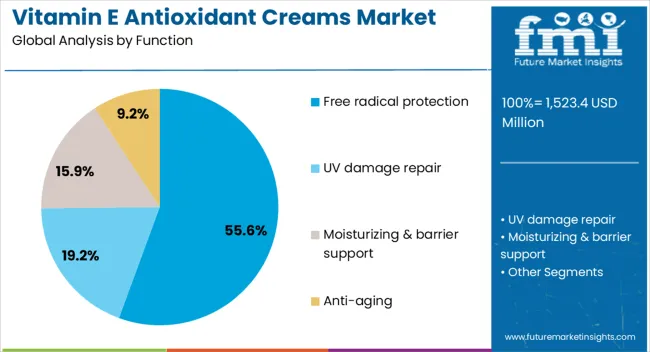
By Function, Free Radical Protection Segment Accounts for 55.6% Market Share

Vitamin E Antioxidant Creams Market Analysis By Function

The free radical protection function is projected to account for 55.6% of the vitamin E antioxidant creams market in 2025, reaffirming its position as the category’s core benefit. Consumers increasingly understand the link between environmental stressors, such as pollution, UV exposure, and digital blue light, and premature skin aging. Vitamin E’s well-documented antioxidant properties directly address these concerns by neutralizing free radicals, preventing oxidative stress, and supporting skin resilience.

This function forms the foundation of most product positioning, as it represents the most recognizable and science-backed benefit of Vitamin E in skincare. Dermatologist endorsements and ongoing clinical validation continue to strengthen trust in Vitamin E formulations. With consumer lifestyles exposing skin to more environmental aggressors, free radical protection aligns with both preventative and corrective skincare goals. Its broad appeal across demographics ensures sustained dominance, making it the central growth driver of Vitamin E antioxidant cream demand.
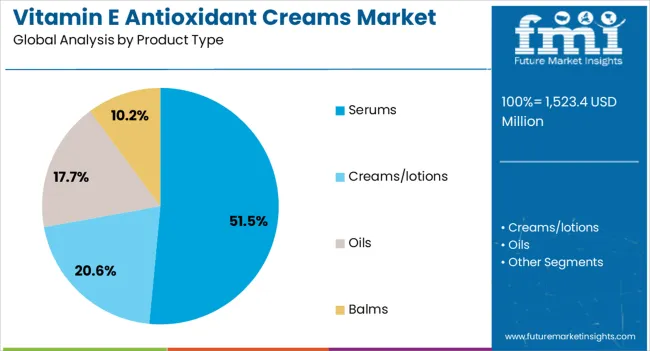
By Product Type, Serums Segment Accounts for 51.5% Market Share

Vitamin E Antioxidant Creams Market Analysis By Product Type

Serums are projected to represent 51.5% of vitamin E antioxidant cream demand in 2025, underscoring their role as the preferred product type for concentrated antioxidant delivery. Consumers gravitate toward serums for their lightweight textures, rapid absorption, and ability to penetrate deeply into the skin, maximizing the efficacy of Vitamin E actives. Positioned as premium, targeted treatments, serums offer both preventative benefits, such as protecting against oxidative stress, and corrective benefits, including improving skin tone and texture.

The segment is supported by the rising popularity of multi-step routines, where serums play a central role in layering strategies. Additionally, brands are increasingly combining Vitamin E with complementary actives like Vitamin C, hyaluronic acid, or peptides, enhancing appeal and justifying higher price points. As ingredient-savvy consumers prioritize efficacy and performance, Vitamin E-based serums will continue to dominate demand, reinforcing their premium positioning within the antioxidant skincare market.
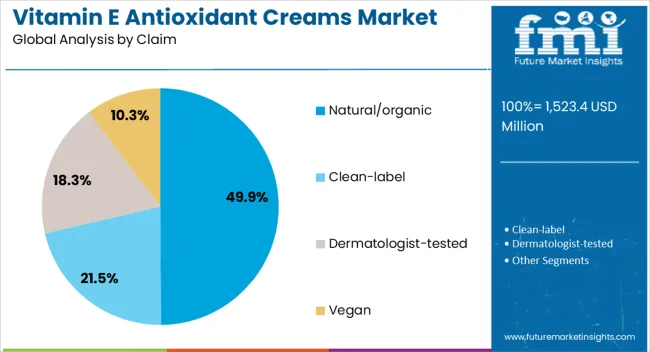
By Claim, Natural/Organic Segment Accounts for 49.9% Market Share

Vitamin E Antioxidant Creams Market Analysis By Claim

The natural/organic claim is forecasted to contribute 49.9% of the vitamin E antioxidant creams market in 2025, reflecting the growing intersection of clean beauty and efficacy-driven skincare. Consumers are increasingly attentive to ingredient sourcing, preferring Vitamin E derived from natural plant oils such as sunflower, wheat germ, or soybean. This aligns with the clean beauty movement, which emphasizes transparency, safety, and environmentally responsible production methods.

Certifications and organic labeling provide credibility, reassuring buyers about product integrity and purity. The segment also benefits from consumer willingness to pay premium prices for natural formulations that combine performance with ethical and sustainable values. With heightened regulatory oversight and rising awareness of synthetic ingredient controversies, natural and organic claims serve as powerful differentiators, making them a critical driver of trust and loyalty in the Vitamin E antioxidant creams category.

What are the Drivers, Restraints, and Key Trends of the Vitamin E Antioxidant Creams Market?

The vitamin E antioxidant creams market is advancing rapidly due to increasing consumer awareness about skin protection and growing demand for multifunctional skincare products. However, the market faces challenges including ingredient sourcing volatility, formulation stability issues, and competition from other antioxidant ingredients. Innovation in delivery systems and sustainable sourcing practices continue to influence product development and market expansion patterns.

Expansion of E-commerce and Direct-to-Consumer Channels

The growing adoption of e-commerce platforms is enabling brands to reach consumers directly and provide personalized skincare recommendations. Online channels offer convenience, detailed product information, and customer reviews that influence purchasing decisions. Social media marketing and influencer partnerships are driving brand awareness and product adoption, particularly among younger demographics who prefer online shopping experiences.

Integration of Advanced Delivery Systems and Formulation Technologies

Modern vitamin E cream manufacturers are incorporating advanced delivery systems such as liposomes, microencapsulation, and nanotechnology to enhance ingredient stability and skin penetration. These technologies improve the efficacy of vitamin E while extending product shelf life and providing better user experience. Advanced formulation techniques also enable combination products that deliver multiple skincare benefits in single applications.
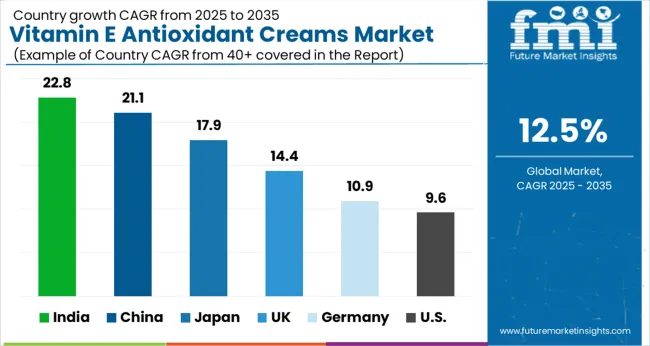
Vitamin E Antioxidant Creams Market Analysis by Key Country

Vitamin E Antioxidant Creams Market Cagr Analysis By Country

Countries CAGR (2025 to 2035)
India 22.8%
China 21.1%
Japan 17.9%
UK 14.4%
Germany 10.9%
USA 9.6%

The vitamin E antioxidant creams market is experiencing robust growth globally, with India leading at a 22.8% CAGR through 2035, driven by rising disposable income, increasing beauty consciousness, and growing penetration of international skincare brands. China follows closely at 21.1%, supported by strong e-commerce infrastructure, social media influence, and increasing demand for premium skincare products. Japan shows steady growth at 17.9%, emphasizing quality formulations and advanced skincare technologies. The UK records 14.4%, focusing on clean beauty trends and dermatologist-recommended products. Germany shows 10.9% growth, prioritizing natural ingredients and sustainable beauty practices.

The report covers an in-depth analysis of 40+ countries; six top-performing countries are highlighted below.

China Leads Asian Market Growth with Beauty Technology Innovation

Revenue from vitamin E antioxidant creams in China is projected to exhibit strong growth with a CAGR of 21.1% through 2035, driven by rapid adoption of skincare routines among younger consumers and increasing influence of social media beauty trends. The country's expanding middle class and growing beauty consciousness are creating significant demand for premium antioxidant skincare products. Major international and domestic beauty brands are establishing comprehensive distribution networks to serve the growing population of skincare-conscious consumers across tier-1 and tier-2 cities.

  • Government support for cosmetics industry development and quality standards is driving demand for certified and safe skincare products throughout major metropolitan areas.
  • E-commerce platform growth and live-streaming shopping are supporting rapid product adoption and brand awareness among digital-native consumers nationwide.

India Demonstrates Exceptional Market Potential with Rising Beauty Awareness

Revenue from vitamin E antioxidant creams in India is expanding at a CAGR of 22.8%, supported by increasing disposable income, growing beauty awareness, and rising penetration of premium skincare brands. The country's young demographic profile and increasing exposure to global beauty trends are driving demand for effective antioxidant skincare solutions. International beauty brands and domestic manufacturers are establishing distribution channels to serve the growing demand for quality skincare products.
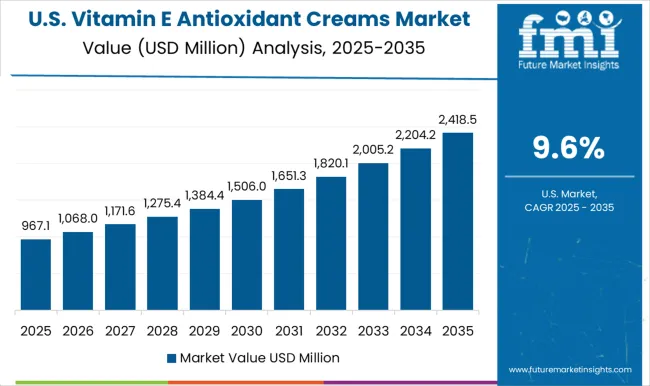
  • Rising awareness about skin protection from pollution and environmental stressors is creating opportunities for specialized antioxidant skincare products across urban and semi-urban markets.
  • Growing influence of beauty influencers and social media platforms is driving product education and adoption among younger consumers seeking effective skincare solutions.

United States Focuses on Premium Formulations and Clean Beauty

Vitamin E Antioxidant Creams Market Country Value Analysis

Demand for vitamin E antioxidant creams in the USA is projected to grow at a CAGR of 9.6%, supported by consumer preference for clean beauty products and dermatologist-recommended skincare solutions. American consumers are increasingly focused on ingredient transparency, product efficacy, and sustainable beauty practices. The market is characterized by strong demand for premium formulations that combine vitamin E with other active ingredients for enhanced skincare benefits.
  • Clean beauty movement and natural ingredient preference are driving demand for vitamin E products derived from organic and sustainable sources throughout retail channels.
  • Dermatologist recommendations and clinical studies are supporting product credibility and consumer confidence in vitamin E antioxidant cream efficacy and safety.

Japan Maintains Leadership with Advanced Skincare Innovation

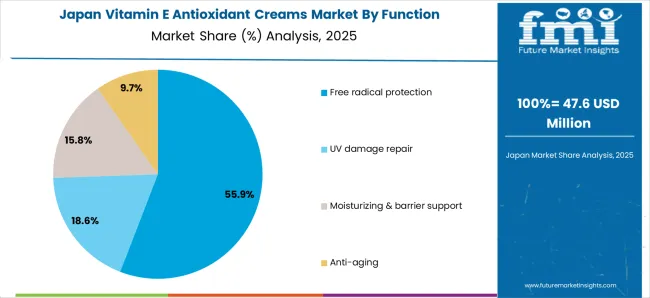
Vitamin E Antioxidant Creams Market Japan Market Share Analysis By Function

Revenue from vitamin E antioxidant creams in Japan is projected to grow at a CAGR of 17.9% through 2035, driven by the country’s strong focus on skincare technology, premium product positioning, and consumer preference for clinically proven formulations. Japanese consumers consistently demand high-quality, multifunctional products that deliver visible results while maintaining ingredient safety.

  • Ongoing investment in research and development is supporting next-generation vitamin E formulations that combine antioxidant protection with advanced delivery systems for superior efficacy.
  • Collaboration between domestic cosmetic manufacturers and biotechnology firms is enhancing product innovation, reinforcing Japan’s position as a leader in science-driven antioxidant skincare solutions.

United Kingdom Strengthens Market with Premium Skincare Adoption

Revenue from vitamin E antioxidant creams in the UK is projected to grow at a CAGR of 14.4% through 2035, supported by rising consumer interest in clean beauty and multifunctional skincare solutions. British consumers value ingredient transparency, sustainability, and proven efficacy, positioning vitamin E creams as a core component of premium skincare routines.
  • Growth in online retail channels and professional skincare distribution is increasing accessibility of vitamin E creams across diverse consumer demographics.
  • Rising demand for eco-conscious and cruelty-free formulations is encouraging beauty brands to integrate sustainably sourced vitamin E into their antioxidant product lines.

Germany Anchors Growth with Science-Backed Skincare Standards

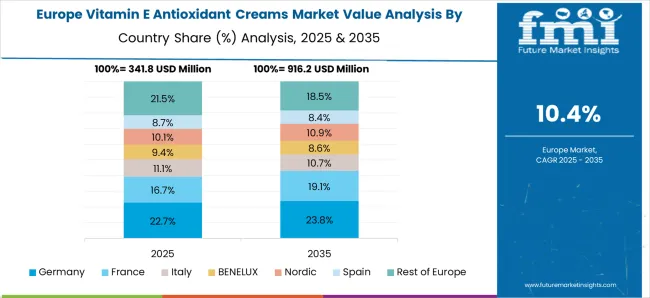
Vitamin E Antioxidant Creams Market Europe Country Market Share Analysis, 2025 & 2035

Revenue from vitamin E antioxidant creams in Germany is projected to grow at a CAGR of 10.9% through 2035, supported by the country’s strong emphasis on dermatological validation, product safety, and clean-label transparency. German consumers prioritize clinically proven efficacy and natural origins, making vitamin E antioxidant creams a trusted choice in the premium skincare segment.
  • Strict EU regulations and consumer demand for safe, high-quality formulations are driving manufacturers to adopt sustainable sourcing and rigorous testing for vitamin E–based products.
  • Pharmacies, dermatology clinics, and premium e-commerce platforms are enhancing product distribution, while dermatologist endorsements are supporting consumer confidence in antioxidant skincare efficacy.

Competitive Landscape of Vitamin E Antioxidant Creams Market

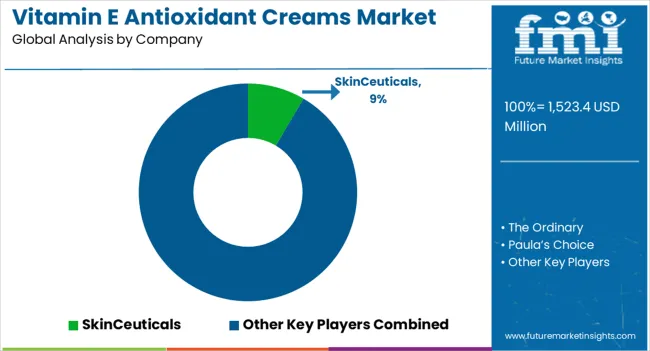
Vitamin E Antioxidant Creams Market Analysis By Company

The vitamin E antioxidant creams market is characterized by competition among established skincare brands, specialty beauty companies, and emerging clean beauty players. Companies are investing in advanced formulation technologies, sustainable sourcing practices, premium packaging, and digital marketing strategies to deliver effective, appealing, and accessible antioxidant skincare solutions. Brand positioning, ingredient innovation, and channel expansion are central to strengthening product portfolios and market presence.

SkinCeuticals, USA-based, leads the market with 9% global value share, offering clinically-proven vitamin E formulations with a focus on antioxidant protection and skin health. The Ordinary, UK, provides accessible, high-concentration vitamin E products with transparent ingredient communication and minimalist packaging. Paula's Choice, USA, delivers science-backed formulations with emphasis on ingredient efficacy and consumer education. Drunk Elephant, USA, focuses on clean, effective formulations that combine vitamin E with complementary active ingredients.

Estée Lauder and L'Oréal, operating globally, provide comprehensive vitamin E product ranges across multiple price points and distribution channels. Kiehl's, USA, emphasizes natural ingredients and heritage formulations with premium positioning. Clinique, USA, offers dermatologist-developed products with clinical testing and hypoallergenic formulations. Murad and Derma E provide specialized antioxidant solutions with focus on specific skin concerns and natural ingredient preferences.

Key Players in the Vitamin E Antioxidant Creams Market

  • SkinCeuticals
  • The Ordinary
  • Paula's Choice
  • Drunk Elephant
  • Estée Lauder
  • L'Oréal
  • Kiehl's
  • Clinique
  • Murad
  • Derma E

Scope of the Report

Items Values
Quantitative Units (2025) USD 1,523.4 million
Function Free radical protection, UV damage repair, Moisturizing & barrier support, Anti-aging
Source Synthetic tocopherol, Natural tocopherol, Mixed tocopherols, Tocotrienols
Product Type Creams/lotions, Serums, Oils, Balms
Channel E-commerce, Pharmacies, Mass retail, Specialty beauty retail
Claim Natural/organic, Clean-label, Dermatologist-tested, Vegan
Regions Covered North America, Europe, East Asia, South Asia & Pacific, Latin America, Middle East & Africa
Countries Covered United States, Canada, United Kingdom, Germany, France, China, Japan, South Korea, India, Brazil, Australia and 40+ countries
Key Companies Profiled SkinCeuticals, The Ordinary, Paula's Choice, Drunk Elephant, Estée Lauder, L'Oréal, Kiehl's, Clinique, Murad, and Derma E
Additional Attributes Dollar sales by vitamin E type and concentration level, regional demand trends, competitive landscape, buyer preferences for natural versus synthetic sources, integration with clean-label/dermatologist-tested positioning, innovations in nanoencapsulation, controlled release, and sustainable sourcing practices

Vitamin E Antioxidant Creams Market by Segments

Function:

  • Free radical protection
  • UV damage repair
  • Moisturizing & barrier support
  • Anti-aging

Source:

  • Synthetic tocopherol
  • Natural tocopherol (soy, sunflower, wheat germ)
  • Mixed tocopherols
  • Tocotrienols

Product Type:

  • Creams/lotions
  • Serums
  • Oils
  • Balms

Channel:

  • E-commerce
  • Pharmacies
  • Mass retail
  • Specialty beauty retail

Claim:

  • Natural/organic
  • Clean-label
  • Dermatologist-tested
  • Vegan

Region:

  • North America
  • United States
  • Canada
  • Mexico
  • Europe
  • Germany
  • United Kingdom
  • France
  • Italy
  • Spain
  • Nordic
  • BENELUX
  • Rest of Europe
  • East Asia
  • China
  • Japan
  • South Korea
  • South Asia & Pacific
  • India
  • ASEAN
  • Australia & New Zealand
  • Rest of South Asia & Pacific
  • Latin America
  • Brazil
  • Chile
  • Rest of Latin America
  • Middle East & Africa
  • Kingdom of Saudi Arabia
  • Other GCC Countries
  • Turkiye
  • South Africa
  • Other African Union
  • Rest of Middle East & Africa

Table of Content

  1. Executive Summary
    • Global Market Outlook
    • Demand-side Trends
    • Supply-side Trends
    • Technology Roadmap Analysis
    • Analysis and Recommendations
  2. Market Overview
    • Market Coverage / Taxonomy
    • Market Definition / Scope / Limitations
  3. Market Background
    • Market Dynamics
      • Drivers
      • Restraints
      • Opportunity
      • Trends
    • Scenario Forecast
      • Demand in Optimistic Scenario
      • Demand in Likely Scenario
      • Demand in Conservative Scenario
    • Opportunity Map Analysis
    • Product Life Cycle Analysis
    • Supply Chain Analysis
    • Investment Feasibility Matrix
    • Value Chain Analysis
    • PESTLE and Porter’s Analysis
    • Regulatory Landscape
    • Regional Parent Market Outlook
    • Production and Consumption Statistics
    • Import and Export Statistics
  4. Global Market Analysis 2020-2024 and Forecast, 2025-2035
    • Historical Market Size Value (USD Million) Analysis, 2020-2024
    • Current and Future Market Size Value (USD Million) Projections, 2025-2035
      • Y-o-Y Growth Trend Analysis
      • Absolute $ Opportunity Analysis
  5. Global Market Pricing Analysis 2020-2024 and Forecast 2025-2035
  6. Global Market Analysis 2020-2024 and Forecast 2025-2035, By Function
    • Introduction / Key Findings
    • Historical Market Size Value (USD Million) Analysis By Function , 2020-2024
    • Current and Future Market Size Value (USD Million) Analysis and Forecast By Function , 2025-2035
      • Free radical protection
      • UV damage repair
      • Moisturizing & barrier support
      • Anti-aging
    • Y-o-Y Growth Trend Analysis By Function , 2020-2024
    • Absolute $ Opportunity Analysis By Function , 2025-2035
  7. Global Market Analysis 2020-2024 and Forecast 2025-2035, By Product Type
    • Introduction / Key Findings
    • Historical Market Size Value (USD Million) Analysis By Product Type , 2020-2024
    • Current and Future Market Size Value (USD Million) Analysis and Forecast By Product Type , 2025-2035
      • Serums
      • Creams/lotions
      • Oils
      • Balms
    • Y-o-Y Growth Trend Analysis By Product Type , 2020-2024
    • Absolute $ Opportunity Analysis By Product Type , 2025-2035
  8. Global Market Analysis 2020-2024 and Forecast 2025-2035, By Claim
    • Introduction / Key Findings
    • Historical Market Size Value (USD Million) Analysis By Claim , 2020-2024
    • Current and Future Market Size Value (USD Million) Analysis and Forecast By Claim , 2025-2035
      • Natural/organic
      • Clean-label
      • Dermatologist-tested
      • Vegan
    • Y-o-Y Growth Trend Analysis By Claim , 2020-2024
    • Absolute $ Opportunity Analysis By Claim , 2025-2035
  9. Global Market Analysis 2020-2024 and Forecast 2025-2035, By
    • Introduction / Key Findings
    • Historical Market Size Value (USD Million) Analysis By , 2020-2024
    • Current and Future Market Size Value (USD Million) Analysis and Forecast By , 2025-2035
  10. Y-o-Y Growth Trend Analysis By , 2020-2024
  11. Absolute $ Opportunity Analysis By , 2025-2035
  12. Global Market Analysis 2020-2024 and Forecast 2025-2035, By
    • Introduction / Key Findings
    • Historical Market Size Value (USD Million) Analysis By , 2020-2024
    • Current and Future Market Size Value (USD Million) Analysis and Forecast By , 2025-2035
  13. Y-o-Y Growth Trend Analysis By , 2020-2024
  14. Absolute $ Opportunity Analysis By , 2025-2035
  15. Global Market Analysis 2020-2024 and Forecast 2025-2035, By
    • Introduction / Key Findings
    • Historical Market Size Value (USD Million) Analysis By , 2020-2024
    • Current and Future Market Size Value (USD Million) Analysis and Forecast By , 2025-2035
  16. Y-o-Y Growth Trend Analysis By , 2020-2024
  17. Absolute $ Opportunity Analysis By , 2025-2035
  18. Global Market Analysis 2020-2024 and Forecast 2025-2035, By
    • Introduction / Key Findings
    • Historical Market Size Value (USD Million) Analysis By , 2020-2024
    • Current and Future Market Size Value (USD Million) Analysis and Forecast By , 2025-2035
  19. Y-o-Y Growth Trend Analysis By , 2020-2024
  20. Absolute $ Opportunity Analysis By , 2025-2035
  21. Global Market Analysis 2020-2024 and Forecast 2025-2035, By Region
    • Introduction
    • Historical Market Size Value (USD Million) Analysis By Region, 2020-2024
    • Current Market Size Value (USD Million) Analysis and Forecast By Region, 2025-2035
      • North America
      • Latin America
      • Western Europe
      • Eastern Europe
      • East Asia
      • South Asia and Pacific
      • Middle East & Africa
    • Market Attractiveness Analysis By Region
  22. North America Market Analysis 2020-2024 and Forecast 2025-2035, By Country
    • Historical Market Size Value (USD Million) Trend Analysis By Market Taxonomy, 2020-2024
    • Market Size Value (USD Million) Forecast By Market Taxonomy, 2025-2035
      • By Country
        • USA
        • Canada
        • Mexico
      • By Function
      • By Product Type
      • By Claim
      • By
      • By
      • By
      • By
    • Market Attractiveness Analysis
      • By Country
      • By Function
      • By Product Type
      • By Claim
      • By
      • By
      • By
      • By
    • Key Takeaways
  23. Latin America Market Analysis 2020-2024 and Forecast 2025-2035, By Country
    • Historical Market Size Value (USD Million) Trend Analysis By Market Taxonomy, 2020-2024
    • Market Size Value (USD Million) Forecast By Market Taxonomy, 2025-2035
      • By Country
        • Brazil
        • Chile
        • Rest of Latin America
      • By Function
      • By Product Type
      • By Claim
      • By
      • By
      • By
      • By
    • Market Attractiveness Analysis
      • By Country
      • By Function
      • By Product Type
      • By Claim
      • By
      • By
      • By
      • By
    • Key Takeaways
  24. Western Europe Market Analysis 2020-2024 and Forecast 2025-2035, By Country
    • Historical Market Size Value (USD Million) Trend Analysis By Market Taxonomy, 2020-2024
    • Market Size Value (USD Million) Forecast By Market Taxonomy, 2025-2035
      • By Country
        • Germany
        • UK
        • Italy
        • Spain
        • France
        • Nordic
        • BENELUX
        • Rest of Western Europe
      • By Function
      • By Product Type
      • By Claim
      • By
      • By
      • By
      • By
    • Market Attractiveness Analysis
      • By Country
      • By Function
      • By Product Type
      • By Claim
      • By
      • By
      • By
      • By
    • Key Takeaways
  25. Eastern Europe Market Analysis 2020-2024 and Forecast 2025-2035, By Country
    • Historical Market Size Value (USD Million) Trend Analysis By Market Taxonomy, 2020-2024
    • Market Size Value (USD Million) Forecast By Market Taxonomy, 2025-2035
      • By Country
        • Russia
        • Poland
        • Hungary
        • Balkan & Baltic
        • Rest of Eastern Europe
      • By Function
      • By Product Type
      • By Claim
      • By
      • By
      • By
      • By
    • Market Attractiveness Analysis
      • By Country
      • By Function
      • By Product Type
      • By Claim
      • By
      • By
      • By
      • By
    • Key Takeaways
  26. East Asia Market Analysis 2020-2024 and Forecast 2025-2035, By Country
    • Historical Market Size Value (USD Million) Trend Analysis By Market Taxonomy, 2020-2024
    • Market Size Value (USD Million) Forecast By Market Taxonomy, 2025-2035
      • By Country
        • China
        • Japan
        • South Korea
      • By Function
      • By Product Type
      • By Claim
      • By
      • By
      • By
      • By
    • Market Attractiveness Analysis
      • By Country
      • By Function
      • By Product Type
      • By Claim
      • By
      • By
      • By
      • By
    • Key Takeaways
  27. South Asia and Pacific Market Analysis 2020-2024 and Forecast 2025-2035, By Country
    • Historical Market Size Value (USD Million) Trend Analysis By Market Taxonomy, 2020-2024
    • Market Size Value (USD Million) Forecast By Market Taxonomy, 2025-2035
      • By Country
        • India
        • ASEAN
        • Australia & New Zealand
        • Rest of South Asia and Pacific
      • By Function
      • By Product Type
      • By Claim
      • By
      • By
      • By
      • By
    • Market Attractiveness Analysis
      • By Country
      • By Function
      • By Product Type
      • By Claim
      • By
      • By
      • By
      • By
    • Key Takeaways
  28. Middle East & Africa Market Analysis 2020-2024 and Forecast 2025-2035, By Country
    • Historical Market Size Value (USD Million) Trend Analysis By Market Taxonomy, 2020-2024
    • Market Size Value (USD Million) Forecast By Market Taxonomy, 2025-2035
      • By Country
        • Kingdom of Saudi Arabia
        • Other GCC Countries
        • Turkiye
        • South Africa
        • Other African Union
        • Rest of Middle East & Africa
      • By Function
      • By Product Type
      • By Claim
      • By
      • By
      • By
      • By
    • Market Attractiveness Analysis
      • By Country
      • By Function
      • By Product Type
      • By Claim
      • By
      • By
      • By
      • By
    • Key Takeaways
  29. Key Countries Market Analysis
    • USA
      • Pricing Analysis
      • Market Share Analysis, 2024
        • By Function
        • By Product Type
        • By Claim
        • By
        • By
        • By
        • By
    • Canada
      • Pricing Analysis
      • Market Share Analysis, 2024
        • By Function
        • By Product Type
        • By Claim
        • By
        • By
        • By
        • By
    • Mexico
      • Pricing Analysis
      • Market Share Analysis, 2024
        • By Function
        • By Product Type
        • By Claim
        • By
        • By
        • By
        • By
    • Brazil
      • Pricing Analysis
      • Market Share Analysis, 2024
        • By Function
        • By Product Type
        • By Claim
        • By
        • By
        • By
        • By
    • Chile
      • Pricing Analysis
      • Market Share Analysis, 2024
        • By Function
        • By Product Type
        • By Claim
        • By
        • By
        • By
        • By
    • Germany
      • Pricing Analysis
      • Market Share Analysis, 2024
        • By Function
        • By Product Type
        • By Claim
        • By
        • By
        • By
        • By
    • UK
      • Pricing Analysis
      • Market Share Analysis, 2024
        • By Function
        • By Product Type
        • By Claim
        • By
        • By
        • By
        • By
    • Italy
      • Pricing Analysis
      • Market Share Analysis, 2024
        • By Function
        • By Product Type
        • By Claim
        • By
        • By
        • By
        • By
    • Spain
      • Pricing Analysis
      • Market Share Analysis, 2024
        • By Function
        • By Product Type
        • By Claim
        • By
        • By
        • By
        • By
    • France
      • Pricing Analysis
      • Market Share Analysis, 2024
        • By Function
        • By Product Type
        • By Claim
        • By
        • By
        • By
        • By
    • India
      • Pricing Analysis
      • Market Share Analysis, 2024
        • By Function
        • By Product Type
        • By Claim
        • By
        • By
        • By
        • By
    • ASEAN
      • Pricing Analysis
      • Market Share Analysis, 2024
        • By Function
        • By Product Type
        • By Claim
        • By
        • By
        • By
        • By
    • Australia & New Zealand
      • Pricing Analysis
      • Market Share Analysis, 2024
        • By Function
        • By Product Type
        • By Claim
        • By
        • By
        • By
        • By
    • China
      • Pricing Analysis
      • Market Share Analysis, 2024
        • By Function
        • By Product Type
        • By Claim
        • By
        • By
        • By
        • By
    • Japan
      • Pricing Analysis
      • Market Share Analysis, 2024
        • By Function
        • By Product Type
        • By Claim
        • By
        • By
        • By
        • By
    • South Korea
      • Pricing Analysis
      • Market Share Analysis, 2024
        • By Function
        • By Product Type
        • By Claim
        • By
        • By
        • By
        • By
    • Russia
      • Pricing Analysis
      • Market Share Analysis, 2024
        • By Function
        • By Product Type
        • By Claim
        • By
        • By
        • By
        • By
    • Poland
      • Pricing Analysis
      • Market Share Analysis, 2024
        • By Function
        • By Product Type
        • By Claim
        • By
        • By
        • By
        • By
    • Hungary
      • Pricing Analysis
      • Market Share Analysis, 2024
        • By Function
        • By Product Type
        • By Claim
        • By
        • By
        • By
        • By
    • Kingdom of Saudi Arabia
      • Pricing Analysis
      • Market Share Analysis, 2024
        • By Function
        • By Product Type
        • By Claim
        • By
        • By
        • By
        • By
    • Turkiye
      • Pricing Analysis
      • Market Share Analysis, 2024
        • By Function
        • By Product Type
        • By Claim
        • By
        • By
        • By
        • By
    • South Africa
      • Pricing Analysis
      • Market Share Analysis, 2024
        • By Function
        • By Product Type
        • By Claim
        • By
        • By
        • By
        • By
  30. Market Structure Analysis
    • Competition Dashboard
    • Competition Benchmarking
    • Market Share Analysis of Top Players
      • By Regional
      • By Function
      • By Product Type
      • By Claim
      • By
      • By
      • By
      • By
  31. Competition Analysis
    • Competition Deep Dive
      • SkinCeuticals
        • Overview
        • Product Portfolio
        • Profitability by Market Segments (Product/Age /Sales Channel/Region)
        • Sales Footprint
        • Strategy Overview
          • Marketing Strategy
          • Product Strategy
          • Channel Strategy
      • The Ordinary
      • Paula’s Choice
      • Drunk Elephant
      • Estée Lauder
      • L’Oréal
      • Kiehl’s
      • Clinique
      • Murad
      • Derma E
  32. Assumptions & Acronyms Used
  33. Research Methodology

List of Tables

  • Table 1: Global Market Value (USD Million) Forecast by Region, 2020-2035
  • Table 2: Global Market Value (USD Million) Forecast by Function , 2020-2035
  • Table 3: Global Market Value (USD Million) Forecast by Product Type , 2020-2035
  • Table 4: Global Market Value (USD Million) Forecast by Claim , 2020-2035
  • Table 5: Global Market Value (USD Million) Forecast by , 2020-2035
  • Table 6: Global Market Value (USD Million) Forecast by , 2020-2035
  • Table 7: Global Market Value (USD Million) Forecast by , 2020-2035
  • Table 8: Global Market Value (USD Million) Forecast by , 2020-2035
  • Table 9: North America Market Value (USD Million) Forecast by Country, 2020-2035
  • Table 10: North America Market Value (USD Million) Forecast by Function , 2020-2035
  • Table 11: North America Market Value (USD Million) Forecast by Product Type , 2020-2035
  • Table 12: North America Market Value (USD Million) Forecast by Claim , 2020-2035
  • Table 13: North America Market Value (USD Million) Forecast by , 2020-2035
  • Table 14: North America Market Value (USD Million) Forecast by , 2020-2035
  • Table 15: North America Market Value (USD Million) Forecast by , 2020-2035
  • Table 16: North America Market Value (USD Million) Forecast by , 2020-2035
  • Table 17: Latin America Market Value (USD Million) Forecast by Country, 2020-2035
  • Table 18: Latin America Market Value (USD Million) Forecast by Function , 2020-2035
  • Table 19: Latin America Market Value (USD Million) Forecast by Product Type , 2020-2035
  • Table 20: Latin America Market Value (USD Million) Forecast by Claim , 2020-2035
  • Table 21: Latin America Market Value (USD Million) Forecast by , 2020-2035
  • Table 22: Latin America Market Value (USD Million) Forecast by , 2020-2035
  • Table 23: Latin America Market Value (USD Million) Forecast by , 2020-2035
  • Table 24: Latin America Market Value (USD Million) Forecast by , 2020-2035
  • Table 25: Western Europe Market Value (USD Million) Forecast by Country, 2020-2035
  • Table 26: Western Europe Market Value (USD Million) Forecast by Function , 2020-2035
  • Table 27: Western Europe Market Value (USD Million) Forecast by Product Type , 2020-2035
  • Table 28: Western Europe Market Value (USD Million) Forecast by Claim , 2020-2035
  • Table 29: Western Europe Market Value (USD Million) Forecast by , 2020-2035
  • Table 30: Western Europe Market Value (USD Million) Forecast by , 2020-2035
  • Table 31: Western Europe Market Value (USD Million) Forecast by , 2020-2035
  • Table 32: Western Europe Market Value (USD Million) Forecast by , 2020-2035
  • Table 33: Eastern Europe Market Value (USD Million) Forecast by Country, 2020-2035
  • Table 34: Eastern Europe Market Value (USD Million) Forecast by Function , 2020-2035
  • Table 35: Eastern Europe Market Value (USD Million) Forecast by Product Type , 2020-2035
  • Table 36: Eastern Europe Market Value (USD Million) Forecast by Claim , 2020-2035
  • Table 37: Eastern Europe Market Value (USD Million) Forecast by , 2020-2035
  • Table 38: Eastern Europe Market Value (USD Million) Forecast by , 2020-2035
  • Table 39: Eastern Europe Market Value (USD Million) Forecast by , 2020-2035
  • Table 40: Eastern Europe Market Value (USD Million) Forecast by , 2020-2035
  • Table 41: East Asia Market Value (USD Million) Forecast by Country, 2020-2035
  • Table 42: East Asia Market Value (USD Million) Forecast by Function , 2020-2035
  • Table 43: East Asia Market Value (USD Million) Forecast by Product Type , 2020-2035
  • Table 44: East Asia Market Value (USD Million) Forecast by Claim , 2020-2035
  • Table 45: East Asia Market Value (USD Million) Forecast by , 2020-2035
  • Table 46: East Asia Market Value (USD Million) Forecast by , 2020-2035
  • Table 47: East Asia Market Value (USD Million) Forecast by , 2020-2035
  • Table 48: East Asia Market Value (USD Million) Forecast by , 2020-2035
  • Table 49: South Asia and Pacific Market Value (USD Million) Forecast by Country, 2020-2035
  • Table 50: South Asia and Pacific Market Value (USD Million) Forecast by Function , 2020-2035
  • Table 51: South Asia and Pacific Market Value (USD Million) Forecast by Product Type , 2020-2035
  • Table 52: South Asia and Pacific Market Value (USD Million) Forecast by Claim , 2020-2035
  • Table 53: South Asia and Pacific Market Value (USD Million) Forecast by , 2020-2035
  • Table 54: South Asia and Pacific Market Value (USD Million) Forecast by , 2020-2035
  • Table 55: South Asia and Pacific Market Value (USD Million) Forecast by , 2020-2035
  • Table 56: South Asia and Pacific Market Value (USD Million) Forecast by , 2020-2035
  • Table 57: Middle East & Africa Market Value (USD Million) Forecast by Country, 2020-2035
  • Table 58: Middle East & Africa Market Value (USD Million) Forecast by Function , 2020-2035
  • Table 59: Middle East & Africa Market Value (USD Million) Forecast by Product Type , 2020-2035
  • Table 60: Middle East & Africa Market Value (USD Million) Forecast by Claim , 2020-2035
  • Table 61: Middle East & Africa Market Value (USD Million) Forecast by , 2020-2035
  • Table 62: Middle East & Africa Market Value (USD Million) Forecast by , 2020-2035
  • Table 63: Middle East & Africa Market Value (USD Million) Forecast by , 2020-2035
  • Table 64: Middle East & Africa Market Value (USD Million) Forecast by , 2020-2035

List of Figures

  • Figure 1: Global Market Pricing Analysis
  • Figure 2: Global Market Value (USD Million) Forecast 2020-2035
  • Figure 3: Global Market Value (USD Million) Share and BPS Analysis by Region, 2025 and 2035
  • Figure 4: Global Market Y-o-Y Growth Comparison by Region, 2025-2035
  • Figure 5: Global Market Attractiveness Analysis by Region
  • Figure 6: North America Market Incremental Dollar Opportunity, 2025-2035
  • Figure 7: Latin America Market Incremental Dollar Opportunity, 2025-2035
  • Figure 8: Western Europe Market Incremental Dollar Opportunity, 2025-2035
  • Figure 9: Eastern Europe Market Incremental Dollar Opportunity, 2025-2035
  • Figure 10: East Asia Market Incremental Dollar Opportunity, 2025-2035
  • Figure 11: South Asia and Pacific Market Incremental Dollar Opportunity, 2025-2035
  • Figure 12: Middle East & Africa Market Incremental Dollar Opportunity, 2025-2035
  • Figure 13: North America Market Value Share and BPS Analysis by Country, 2025 and 2035
  • Figure 14: Latin America Market Value Share and BPS Analysis by Country, 2025 and 2035
  • Figure 15: Western Europe Market Value Share and BPS Analysis by Country, 2025 and 2035
  • Figure 16: Eastern Europe Market Value Share and BPS Analysis by Country, 2025 and 2035
  • Figure 17: East Asia Market Value Share and BPS Analysis by Country, 2025 and 2035
  • Figure 18: South Asia and Pacific Market Value Share and BPS Analysis by Country, 2025 and 2035
  • Figure 19: Middle East & Africa Market Value Share and BPS Analysis by Country, 2025 and 2035
  • Figure 20: Global Market - Tier Structure Analysis
  • Figure 21: Global Market - Company Share Analysis

Frequently Asked Questions

How big is the vitamin e antioxidant creams market in 2025?

The global vitamin e antioxidant creams market is estimated to be valued at USD 1,523.4 million in 2025.

What will be the size of vitamin e antioxidant creams market in 2035?

The market size for the vitamin e antioxidant creams market is projected to reach USD 4,947.0 million by 2035.

How much will be the vitamin e antioxidant creams market growth between 2025 and 2035?

The vitamin e antioxidant creams market is expected to grow at a 12.5% CAGR between 2025 and 2035.

What are the key product types in the vitamin e antioxidant creams market?

The key product types in vitamin e antioxidant creams market are free radical protection , uv damage repair, moisturizing & barrier support and anti-aging.

Which product type segment to contribute significant share in the vitamin e antioxidant creams market in 2025?

In terms of product type , serums segment to command 51.5% share in the vitamin e antioxidant creams market in 2025.

Explore Similar Insights

Future Market Insights

Vitamin E Antioxidant Creams Market

Chat With

MaRIA

Hi There, I am MaRIA, Your Market Research Intelligence Assistant. How may I help you?