Neurological Biomarkers Market
Market Insights on Neurological Biomarkers covering sales outlook, demand forecast & up-to-date key trends
Neurological Biomarkers Market By Type (Genomics Biomarker, Proteomics Biomarkers, Metabolomics Biomarkers, Imaging Biomarkers, Others), Application (Alzheimer's Disease, Parkinson's Disease, Huntington's Disease), End-User & Region - Forecast for 2022 - 2028.
Neurological Biomarkers Market Snapshot
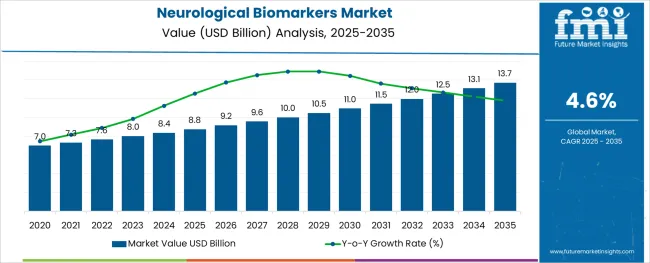
[259 Pages Report] According to Future Market Insights, global Neurological Biomarkers Market size was valued at US$ 7.2 Bn in 2021 and is expected to reach USD 9.9 Bn by 2028. The market is expected to grow at a CAGR of 4.6% from 2022 to 2028.The neurological biomarkers market accounts for approximately 16.6% of the global biomarkers market valued at U.S. $ 43.3 Bn in the year 2021. Biomarker/Biological Marker are naturally occurring biological molecules, which is used as an indicator of biological process, diagnosis, prognosis, pharmacological response to medical intervention and pathophysiology of disease. Biomarkers play a very important role in drug discovery and development since they are helpful in determining the precision of the medicine. High attrition rate of drug development procedure can be improved by using biomarkers in predictive evaluation of drug action in clinical trials.
In 2004, the U.S. FDA introduced the Critical Path Initiative to help manufacturers modernize drug development process by incorporating biomarkers in prediction of effectiveness, evaluation of drug safety and effectiveness and mechanism of drug action. Since biomarkers are of utmost importance in drug development, the rapidly expanding pharmaceutical industry will positively impact the growth of neurological biomarkers market.
Neurological disorders are diagnosed with cognitive testing, clinical history, structural MRI and neurological examination. However, there are few circumstances wherein identification of specific biomarker is required to understand the diagnosis and treatment of the disease.
For instance, according to the Alzheimer’s Society, in the year 2019, over 850,000 people in the U.K. were suffering from dementia, which meant, in every 14 people above 65 years of age, 1 person suffered from dementia. In accordance to the current prevalence of this disorder, the expected number of people suffering from dementia would rise to 1.5 million by 2040. Rising prevalence of neurological disorders and lack of effective diagnosis of these conditions are expected to fuel the growth of the neurology biomarkers market.
The continuously evolving role of biomarkers in the field of neurology, increasing research and development initiatives, rising demand for personalised medicine are some of the other factors which are expected to fuel the growth of neurological biomarkers market over the forecast period.
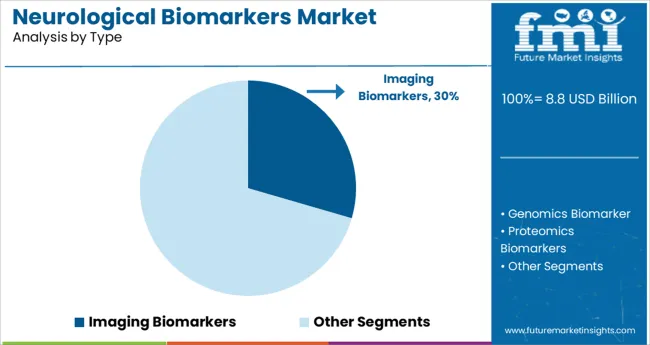
The sales for genomics biomarkers are expected to reach U.S. $ 3.04 Bn by the end of 2028, which contributes to about 30.5% of the total sales of neurological biomarkers in the field of neurodegenerative disorders. The use of genetic biomarkers is an ongoing area of research and is expected to gain momentum over the forecast period.
Neurological Biomarkers Market Outlook:
Data Points |
Market Insights |
Market Value 2022 |
USD 7.57 Bn |
Market Value 2028 |
USD 9.91 Bn |
CAGR 2022-2028 |
4.6% |
Share of top 5 countries |
55.3% |
Key Players |
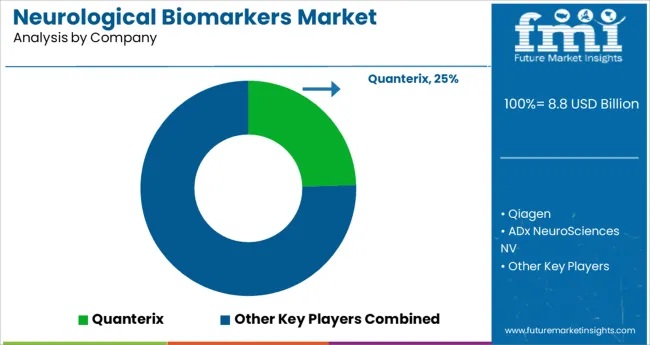
The key players of this industry are Quanterix, Qiagen, ADx NeuroSciences NV, Merck KGaA, Enrolmmun, Thermo Fisher Scientific, ACOBIOM, Banyan Biomarkers, Inc., Olink Biosciences, and Bio-Rad Laboratories Inc. |
Let us know your requirement to get
100% FREE customization
How The Market Progressed Till June 2022?
Particulars |
Details |
H1, 2021 |
4.84% |
H1, 2022 Projected |
4.59% |
H1, 2022 Outlook |
4.49% |
BPS Change - H1, 2022 (O) – H1, 2022 (P) |
(-) 10 ↓ |
BPS Change – H1, 2022 (O) – H1, 2021 |
(-) 35 ↓ |
Analysis conducted by Future Market Insights reveals that the market is expected to decline by 35 Basis Point Share (BPS) in H1 – 2022 (O) as compared with H1-2021. The global neurological biomarkers market displays influenced growth dynamics with regulatory approvals and innovation factors in accordance with impact of macro and industry factors.
Major reasons for this dip in BPS are attributed to limitation in assessing temporal relationships by cross-sectional nature of neuropathology. The comparative analysis and market growth rate of global neurological biomarkers market as studied by Future Market Insights, will show a negative BPS growth in H1-2022 outlook as compared to H1-2022 projected period by 10 BPS
The market growth rates and development prospects and their comparative analysis have been presented by FMI about the global neurological biomarkers market. The primary advancements in this market include technological developments with increased resolution and precision of instruments and assays, as well as interchangeability from one discipline of neurology to another.
Other market segments are correspondingly set to perform objectively and attain promising growth prospects in the next half of projection period.
Apart from these elements, there are some driving points that influence the industry growth, including the development of blood-based biomarkers and advances in imaging markers in neurology. Additional developments observe clinical studies aiming to predict disease progression using baseline imaging or fluid biomarkers.
2012-2021 Neurological Biomarkers Demand Outlook Compared to 2022-2028 Forecast
According to Future Market Insights (FMI), the neurological biomarkers market expanded at a CAGR of 4.9% during the period of 2012-2021. Rising levels of interest in the efficiency of biomarkers in the field of drug discovery and development, their importance in diagnosis of neurodegenerative diseases, and emphasis on personalised medicine using biomarkers are some of the key drivers of this market.
Recent advances in genomics & proteomics in combination with biostatistics & bioinformatics accelerated the development of specific biomarkers in management of chronic diseases. Biomarkers provide indications for early diagnosis of a disease and help in understanding the pathophysiology as well as the prognosis.
The key players of this industry are focusing on forming strategic collaborations, acquiring businesses beneficial for their growth to improve their market presence and generate new revenue streams.
In March 2018, Quanterix Corporation announced a strategic collaboration with DestinA Genomics with the aim to focus their collective efforts on the transformation of microrna biomarker detection.
In December 2021, Thermo Fisher Scientific announced the acquisition of PPD, a clinical research and laboratory service provider. This acquisition will help the company provide its customers enhanced capabilities to accelerate their innovations and drug development processes.
The market is consolidated with key players such as Quanterix, Qiagen, ADx NeuroSciences NV, Merck KGaA, Enrolmmun, Thermo Fisher Scientific, ACOBIOM, Banyan Biomarkers, Inc., Olink Biosciences, and Bio-Rad Laboratories Inc.
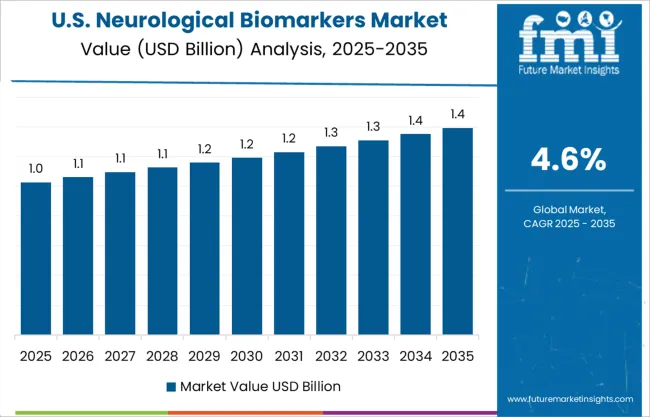
Future Market Insights expects the neurological biomarkers market to expand at a CAGR of 4.6% over the forecast period owing to the manufacturer’s activities to develop the field of biomarkers.
What is the impact of COVID-19 on this industry?
According to an article “Biomarkers of COVID-19 and technologies to combat SARS-CoV-2” published in the U.S. National Library of Medicine, in August 2020, researchers are investigating the role of emerging biomarkers in the early detection of SARS-CoV-2.
The results of this investigation may help the biomarkers market to develop in the post-pandemic era. Like other industries across the world, the neurological biomarkers industry was also negatively impacted during the peak of the COVID-19 pandemic. The disruption in manufacturing processes and supply-chain operations led to a stagnation of this industry.
All the key players of the industry shifted their focus on the efforts to balance their overall losses due to the worldwide lockdown during the year 2020 which led to less focus on the research and development activities of their field. Furthermore, the implementation of biomarkers for early detection of COVID-19 has resulted in many companies focusing on the research and development of biomarkers, which will positively impact the market in the post pandemic era.
Find your sweet spots for generating winning opportunities in this market.
Talk to AnalystWhat arethe key opportunities for manufacturers of neurological biomarkers industry?
Neurology disorders are affecting major percent of the global population and it is considered a major cause of disability around the globe. The prevalence of neurological disorders is growing at a very high pace, in which biomarkers are expected to play a vital role in better understanding of the disease and development of personalized medicine specific to the patient.
Increasing prevalence of neurodegenerative disorders is expected to fuel the research activities in field of neurology. Along with this, changing government policies to reduce the economic burden of the biomarkers is expected to boost the growth of the market in the coming future. In terms of business opportunities, the U.S., Europe and Asia-Pacific are lucrative markets for the manufacturers of neurology biomarkers due to high R&D expenditure.
What are the restraining factors for this market?
The advent of technologies has led to comprehensive analysis of proteins, genes, transcripts and others, which leads to understanding of molecular markers of disease progression. However, the basic understanding of molecular signature of biological process from these datasets is also complicated. In majority of the cases, there is a complete lack of control group of specimens and statistically low size of diseased specimens for biomarker development studies.
Heterogeneity of diseases means the same disease phenotype is produced with multiple interrelated processes which leads to increased difficulties in the discovery of biomarkers, especially in neurodegenerative diseases. Thus, this proves to be a restraining factor for the development of this industry.

An unified Market Research Subscription Platform, built for today’s disparate research needs.
Country-wise Insights
Will the U.S. remain a key market for neurological biomarkers?
The U.S. is expected to hold 85.4% of the total neurological biomarkers market in North America in the year 2021. It is expected to grow at a similar trend over the forecast period owing to the well-developed healthcare infrastructure helping the key players conduct their research and development activities at a much larger scale, high disease burden, and acceptance of biomarkers for diagnostic. Since the U.S. FDA provides continuous guidelines for all the R&D activities, it creates a lucrative environment for the key players in the country.
Why Germany is considered a more lucrative neurological biomarkers market within Europe?
In the year 2021, Germany is anticipated to contribute more than 17% to the neurological biomarkers market in Europe. Rising prevalence of neurodegenerative diseases in the country provides a large market for the development of neurological markers. Governmental initiatives to improve the neurological disease diagnosis and prognosis also positively impacts this market in U.K.
What are the factors supporting neurological biomarkers sales in Japan?
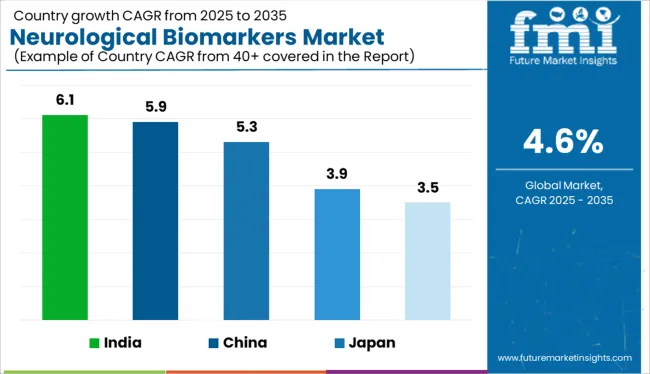
Japan is expected to hold 23.9% of the total neurological biomarkers market in the Asia Pacific region. Japan is of the emerging markets for the development of biomarkers due to the increasing healthcare expenditure by the government and growing R&D activities in the country. The market is projected to expand at a 5.9% CAGR over the forecast period.
Category-wise Insights
What is the neurological biomarkers market value?
The global neurological biomarkers market is will record sales worth U.S. $ 7.20 Bn by the end of 2021 and is projected to reach U.S. $ 9.91 Bn by the end of 2028 with a cumulative CAGR of 4.6%.
Why is the demand for genomic biomarkers increasing?
The genomic biomarkers are used for the development of personalised medicines for neurological diseases which makes them more popular than the other markers. The sales of genomic biomarkers is expected to be valued at U.S. $ 2.37 Bn in 2021 and will continue to positively impact the overall market growth with a CAGR of 3.6%. The segment is dominant in the global neurological biomarkers market due to increasing research and development activities.
Which disease is most commonly diagnosed through the use of neurological biomarkers?
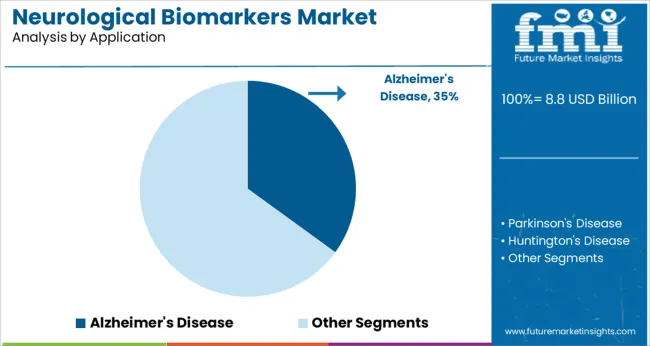
In terms of revenues by Application, Alzheimer's disease segment is expected to account for the largest revenue share of 24.8% in 2021 expanding at an attractive CAGR of 4.0% over the forecast period. It is the most prevalent condition among the other neurological conditions and it is most opportunistic space for manufacturers.
Which end-user contributes to highest market share in the neurological biomarkers market?
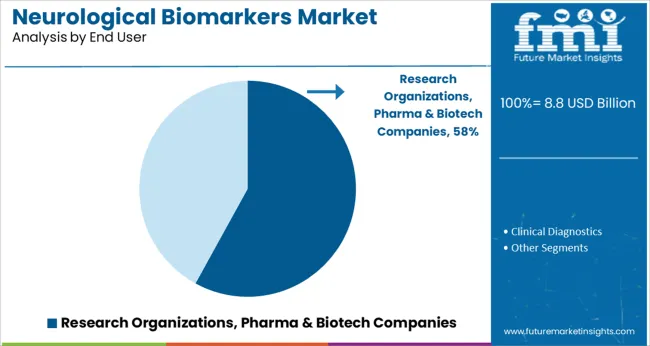
With the increasing adoption of biomarkers drug discovery & development the research organizations, pharma & biotech companies will hold 84.5% of the total market share in the year 2021. Additionally, various R&D activities in the field of biomarkers by these organizations are contributing to this high share.
Competitive Landscape
The key players of neurological biomarkers market are adopting strategies like product launches, partnership agreement to strengthen their market foothold and expand around the world.
In April 2018, QIAGEN N.V. announced the launch of their latest next generation platform for the molecular analysis of commonly occurring syndromic infections and other disorders, called “QIAstat-Dx” in Europe.
In November2021, ADx NeuroSciences N.V. in collaboration with Fujirebio Europe announced product launch of two Cerebrospinal fluid based immunoassays for the diagnosis of Alzheimer’s disease.
The increasing applications of biomarkers in drug discovery and development, disease diagnosis, improving the efficiency of the medicine are some key factors which will provide lucrative opportunities in this industry.
Scope of the Report
Attribute |
Details |
Forecast Period |
2022-2028 |
Historical Data Available for |
2012-2021 |
Market Analysis |
USD Million for Value. |
Key Countries Covered |
US, Canada, Germany, U.K., France, Italy, Spain, Russia, China, Japan, South Korea, India, Thailand, Malaysia, Indonesia, Australia, New Zealand, GCC Countries, Turkey, South Africa |
Key Segments Covered |
Type, Application, End-User and Region. |
Key Companies Profiled |
|
Report Coverage |
Market Forecast, Competition Intelligence, DROT Analysis, Market Dynamics and Challenges, Strategic Growth Initiatives |
Customization & Pricing |
Available upon Request |
Neurological Biomarkers Market by Category
Type
- Genomics Biomarker
- Proteomics Biomarkers
- Metabolomics Biomarkers
- Imaging Biomarkers
- Others
Application
- Alzheimer's Disease
- Parkinson's Disease
- Huntington's Disease
- Schizophrenia
- Depression
- Multiple Sclerosis
- Spinal Muscular Atrophy
End User
- Research Organizations, Pharma & Biotech Companies
- Clinical Diagnostics
Region
- North America
- Latin America
- Europe
- Asia Pacific
- Middle East & Africa
Frequently Asked Questions
North America is expected to hold 40.0% of the global neurological biomarkers market by the end of 2021 and will expand at a CAGR of 3.9% over the forecast period. North America provides many lucrative opportunities since the healthcare infrastructure and research and development infrastructure in that region is very well developed.
The neurological biomarkers market in India is likely to grow at a CAGR of 7.0% during the forecast period, with a market share of around 12.0% in 2021 of the APEJ market. The major factors that are fuelling the growth of this market in India are the constantly developing healthcare infrastructure and increasing expenditure on R&D activities and healthcare by the manufacturers and governmental authorities.
Increasing research activities in the field of biomarkers and their application in diagnosing neurodegenerative disorders, application of biomarkers in personalised medicines, and governmental initiatives to combat neurological diseases are some of the major factors driving the demand for this market globally.
The neurological biomarkers market in Japan will record sales worth U.S. $ 342.2 Mn by the end of 2021 and is expected to expand at a CAGR of 5.9% over the forecast period.
U.S., Canada, U.K., Germany and Japan are the top 5 countries that are driving the demand for neurological biomarkers.
Leading companies of Neurological biomarkers are Quanterix, Qiagen, ADx NeuroSciences NV, Merck KGaA, Enrolmmun, Thermo Fisher Scientific, ACOBIOM, Banyan Biomarkers, Inc., Olink Biosciences, and Bio-Rad Laboratories Inc.
1. Executive Summary A gist of the report, highlighting the key takeaways
1.1. Market Overview
1.2. Market Analysis
1.3. PMR Analysis and Recommendations
1.4. Wheel of Fortune
2. Market Introduction A definition of Neurological Biomarkers and related market taxonomy
2.1. Market Definition
2.2. Market Taxonomy
2.3. Neurological Biomarkers Market Overview
2.4. Company and Chief Analyst Credentials
3. Market View PointTracking the market scenario, with key inferences drawn from historical data, current trends, and future prospects
3.1. Macro-Economic Factors
3.2. Opportunity Analysis
4. Market Background
4.1. Technology Evolution and List of Neurological Biomarkers
4.2. List of Growth Hacking Manufacturers
5. Industry Structure
5.1. Marketing and Distribution Strategies
5.2. Market Size by Tiers
6. Macroeconomic Assumptions
7. Global Economic Outlook
7.1. Gross Domestic Product by Region & Country, 2006 – 2021
7.2. Disease Outlook
8. North America Neurological Biomarkers Market Analysis 2012-2021 and Forecast 2022-2028 Market forecast and analysis in the U.S. and Canada
8.1. Introduction
8.2. Key Regulations
8.3. Regional Market Dynamics
8.3.1. Drivers
8.3.2. Restraints
8.3.3. Trends
8.4. Historical Market Size (US$ Mn) Analysis By Country, 2012-2021
8.4.1. U.S.
8.4.2. Canada
8.5. Market Size (US$ Mn) Forecast By Country, 2022-2028
8.5.1. U.S.
8.5.2. Canada
8.6. Historical Market Size (US$ Mn) Analysis By Type, 2012-2021
8.6.1. Genomics Biomarker
8.6.2. Proteomic Biomarker
8.6.3. Metabolomics Biomarker
8.6.4. Imaging biomarkers
8.6.5. Others
8.7. Market Size (US$ Mn) Forecast By Type, 2022-2028
8.7.1. Genomics Biomarker
8.7.2. Proteomic Biomarker
8.7.3. Metabolomics Biomarker
8.7.4. Imaging biomarkers
8.7.5. Others
8.8. Historical Market Size (US$ Mn) Analysis By Application, 2012-2021
8.8.1. Alzheimer’s disease
8.8.2. Parkinson’s disease
8.8.3. Huntington’s disease
8.8.4. Schizophrenia
8.8.5. Depression
8.8.6. Multiple Sclerosis
8.8.7. Spinal Muscular Atrophy (SMA)
8.9. Market Size (US$ Mn) Forecast By Application, 2022-2028
8.9.1. Alzheimer’s disease
8.9.2. Parkinson’s disease
8.9.3. Huntington’s disease
8.9.4. Schizophrenia
8.9.5. Depression
8.9.6. Multiple Sclerosis
8.9.7. Spinal Muscular Atrophy (SMA)
8.10. Historical Market Size (US$ Mn) Analysis By End User, 2012-2021
8.10.1. Research Institutes and Diagnostic Centers
8.10.2. Hospitals
8.11. Market Size (US$ Mn) Forecast By End User, 2022-2028
8.11.1. Research Institutes and Diagnostic Centers
8.11.2. Hospitals
8.12. Market Attractiveness Analysis
8.12.1. By Country
8.12.2. By Type
8.12.3. By Application
8.12.4. By End User
8.13. Key Representative Market Participants
8.14. Key Participants Market Presence (Intensity Map)
9. Latin America Neurological Biomarkers Market Analysis 2012-2021 and Forecast 2022-2028 Market forecast and analysis in Brazil, Mexico, Argentina and Rest of Latin America
9.1. Introduction
9.2. Key Regulations
9.3. Regional Market Dynamics
9.3.1. Drivers
9.3.2. Restraints
9.3.3. Trends
9.4. Historical Market Size (US$ Mn) Analysis By Country, 2012-2021
9.4.1. Brazil
9.4.2. Mexico
9.4.3. Argentina
9.4.4. Rest of Latin America
9.5. Market Size (US$ Mn) Forecast By Country, 2022-2028
9.5.1. Brazil
9.5.2. Mexico
9.5.3. Argentina
9.5.4. Rest of Latin America
9.6. Historical Market Size (US$ Mn) Analysis By Type, 2012-2021
9.6.1. Genomics Biomarker
9.6.2. Proteomic Biomarker
9.6.3. Metabolomics Biomarker
9.6.4. Imaging biomarkers
9.6.5. Others
9.7. Market Size (US$ Mn) Forecast By Type, 2022-2028
9.7.1. Genomics Biomarker
9.7.2. Proteomic Biomarker
9.7.3. Metabolomics Biomarker
9.7.4. Imaging biomarkers
9.7.5. Others
9.8. Historical Market Size (US$ Mn) Analysis By Application, 2012-2021
9.8.1. Alzheimer’s disease
9.8.2. Parkinson’s disease
9.8.3. Huntington’s disease
9.8.4. Schizophrenia
9.8.5. Depression
9.8.6. Multiple Sclerosis
9.8.7. Spinal Muscular Atrophy (SMA)
9.9. Market Size (US$ Mn) Forecast By Application, 2022-2028
9.9.1. Alzheimer’s disease
9.9.2. Parkinson’s disease
9.9.3. Huntington’s disease
9.9.4. Schizophrenia
9.9.5. Depression
9.9.6. Multiple Sclerosis
9.9.7. Spinal Muscular Atrophy (SMA)
9.10. Historical Market Size (US$ Mn) Analysis By End User, 2012-2021
9.10.1. Research Institutes and Diagnostic Centers
9.10.2. Hospitals
9.11. Market Size (US$ Mn) Forecast By End User, 2022-2028
9.11.1. Research Institutes and Diagnostic Centers
9.11.2. Hospitals
9.12. Market Attractiveness Analysis
9.12.1. By Country
9.12.2. By Type
9.12.3. By Application
9.12.4. By End User
9.13. Key Representative Market Participants
9.14. Key Participants Market Presence (Intensity Map)
10. Europe Neurological Biomarkers Market Analysis 2012-2021 and Forecast 2022-2028 Market forecast and analysis in Germany, France, Italy, Spain, U.K., Russia, and rest of Europe
10.1. Introduction
10.2. Key Regulations
10.3. Regional Market Dynamics
10.3.1. Drivers
10.3.2. Restraints
10.3.3. Trends
10.4. Historical Market Size (US$ Mn) Analysis By Country, 2012-2021
10.4.1. Germany
10.4.2. France
10.4.3. U.K.
10.4.4. Spain
10.4.5. Italy
10.4.6. Russia
10.4.7. Rest of Europe
10.5. Market Size (US$ Mn) Forecast By Country, 2022-2028
10.5.1. Germany
10.5.2. France
10.5.3. U.K.
10.5.4. Spain
10.5.5. Italy
10.5.6. Russia
10.5.7. Rest of Europe
10.6. Historical Market Size (US$ Mn) Analysis By Type, 2012-2021
10.6.1. Genomics Biomarker
10.6.2. Proteomic Biomarker
10.6.3. Metabolomics Biomarker
10.6.4. Imaging biomarkers
10.6.5. Others
10.7. Market Size (US$ Mn) Forecast By Type, 2022-2028
10.7.1. Genomics Biomarker
10.7.2. Proteomic Biomarker
10.7.3. Metabolomics Biomarker
10.7.4. Imaging biomarkers
10.7.5. Others
10.8. Historical Market Size (US$ Mn) Analysis By Application, 2012-2021
10.8.1. Alzheimer’s disease
10.8.2. Parkinson’s disease
10.8.3. Huntington’s disease
10.8.4. Schizophrenia
10.8.5. Depression
10.8.6. Multiple Sclerosis
10.8.7. Spinal Muscular Atrophy (SMA)
10.9. Market Size (US$ Mn) Forecast By Application, 2022-2028
10.9.1. Alzheimer’s disease
10.9.2. Parkinson’s disease
10.9.3. Huntington’s disease
10.9.4. Schizophrenia
10.9.5. Depression
10.9.6. Multiple Sclerosis
10.9.7. Spinal Muscular Atrophy (SMA)
10.10. Historical Market Size (US$ Mn) Analysis By End User, 2012-2021
10.10.1. Research Institutes and Diagnostic Centers
10.10.2. Hospitals
10.11. Market Size (US$ Mn) Forecast By End User, 2022-2028
10.11.1. Research Institutes and Diagnostic Centers
10.11.2. Hospitals
10.12. Market Attractiveness Analysis
10.12.1. By Country
10.12.2. By Type
10.12.3. By Application
10.12.4. By End User
10.13. Key Representative Market Participants
10.14. Key Participants Market Presence (Intensity Map)
11. Asia Pacific Neurological Biomarkers Market Analysis 2012-2021 and Forecast 2022-2028 Market forecast and analysis in China, India, Japan, ASEAN, Australia & New Zealand, and Rest of Asia Pacific
11.1. Introduction
11.2. Key Regulations
11.3. Regional Market Dynamics
11.3.1. Drivers
11.3.2. Restraints
11.3.3. Trends
11.4. Historical Market Size (US$ Mn) Analysis By Country, 2012-2021
11.4.1. China
11.4.2. India
11.4.3. Japan
11.4.4. Australia and New Zealand
11.4.5. ASEAN
11.4.6. Rest of Asia Pacific
11.5. Market Size (US$ Mn) Forecast By Country, 2022-2028
11.5.1. China
11.5.2. India
11.5.3. Japan
11.5.4. Australia and New Zealand
11.5.5. ASEAN
11.5.6. Rest of Asia Pacific
11.6. Historical Market Size (US$ Mn) Analysis By Type, 2012-2021
11.6.1. Genomics Biomarker
11.6.2. Proteomic Biomarker
11.6.3. Metabolomics Biomarker
11.6.4. Imaging biomarkers
11.6.5. Others
11.7. Market Size (US$ Mn) Forecast By Type, 2022-2028
11.7.1. Genomics Biomarker
11.7.2. Proteomic Biomarker
11.7.3. Metabolomics Biomarker
11.7.4. Imaging biomarkers
11.7.5. Others
11.8. Historical Market Size (US$ Mn) Analysis By Application, 2012-2021
11.8.1. Alzheimer’s disease
11.8.2. Parkinson’s disease
11.8.3. Huntington’s disease
11.8.4. Schizophrenia
11.8.5. Depression
11.8.6. Multiple Sclerosis
11.8.7. Spinal Muscular Atrophy (SMA)
11.9. Market Size (US$ Mn) Forecast By Application, 2022-2028
11.9.1. Alzheimer’s disease
11.9.2. Parkinson’s disease
11.9.3. Huntington’s disease
11.9.4. Schizophrenia
11.9.5. Depression
11.9.6. Multiple Sclerosis
11.9.7. Spinal Muscular Atrophy (SMA)
11.10. Historical Market Size (US$ Mn) Analysis By End User, 2012-2021
11.10.1. Research Institutes and Diagnostic Centers
11.10.2. Hospitals
11.11. Market Size (US$ Mn) Forecast By End User, 2022-2028
11.11.1. Research Institutes and Diagnostic Centers
11.11.2. Hospitals
11.12. Market Attractiveness Analysis
11.12.1. By Country
11.12.2. By Type
11.12.3. By Application
11.12.4. By End User
11.13. Key Representative Market Participants
11.14. Key Participants Market Presence (Intensity Map)
12. MEA Neurological Biomarkers Market Analysis 2012-2021 and Forecast 2022-2028 Market forecast and analysis in GCC, South Africa, and Rest of MEA
12.1. Introduction
12.2. Key Regulations
12.3. Regional Market Dynamics
12.3.1. Drivers
12.3.2. Restraints
12.3.3. Trends
12.4. Historical Market Size (US$ Mn) Analysis By Country, 2012-2021
12.4.1. GCC Countries
12.4.2. South Africa
12.4.3. Rest of MEA
12.5. Market Size (US$ Mn) Forecast By Country, 2022-2028
12.5.1. GCC Countries
12.5.2. South Africa
12.5.3. Rest of MEA
12.6. Historical Market Size (US$ Mn) Analysis By Type, 2012-2021
12.6.1. Genomics Biomarker
12.6.2. Proteomic Biomarker
12.6.3. Metabolomics Biomarker
12.6.4. Imaging biomarkers
12.6.5. Others
12.7. Market Size (US$ Mn) Forecast By Type, 2022-2028
12.7.1. Genomics Biomarker
12.7.2. Proteomic Biomarker
12.7.3. Metabolomics Biomarker
12.7.4. Imaging biomarkers
12.7.5. Others
12.8. Historical Market Size (US$ Mn) Analysis By Application, 2012-2021
12.8.1. Alzheimer’s disease
12.8.2. Parkinson’s disease
12.8.3. Huntington’s disease
12.8.4. Schizophrenia
12.8.5. Depression
12.8.6. Multiple Sclerosis
12.8.7. Spinal Muscular Atrophy (SMA)
12.9. Market Size (US$ Mn) Forecast By Application, 2022-2028
12.9.1. Alzheimer’s disease
12.9.2. Parkinson’s disease
12.9.3. Huntington’s disease
12.9.4. Schizophrenia
12.9.5. Depression
12.9.6. Multiple Sclerosis
12.9.7. Spinal Muscular Atrophy (SMA)
12.10. Historical Market Size (US$ Mn) Analysis By End User, 2012-2021
12.10.1. Research Institutes and Diagnostic Centers
12.10.2. Hospitals
12.11. Market Size (US$ Mn) Forecast By End User, 2022-2028
12.11.1. Research Institutes and Diagnostic Centers
12.11.2. Hospitals
12.12. Market Attractiveness Analysis
12.12.1. By Country
12.12.2. By Type
12.12.3. By Application
12.12.4. By End User
12.13. Key Representative Market Participants
12.14. Key Participants Market Presence (Intensity Map)
13. Forecast Factors: Relevance and Impact
14. Forecast Assumptions A glossary of assumption and acronyms used in the report
15. Competition Landscape Profile of some of the key market players, with specific focus on business and strategy
15.1. Competition Intensity Mapping By Market Taxonomy
15.2. Competition Dashboard
15.3. Company Profiles (Details – Overview, Financials, Strategy, Recent Developments)
15.3.1. Quanterix
15.3.2. QIAGEN
15.3.3. ADx NeuroSciences NV
15.3.4. Merck KGaA
15.3.5. Euroimmun AG
15.3.6. Thermo Fisher Scientific
15.3.7. ACOBIOM
15.3.8. Banyan Biomarkers, Inc.
15.3.9. Olink Biosciences
15.3.10. BioAgilytix
16. Global Neurological Biomarkers Market Analysis 2012-2021 and Forecast 2022-2028, By Region A detailed, region-wise assessment, providing projections on market growth in key regions
16.1. Introduction / Key Findings
16.2. Historical Market Size (US$ Mn) Analysis By Region, 2012-2021
16.2.1. North America
16.2.2. Latin America
16.2.3. Europe
16.2.4. Asia Pacific
16.2.5. MEA
16.3. Market Size (US$ Mn) Forecast By Region, 2022-2028
16.3.1. North America
16.3.2. Latin America
16.3.3. Europe
16.3.4. Asia Pacific
16.3.5. MEA
16.4. Market Attractiveness Analysis By Region
17. Global Neurological Biomarkers Market Analysis 2012-2021 and Forecast 2022-2028, By Type Classification of neurological biomarkers into Types; highlighting historical trends, current market value, and future projections on the basis of key segments
17.1. Introduction
17.2. Historical Market Size (US$ Mn) Analysis By Type, 2012-2021
17.2.1. Genomics Biomarker
17.2.2. Proteomic Biomarker
17.2.3. Metabolomics Biomarker
17.2.4. Imaging biomarkers
17.2.5. Others
17.3. Market Size (US$ Mn) Forecast By Type, 2022-2028
17.3.1. Genomics Biomarker
17.3.2. Proteomic Biomarker
17.3.3. Metabolomics Biomarker
17.3.4. Imaging biomarkers
17.3.5. Others
17.4. Key Trends / Developments
17.5. Market Attractiveness Analysis By Type
18. Global Neurological Biomarkers Market Analysis 2012-2021 and Forecast 2022-2028, By Application Classification based on application; highlighting historical trends, current market value, and future projections on the basis of key segments
18.1. Introduction
18.2. Historical Market Size (US$ Mn) Analysis By Application, 2012-2021
18.2.1. Alzheimer’s disease
18.2.2. Parkinson’s disease
18.2.3. Huntington’s disease
18.2.4. Schizophrenia
18.2.5. Depression
18.2.6. Multiple Sclerosis
18.2.7. Spinal Muscular Atrophy (SMA)
18.3. Market Size (US$ Mn) Forecast By Application, 2022-2028
18.3.1. Alzheimer’s disease
18.3.2. Parkinson’s disease
18.3.3. Huntington’s disease
18.3.4. Schizophrenia
18.3.5. Depression
18.3.6. Multiple Sclerosis
18.3.7. Spinal Muscular Atrophy (SMA)
18.4. Key Trends / Developments
18.5. Market Attractiveness Analysis By Application
19. Global Neurological Biomarkers Market Analysis 2012-2021 and Forecast 2022-2028, By End User Assessment of End Users for neurological biomarkers; highlighting historical trends, current market value, and future projections on the basis of key segments
19.1. Introduction
19.2. Historical Market Size (US$ Mn) Analysis By End User, 2012-2021
19.2.1. Research Institutes and Diagnostic Centers
19.2.2. Hospitals
19.3. Market Size (US$ Mn) Forecast By End User, 2022-2028
19.3.1. Research Institutes and Diagnostic Centers
19.3.2. Hospitals
19.4. Key Trends / Developments
19.5. Market Attractiveness Analysis By End User
20. Global Neurological Biomarkers Market Analysis 2012-2021 and Forecast 2022-2028 Tracking the market scenario, with key inferences drawn from historical data, current trends, and future prospects
20.1. Market Size and Y-o-Y Growth
20.2. Absolute $ Opportunity
21. Research Methodology
Let us know your requirement to get
100% FREE customization
Table 01: North America Neurological Biomarkers Market Size Analysis (US$ Mn) Analysis 2012-2021 and Forecast 2022-2028, By Country
Table 02: North America Neurological Biomarkers Market Size Analysis (US$ Mn) Analysis 2012-2021 and Forecast 2022-2028, By Type
Table 03: North America Neurological Biomarkers Market Size Analysis (US$ Mn) Analysis 2012-2021 and Forecast 2022-2028, By Application
Table 04: North America Neurological Biomarkers Market Size Analysis (US$ Mn) Analysis 2012-2021 and Forecast 2022-2028, By End User
Table 05: Latin America Neurological Biomarkers Market Size Analysis (US$ Mn) Analysis 2012-2021 and Forecast 2022-2028, By Country
Table 06: Latin America Neurological Biomarkers Market Size Analysis (US$ Mn) Analysis 2012-2021 and Forecast 2022-2028, By Type
Table 07: Latin America Neurological Biomarkers Market Size Analysis (US$ Mn) Analysis 2012-2021 and Forecast 2022-2028, By Application
Table 08: Latin America Neurological Biomarkers Market Size Analysis (US$ Mn) Analysis 2012-2021 and Forecast 2022-2028, By End User
Table 09: Europe Neurological Biomarkers Market Size Analysis (US$ Mn) Analysis 2012-2021 and Forecast 2022-2028, By Country
Table 10: Europe Neurological Biomarkers Market Size Analysis (US$ Mn) Analysis 2012-2021 and Forecast 2022-2028, By Type
Table 11: Europe Neurological Biomarkers Market Size Analysis (US$ Mn) Analysis 2012-2021 and Forecast 2022-2028, By Application
Table 12: Europe Neurological Biomarkers Market Size Analysis (US$ Mn) Analysis 2012-2021 and Forecast 2022-2028, By End User
Table 13: Asia Pacific Neurological Biomarkers Market Size Analysis (US$ Mn) Analysis 2012-2021 and Forecast 2022-2028, By Country
Table 14: Asia Pacific Neurological Biomarkers Market Size Analysis (US$ Mn) Analysis 2012-2021 and Forecast 2022-2028, By Type
Table 15: Asia Pacific Neurological Biomarkers Market Size Analysis (US$ Mn) Analysis 2012-2021 and Forecast 2022-2028, By Application
Table 16: Asia Pacific Neurological Biomarkers Market Size Analysis (US$ Mn) Analysis 2012-2021 and Forecast 2022-2028, By End User
Table 17: Middle East & Africa Neurological Biomarkers Market Size Analysis (US$ Mn) Analysis 2012-2021 and Forecast 2022-2028, By Country
Table 18: Middle East & Africa Neurological Biomarkers Market Size Analysis (US$ Mn) Analysis 2012-2021 and Forecast 2022-2028, By Type
Table 19: Middle East & Africa Neurological Biomarkers Market Size Analysis (US$ Mn) Analysis 2012-2021 and Forecast 2022-2028, By Application
Table 20: Middle East & Africa Neurological Biomarkers Market Size Analysis (US$ Mn) Analysis 2012-2021 and Forecast 2022-2028, By End User
Table 21: Global Neurological Biomarkers Market Size (US$ Mn) 2012-2021 and Forecast 2022-2028 by Region,
Table 22: Global Neurological Biomarkers Market Size Analysis (US$ Mn) Analysis 2012-2021 and Forecast 2022-2028, By Type
Table 23: Global Neurological Biomarkers Market Size Analysis (US$ Mn) Analysis 2012-2021 and Forecast 2022-2028, By Application
Table 24: Global Neurological Biomarkers Market Size Analysis (US$ Mn) Analysis 2012-2021 and Forecast 2022-2028, By End User
Find your sweet spots for generating winning opportunities in this market.
Talk to AnalystFigure 01: Global Neurological Biomarkers Market Split By Type (2021)
Figure 02: Global Neurological Biomarkers Market Split By Application (2021)
Figure 03: Global Neurological Biomarkers Market Split By End User (2021)
Figure 04: Global Neurological Biomarkers Market Split By Region (2021)
Figure 05: North America Neurological Biomarkers Market Value Share (%) By Type (2021)
Figure 06: North America Neurological Biomarkers Market Value Share (%) By Application (2021)
Figure 07: North America Neurological Biomarkers Market Value Share (%) By End User (2021)
Figure 08: North America Neurological Biomarkers Market Value Share (%) By Country (2021)
Figure 09: North America Neurological Biomarkers Market Value (US$ Mn) & Forecast 2021 & 2028
Figure 10: North America Neurological Biomarkers Market Size Analysis, 2012-2021
Figure 11: North America Neurological Biomarkers Market Size (US$ Mn) & Y-o-Y Growth (%), 2022-2028
Figure 12: North America Neurological Biomarkers Market Size Analysis, 2012-2021, By Genomics Biomarker
Figure 13: North America Neurological Biomarkers Market Size (US$ Mn) & Y-o-Y Growth (%), 2022-2028, By Genomics Biomarker
Figure 14: North America Neurological Biomarkers Market Size Analysis, 2012-2021, By Proteomics Biomarkers
Figure 15: North America Neurological Biomarkers Market Size (US$ Mn) & Y-o-Y Growth (%), 2022-2028, By Proteomics Biomarkers
Figure 16: North America Neurological Biomarkers Market Size Analysis, 2012-2021, By Metabolomics Biomarkers
Figure 17: North America Neurological Biomarkers Market Size (US$ Mn) & Y-o-Y Growth (%), 2022-2028, By Metabolomics Biomarkers
Figure 18: North America Neurological Biomarkers Market Size Analysis, 2012-2021, By Imaging Biomarkers
Figure 19: North America Neurological Biomarkers Market Size (US$ Mn) & Y-o-Y Growth (%), 2022-2028, By Imaging Biomarkers
Figure 20: North America Neurological Biomarkers Market Size Analysis, 2012-2021, By Others
Figure 21: North America Neurological Biomarkers Market Size (US$ Mn) & Y-o-Y Growth (%), 2022-2028, By Others
Figure 22: North America Neurological Biomarkers Market Size Analysis, 2012-2021, By Alzheimer's disease
Figure 23: North America Neurological Biomarkers Market Size (US$ Mn) & Y-o-Y Growth (%), 2022-2028, By Alzheimer's disease
Figure 24: North America Neurological Biomarkers Market Size Analysis, 2012-2021, By Parkinson's disease
Figure 25: North America Neurological Biomarkers Market Size (US$ Mn) & Y-o-Y Growth (%), 2022-2028, By Parkinson's disease
Figure 26: North America Neurological Biomarkers Market Size Analysis, 2012-2021, By Foot & Huntington's Disease
Figure 27: North America Neurological Biomarkers Market Size (US$ Mn) & Y-o-Y Growth (%), 2022-2028, By Foot & Huntington's Disease
Figure 28: North America Neurological Biomarkers Market Size Analysis, 2012-2021, By Schizophrenia
Figure 29: North America Neurological Biomarkers Market Size (US$ Mn) & Y-o-Y Growth (%), 2022-2028, By Schizophrenia
Figure 30: North America Neurological Biomarkers Market Size Analysis, 2012-2021, By Foot & Depression
Figure 31: North America Neurological Biomarkers Market Size (US$ Mn) & Y-o-Y Growth (%), 2022-2028, By Depression
Figure 32: North America Neurological Biomarkers Market Size Analysis, 2012-2021, By Multiple Sclerosis
Figure 33: North America Neurological Biomarkers Market Size (US$ Mn) & Y-o-Y Growth (%), 2022-2028, By Multiple Sclerosis
Figure 34: North America Neurological Biomarkers Market Size Analysis, 2012-2021, By Spinal Muscular Atrophy
Figure 35: North America Neurological Biomarkers Market Size (US$ Mn) & Y-o-Y Growth (%), 2022-2028, By Spinal Muscular Atrophy
Figure 36: North America Neurological Biomarkers Market Attractiveness Analysis, By Country
Figure 37: North America Neurological Biomarkers Market Attractiveness Analysis, By Type
Figure 38: North America Neurological Biomarkers Market Attractiveness Analysis, By Application
Figure 39: North America Neurological Biomarkers Market Attractiveness Analysis, By End User
Figure 40: Latin America Neurological Biomarkers Market Value Share (%) By Type (2021)
Figure 41: Latin America Neurological Biomarkers Market Value Share (%) By Application (2021)
Figure 42: Latin America Neurological Biomarkers Market Value Share (%) By End User (2021)
Figure 43: Latin America Neurological Biomarkers Market Value Share (%) By Country (2021)
Figure 44: Latin America Neurological Biomarkers Market Value (US$ Mn) & Forecast 2021 & 2028
Figure 45: Latin America Neurological Biomarkers Market Size Analysis, 2012-2021
Figure 46: Latin America Neurological Biomarkers Market Size (US$ Mn) & Y-o-Y Growth (%), 2022-2028
Figure 47: Latin America Neurological Biomarkers Market Size Analysis, 2012-2021, By Genomics Biomarker
Figure 48: Latin America Neurological Biomarkers Market Size (US$ Mn) & Y-o-Y Growth (%), 2022-2028, By Genomics Biomarker
Figure 49: Latin America Neurological Biomarkers Market Size Analysis, 2012-2021, By Proteomics Biomarkers
Figure 50: Latin America Neurological Biomarkers Market Size (US$ Mn) & Y-o-Y Growth (%), 2022-2028, By Proteomics Biomarkers
Figure 51: Latin America Neurological Biomarkers Market Size Analysis, 2012-2021, By Metabolomics Biomarkers
Figure 52: Latin America Neurological Biomarkers Market Size (US$ Mn) & Y-o-Y Growth (%), 2022-2028, By Metabolomics Biomarkers
Figure 53: Latin America Neurological Biomarkers Market Size Analysis, 2012-2021, By Imaging Biomarkers
Figure 54: Latin America Neurological Biomarkers Market Size (US$ Mn) & Y-o-Y Growth (%), 2022-2028, By Imaging Biomarkers
Figure 55: Latin America Neurological Biomarkers Market Size Analysis, 2012-2021, By Others
Figure 56: Latin America Neurological Biomarkers Market Size (US$ Mn) & Y-o-Y Growth (%), 2022-2028, By Others
Figure 57: Latin America Neurological Biomarkers Market Size Analysis, 2012-2021, By Alzheimer's disease
Figure 58: Latin America Neurological Biomarkers Market Size (US$ Mn) & Y-o-Y Growth (%), 2022-2028, By Alzheimer's disease
Figure 59: Latin America Neurological Biomarkers Market Size Analysis, 2012-2021, By Parkinson's disease
Figure 60: Latin America Neurological Biomarkers Market Size (US$ Mn) & Y-o-Y Growth (%), 2022-2028, By Parkinson's disease
Figure 61: Latin America Neurological Biomarkers Market Size Analysis, 2012-2021, By Foot & Huntington's Disease
Figure 62: Latin America Neurological Biomarkers Market Size (US$ Mn) & Y-o-Y Growth (%), 2022-2028, By Foot & Huntington's Disease
Figure 63: Latin America Neurological Biomarkers Market Size Analysis, 2012-2021, By Schizophrenia
Figure 64: Latin America Neurological Biomarkers Market Size (US$ Mn) & Y-o-Y Growth (%), 2022-2028, By Schizophrenia
Figure 65: Latin America Neurological Biomarkers Market Size Analysis, 2012-2021, By Foot & Depression
Figure 66: Latin America Neurological Biomarkers Market Size (US$ Mn) & Y-o-Y Growth (%), 2022-2028, By Depression
Figure 67: Latin America Neurological Biomarkers Market Size Analysis, 2012-2021, By Multiple Sclerosis
Figure 68: Latin America Neurological Biomarkers Market Size (US$ Mn) & Y-o-Y Growth (%), 2022-2028, By Multiple Sclerosis
Figure 69: Latin America Neurological Biomarkers Market Size Analysis, 2012-2021, By Spinal Muscular Atrophy
Figure 70: Latin America Neurological Biomarkers Market Size (US$ Mn) & Y-o-Y Growth (%), 2022-2028, By Spinal Muscular Atrophy
Figure 71: Latin America Neurological Biomarkers Market Attractiveness Analysis, By Country
Figure 72: Latin America Neurological Biomarkers Market Attractiveness Analysis, By Type
Figure 73: Latin America Neurological Biomarkers Market Attractiveness Analysis, By Application
Figure 74: Latin America Neurological Biomarkers Market Attractiveness Analysis, By End User
Figure 75: Europe Neurological Biomarkers Market Value Share (%) By Type (2021)
Figure 76: Europe Neurological Biomarkers Market Value Share (%) By Application (2021)
Figure 77: Europe Neurological Biomarkers Market Value Share (%) By End User (2021)
Figure 78: Europe Neurological Biomarkers Market Value Share (%) By Country (2021)
Figure 79: Europe Neurological Biomarkers Market Value (US$ Mn) & Forecast 2021 & 2028
Figure 80: Europe Neurological Biomarkers Market Size Analysis, 2012-2021
Figure 81: Europe Neurological Biomarkers Market Size (US$ Mn) & Y-o-Y Growth (%), 2022-2028
Figure 82: Europe Neurological Biomarkers Market Size Analysis, 2012-2021, By Genomics Biomarker
Figure 83: Europe Neurological Biomarkers Market Size (US$ Mn) & Y-o-Y Growth (%), 2022-2028, By Genomics Biomarker
Figure 84: Europe Neurological Biomarkers Market Size Analysis, 2012-2021, By Proteomics Biomarkers
Figure 85: Europe Neurological Biomarkers Market Size (US$ Mn) & Y-o-Y Growth (%), 2022-2028, By Proteomics Biomarkers
Figure 86: Europe Neurological Biomarkers Market Size Analysis, 2012-2021, By Metabolomics Biomarkers
Figure 87: Europe Neurological Biomarkers Market Size (US$ Mn) & Y-o-Y Growth (%), 2022-2028, By Metabolomics Biomarkers
Figure 88: Europe Neurological Biomarkers Market Size Analysis, 2012-2021, By Imaging Biomarkers
Figure 89: Europe Neurological Biomarkers Market Size (US$ Mn) & Y-o-Y Growth (%), 2022-2028, By Imaging Biomarkers
Figure 90: Europe Neurological Biomarkers Market Size Analysis, 2012-2021, By Others
Figure 91: Europe Neurological Biomarkers Market Size (US$ Mn) & Y-o-Y Growth (%), 2022-2028, By Others
Figure 92: Europe Neurological Biomarkers Market Size Analysis, 2012-2021, By Alzheimer's disease
Figure 93: Europe Neurological Biomarkers Market Size (US$ Mn) & Y-o-Y Growth (%), 2022-2028, By Alzheimer's disease
Figure 94: Europe Neurological Biomarkers Market Size Analysis, 2012-2021, By Parkinson's disease
Figure 95: Europe Neurological Biomarkers Market Size (US$ Mn) & Y-o-Y Growth (%), 2022-2028, By Parkinson's disease
Figure 96: Europe Neurological Biomarkers Market Size Analysis, 2012-2021, By Foot & Huntington's Disease
Figure 97: Europe Neurological Biomarkers Market Size (US$ Mn) & Y-o-Y Growth (%), 2022-2028, By Foot & Huntington's Disease
Figure 98: Europe Neurological Biomarkers Market Size Analysis, 2012-2021, By Schizophrenia
Figure 99: Europe Neurological Biomarkers Market Size (US$ Mn) & Y-o-Y Growth (%), 2022-2028, By Schizophrenia
Figure 100: Europe Neurological Biomarkers Market Size Analysis, 2012-2021, By Foot & Depression
Figure 101: Europe Neurological Biomarkers Market Size (US$ Mn) & Y-o-Y Growth (%), 2022-2028, By Depression
Figure 102: Europe Neurological Biomarkers Market Size Analysis, 2012-2021, By Multiple Sclerosis
Figure 103: Europe Neurological Biomarkers Market Size (US$ Mn) & Y-o-Y Growth (%), 2022-2028, By Multiple Sclerosis
Figure 104: Europe Neurological Biomarkers Market Size Analysis, 2012-2021, By Spinal Muscular Atrophy
Figure 105: Europe Neurological Biomarkers Market Size (US$ Mn) & Y-o-Y Growth (%), 2022-2028, By Spinal Muscular Atrophy
Figure 106: Europe Neurological Biomarkers Market Attractiveness Analysis, By Country
Figure 107: Europe Neurological Biomarkers Market Attractiveness Analysis, By Type
Figure 108: Europe Neurological Biomarkers Market Attractiveness Analysis, By Application
Figure 109: Europe Neurological Biomarkers Market Attractiveness Analysis, By End User
Figure 110: Asia Pacific Neurological Biomarkers Market Value Share (%) By Type (2021)
Figure 111: Asia Pacific Neurological Biomarkers Market Value Share (%) By Application (2021)
Figure 112: Asia Pacific Neurological Biomarkers Market Value Share (%) By End User (2021)
Figure 113: Asia Pacific Neurological Biomarkers Market Value Share (%) By Country (2021)
Figure 114: Asia Pacific Neurological Biomarkers Market Value (US$ Mn) & Forecast 2021 & 2028
Figure 115: Asia Pacific Neurological Biomarkers Market Size Analysis, 2012-2021
Figure 116: Asia Pacific Neurological Biomarkers Market Size (US$ Mn) & Y-o-Y Growth (%), 2022-2028
Figure 117: Asia Pacific Neurological Biomarkers Market Size Analysis, 2012-2021, By Genomics Biomarker
Figure 118: Asia Pacific Neurological Biomarkers Market Size (US$ Mn) & Y-o-Y Growth (%), 2022-2028, By Genomics Biomarker
Figure 119: Asia Pacific Neurological Biomarkers Market Size Analysis, 2012-2021, By Proteomics Biomarkers
Figure 120: Asia Pacific Neurological Biomarkers Market Size (US$ Mn) & Y-o-Y Growth (%), 2022-2028, By Proteomics Biomarkers
Figure 121: Asia Pacific Neurological Biomarkers Market Size Analysis, 2012-2021, By Metabolomics Biomarkers
Figure 122: Asia Pacific Neurological Biomarkers Market Size (US$ Mn) & Y-o-Y Growth (%), 2022-2028, By Metabolomics Biomarkers
Figure 123: Asia Pacific Neurological Biomarkers Market Size Analysis, 2012-2021, By Imaging Biomarkers
Figure 124: Asia Pacific Neurological Biomarkers Market Size (US$ Mn) & Y-o-Y Growth (%), 2022-2028, By Imaging Biomarkers
Figure 125: Asia Pacific Neurological Biomarkers Market Size Analysis, 2012-2021, By Others
Figure 126: Asia Pacific Neurological Biomarkers Market Size (US$ Mn) & Y-o-Y Growth (%), 2022-2028, By Others
Figure 127: Asia Pacific Neurological Biomarkers Market Size Analysis, 2012-2021, By Alzheimer's disease
Figure 128: Asia Pacific Neurological Biomarkers Market Size (US$ Mn) & Y-o-Y Growth (%), 2022-2028, By Alzheimer's disease
Figure 129: Asia Pacific Neurological Biomarkers Market Size Analysis, 2012-2021, By Parkinson's disease
Figure 130: Asia Pacific Neurological Biomarkers Market Size (US$ Mn) & Y-o-Y Growth (%), 2022-2028, By Parkinson's disease
Figure 131: Asia Pacific Neurological Biomarkers Market Size Analysis, 2012-2021, By Foot & Huntington's Disease
Figure 132: Asia Pacific Neurological Biomarkers Market Size (US$ Mn) & Y-o-Y Growth (%), 2022-2028, By Foot & Huntington's Disease
Figure 133: Asia Pacific Neurological Biomarkers Market Size Analysis, 2012-2021, By Schizophrenia
Figure 134: Asia Pacific Neurological Biomarkers Market Size (US$ Mn) & Y-o-Y Growth (%), 2022-2028, By Schizophrenia
Figure 135: Asia Pacific Neurological Biomarkers Market Size Analysis, 2012-2021, By Foot & Depression
Figure 136: Asia Pacific Neurological Biomarkers Market Size (US$ Mn) & Y-o-Y Growth (%), 2022-2028, By Depression
Figure 137: Asia Pacific Neurological Biomarkers Market Size Analysis, 2012-2021, By Multiple Sclerosis
Figure 138: Asia Pacific Neurological Biomarkers Market Size (US$ Mn) & Y-o-Y Growth (%), 2022-2028, By Multiple Sclerosis
Figure 139: Asia Pacific Neurological Biomarkers Market Size Analysis, 2012-2021, By Spinal Muscular Atrophy
Figure 140: Asia Pacific Neurological Biomarkers Market Size (US$ Mn) & Y-o-Y Growth (%), 2022-2028, By Spinal Muscular Atrophy
Figure 141: Asia Pacific Neurological Biomarkers Market Attractiveness Analysis, By Country
Figure 142: Asia Pacific Neurological Biomarkers Market Attractiveness Analysis, By Type
Figure 143: Asia Pacific Neurological Biomarkers Market Attractiveness Analysis, By Application
Figure 144: Asia Pacific Neurological Biomarkers Market Attractiveness Analysis, By End User
Figure 145: Middle East & Africa Neurological Biomarkers Market Value Share (%) By Type (2021)
Figure 146: Middle East & Africa Neurological Biomarkers Market Value Share (%) By Application (2021)
Figure 147: Middle East & Africa Neurological Biomarkers Market Value Share (%) By End User (2021)
Figure 148: Middle East & Africa Neurological Biomarkers Market Value Share (%) By Country (2021)
Figure 149: Middle East & Africa Neurological Biomarkers Market Value (US$ Mn) & Forecast 2021 & 2028
Figure 150: Middle East & Africa Neurological Biomarkers Market Size Analysis, 2012-2021
Figure 151: Middle East & Africa Neurological Biomarkers Market Size (US$ Mn) & Y-o-Y Growth (%), 2022-2028
Figure 152: Middle East & Africa Neurological Biomarkers Market Size Analysis, 2012-2021, By Genomics Biomarker
Figure 153: Middle East & Africa Neurological Biomarkers Market Size (US$ Mn) & Y-o-Y Growth (%), 2022-2028, By Genomics Biomarker
Figure 154: Middle East & Africa Neurological Biomarkers Market Size Analysis, 2012-2021, By Proteomics Biomarkers
Figure 155: Middle East & Africa Neurological Biomarkers Market Size (US$ Mn) & Y-o-Y Growth (%), 2022-2028, By Proteomics Biomarkers
Figure 156: Middle East & Africa Neurological Biomarkers Market Size Analysis, 2012-2021, By Metabolomics Biomarkers
Figure 157: Middle East & Africa Neurological Biomarkers Market Size (US$ Mn) & Y-o-Y Growth (%), 2022-2028, By Metabolomics Biomarkers
Figure 158: Middle East & Africa Neurological Biomarkers Market Size Analysis, 2012-2021, By Imaging Biomarkers
Figure 159: Middle East & Africa Neurological Biomarkers Market Size (US$ Mn) & Y-o-Y Growth (%), 2022-2028, By Imaging Biomarkers
Figure 160: Middle East & Africa Neurological Biomarkers Market Size Analysis, 2012-2021, By Others
Figure 161: Middle East & Africa Neurological Biomarkers Market Size (US$ Mn) & Y-o-Y Growth (%), 2022-2028, By Others
Figure 162: Middle East & Africa Neurological Biomarkers Market Size Analysis, 2012-2021, By Alzheimer's disease
Figure 163: Middle East & Africa Neurological Biomarkers Market Size (US$ Mn) & Y-o-Y Growth (%), 2022-2028, By Alzheimer's disease
Figure 164: Middle East & Africa Neurological Biomarkers Market Size Analysis, 2012-2021, By Parkinson's disease
Figure 165: Middle East & Africa Neurological Biomarkers Market Size (US$ Mn) & Y-o-Y Growth (%), 2022-2028, By Parkinson's disease
Figure 166: Middle East & Africa Neurological Biomarkers Market Size Analysis, 2012-2021, By Foot & Huntington's Disease
Figure 167: Middle East & Africa Neurological Biomarkers Market Size (US$ Mn) & Y-o-Y Growth (%), 2022-2028, By Foot & Huntington's Disease
Figure 168: Middle East & Africa Neurological Biomarkers Market Size Analysis, 2012-2021, By Schizophrenia
Figure 169: Middle East & Africa Neurological Biomarkers Market Size (US$ Mn) & Y-o-Y Growth (%), 2022-2028, By Schizophrenia
Figure 170: Middle East & Africa Neurological Biomarkers Market Size Analysis, 2012-2021, By Foot & Depression
Figure 171: Middle East & Africa Neurological Biomarkers Market Size (US$ Mn) & Y-o-Y Growth (%), 2022-2028, By Depression
Figure 172: Middle East & Africa Neurological Biomarkers Market Size Analysis, 2012-2021, By Multiple Sclerosis
Figure 173: Middle East & Africa Neurological Biomarkers Market Size (US$ Mn) & Y-o-Y Growth (%), 2022-2028, By Multiple Sclerosis
Figure 174: Middle East & Africa Neurological Biomarkers Market Size Analysis, 2012-2021, By Spinal Muscular Atrophy
Figure 175: Middle East & Africa Neurological Biomarkers Market Size (US$ Mn) & Y-o-Y Growth (%), 2022-2028, By Spinal Muscular Atrophy
Figure 176: Middle East & Africa Neurological Biomarkers Market Attractiveness Analysis, By Country
Figure 177: Middle East & Africa Neurological Biomarkers Market Attractiveness Analysis, By Type
Figure 178: Middle East & Africa Neurological Biomarkers Market Attractiveness Analysis, By Application
Figure 179: Middle East & Africa Neurological Biomarkers Market Attractiveness Analysis, By End User
Figure 180: Global Neurology Biomarkers Market Share Analysis (%) By Region, 2021 & 2028
Figure 181: Global Neurology Biomarkers Market Y-o-Y Growth (%) By Region, 2022-2028
Figure 182: Global Neurological Biomarkers Market Attractiveness Analysis by Region, 2022-2028
Figure 183: Global Neurology Biomarkers Market Share Analysis (%) By Type, 2021 & 2028
Figure 184: Global Neurology Biomarkers Market Y-o-Y Growth (%) By Type, 2022-2028
Figure 185: Global Neurological Biomarkers Market Attractiveness Analysis by Type, 2022-2028
Figure 186: Global Neurology Biomarkers Market Share Analysis (%) By Application, 2021 & 2028
Figure 187: Global Neurology Biomarkers Market Y-o-Y Growth (%) By Application, 2022-2028
Figure 188: Global Neurological Biomarkers Market Attractiveness Analysis by Application, 2022-2028
Figure 189: Global Neurology Biomarkers Market Share Analysis (%) By End User, 2021 & 2028
Figure 190: Global Neurology Biomarkers Market Y-o-Y Growth (%) By End User, 2022-2028
Figure 191: Global Neurological Biomarkers Market Attractiveness Analysis by End User, 2022-2028
Figure 192: Global Neurological Biomarkers Market Value Analysis and Forecast, 2016–2028 (US$ Mn)
Figure 193: Global Neurological Biomarkers Market Absolute $ Opportunity (US$ Mn), 2012-2021
Figure 194: Global Neurological Biomarkers Market Absolute $ Opportunity (US$ Mn), 2016–2028
Need specific information?
Request CustomizationExplore Healthcare Insights
View Reports