Reports

- Global Locations -

Headquarters

Future Market Insights, Inc.

Christiana Corporate, 200
Continental Drive, Suite 401,
Newark, Delaware - 19713,
United States

T: +1-845-579-5705

Americas

Future Market Insights, Inc.

616 Corporate Way, Suite 2-9018,
Valley Cottage, NY 10989, United States

T: +1-347-918-3531

MEA

Future Market Insights

1602-6 Jumeirah Bay X2 Tower, Plot No: JLT-PH2-X2A,
Jumeirah Lakes Towers, Dubai,
United Arab Emirates

Europe

Future Market Insights

3rd Floor, 207 Regent Street,
W1B 3HH London
United Kingdom

T: + 44 (0) 20 8123 9659
D: +44 (0) 20 3287 4268

Asia Pacific

Future Market Insights

IndiaLand Global Tech Park, Unit UG-1, Behind Grand HighStreet, Phase 1, Hinjawadi, MH, Pune – 411057, India

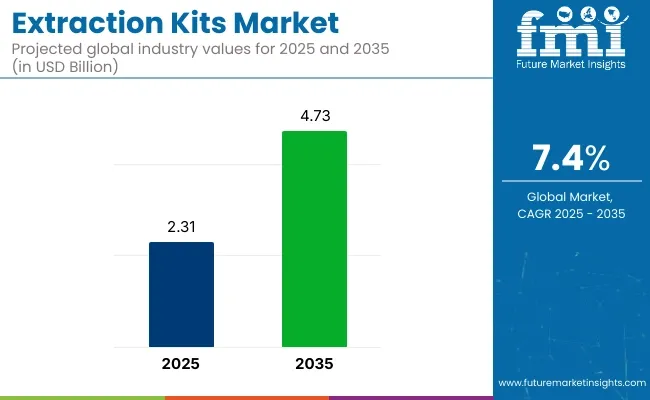
Extraction Kits Market Outlook (2023 to 2033)

The global demand for extraction kits is expected to increase at 7.1% CAGR over the forecast period. The extraction kits market size is estimated to reach a valuation of US$ 1,293.4 million by 2023. According to the study, DNA extraction kit products held a substantial share of 49.88% in 2022 in the global market.

Salient Factors Catalyzing the Market Growth Include:

  • Surging investments in research and development activities in diverse areas like infectious diseases and molecular diagnostics.
  • Key participants are focusing on releasing new products in the market to meet the evolving end user’s demand.
  • Soaring burden of cancer patients across the world is underscoring the necessity of extraction kits.
  • Key manufacturers are concentrating on automating the extraction technology, thus contributing toward product upgradation.

Don't pay for what you don't need

Customize your report by selecting specific countries or regions and save 30%!

What are the Key Opportunities for Extraction Kits Manufacturers?

An increasing number of research and development activities to develop vaccines to combat the diseases is expected to boost the market. Hence, key players are investing extensively to gain a competitive edge in the industry.

Other initiatives, such as the EMBO, and Young Investigator Program aids in the establishment of laboratories by life scientists. Under this initiative, the young researchers are expected to receive funding for four years. This is going to help them to establish their networking and training, enhancing their research development.

All research initiatives are projected to help the key players in the market to expand their footprints in emerging economies. Such situations are expected to help create attractive opportunities for local players to strengthen their position and increase their market share over the forecast period.

Key Factors Restraining the Extraction Kits Demand

  • Handling the extraction kits for the isolation of nucleic acids in forensic studies requires expert personnel. Currently, several countries do not have sufficiently trained personnel who can assist and expedite this process.
  • Stringent regulatory dynamics by regulatory authorities, such as the USA Food and Drug Administration (FDA), USDA (USA Department of Agriculture), and EPA (Environmental Protection Act) may hinder the market expansion over the forecast period.
Data Points Market Insights
Extraction Kits Industry Value 2022 US$ 1,218.4 million
Extraction Kits Market Value 2023 US$ 1,293.4 million
Extraction Kits Market Value 2033 US$ 2,556.6 million
Extraction Kits Industry CAGR 2023 to 2033 7.1%
Market Share of Top 5 Countries 56.5%

Sales Analysis of Extraction Kits Market from 2018 to 2022 Vs Demand Outlook for 2023 to 2033

According to Future Market Insights (FMI), the overall sales of extraction kits expanded at a CAGR of 7.4% between 2018 and 2022. However, the demand in the extraction kits industry is expected to increase at a CAGR of 7.1%, surpassing US$ 2,556.6 million by the end of 2033.

The global extraction kits market held around 5.0% of the global genome sequencing market, which was valued at nearly US$ 23 billion in the year 2021.

Market expansion is underpinned by growing innovation in molecular diagnostic techniques, resulting in the detection of numerous diseases. Integration of automation in these extraction systems is projected to simplify and improve the yield of nucleic acid extraction. For instance, Indian start-up 30M Genomics has developed a new extraction kit called AmpReady for extracting DNA from biological samples in five seconds without requiring any equipment. These kits offer accuracy and higher efficiency in analysis.

With a slew of advancements in automation for nucleic acid extraction, the market is projected to witness impressive growth over the coming years.

Rising investment by government bodies and other organizations for research and development activities in molecular diagnostics is likely to fuel the market. Increased funding for life science research and investments in molecular diagnostics is projected to fuel market growth.

According to UNESCO’s data, Germany spent about US$ 4 billion in 2021 to promote and boost research and development activities in the country. In China, the National Bureau of Statistics stated that China spent almost US$ 440.0 billion on research and development in 2021. As per the study, there was a 40% rise in spending as compared to 2020. As research and development funding activities are increasing across the globe, the extraction kits industry is poised to expand at a steady rate.

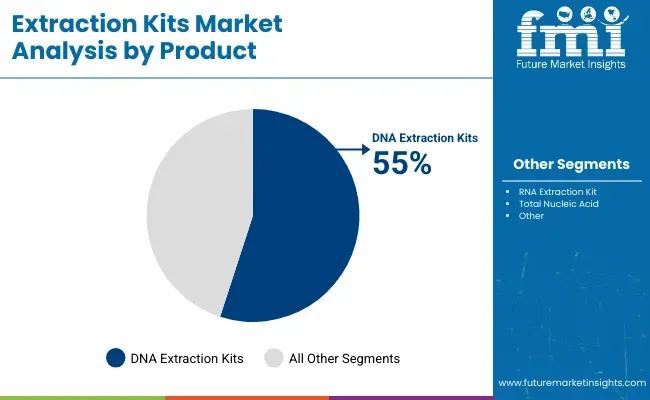
Based on product, DNA extraction kits were the dominant market segment in the global market in 2022, which contributed 49.88% of the revenue share. The global extraction kits market is expected to be valued at US$ 2,556.6 million by the end of 2033, registering a CAGR of 7.1% in the forecast period.

Sabyasachi Ghosh
Sabyasachi Ghosh

Principal Consultant

Talk to Analyst

Find your sweet spots for generating winning opportunities in this market.

Comparative Study: Market Analysis of Corresponding Markets

Extraction Kits Market:

Differentiating Aspects Extraction Kits Market
CAGR (Forecast Period) 7.1%
Market Valuation in 2023 US$ 1,293.4 million
Projected Market Value by 2033 US$ 2,556.6 million
Growth Factors Widening pool of cancer-affected patients to increase sales of extraction kits.
Trends Automation of processes to bring about desired turnover of extraction kits.
Opportunities Spurring funding by government authorities for the progress of extraction technology is projected to generate new growth avenues in the future.

DNA/RNA Extraction Market:

Differentiating Aspects DNA/RNA Extraction Market
CAGR (Forecast Period) 7.7%
Growth Factors The surge in RNA/DNA profiling of different organisms to efficiently understand or recognize unknown specimens.
Trends Availability of optimized DNA and RNA extraction kits for a variety of applications.
Opportunities The high potential to carve demand in developing countries is expected to catalyze market expansion.

Cardiac Biomarker Diagnostic Test Kits Market:

Differentiating Aspects Cardiac Biomarker Diagnostic Test Kits Market
CAGR (Forecast Period) 5.1%
Market Valuation in 2023 US$ 1.99 billion
Projected Market Value by 2033 US$ 3.27 billion
Growth Factors The rising strain of patients with cardiovascular ailments propels product demand.
Trends Altered way of living due to robust urbanization and industrialization, especially in urban areas.
Opportunities Beneficial government programs backing the establishment of diagnostic laboratories are projected to create ample opportunities for key players.

Geographical Forecast of Extraction Kits Market

North America to be Crowned as the Leading Market in the Extraction Kits Industry

Region North America
Market Share % 2022 33.4%
Market Size (US$ million) by 2023 US$ 431.99 million
Market Size (US$ million) by End of Forecast Period (2033) US$ 853.90 million

North America region held a market share of 33.4% in 2022. The market growth has been underpinned by several research and development activities. In addition to this, industry players are consistently updating their product portfolios, which is assessed to positively influence market trajectory. Other factors stimulating regional growth include:

  • Increasing investments by private sectors and government bodies to further research and development activities.
  • High frequency of chronic diseases such as cancer in the region. Breast cancer has been commonly detected in the United States as per historical estimates.

Europe to Observe Supportive Government Initiatives in Future

Region Europe
Market Share % 2022 28.7%
Market Size (US$ million) by 2023 US$ 371.2 million
Market Size (US$ million) by End of Forecast Period (2033) US$ 733.74 million

In 2022, Europe acquired a 28.7% market share in the global landscape. In the same year, the region gained US$ 371.2 million, and by 2033, the market is projected to gain US$ 733.74 million.

The large contribution of Europe in the global sphere is due to the accelerating patient population and beneficial government initiatives. Take for example, in 2020, Merck invested US$ 21.09 million to create a life sciences lab in Switzerland, Europe. This is projected to expedite and encourage research and development activities for the company, in addition to quality control and analytical production.

Get the data you need at a Fraction of the cost

Personalize your report by choosing insights you need
and save 40%!

Country-wise Insights: FMI Shares Micro-level Statistics and Insights into the Market

Technological Advances for Automation in DNA Extraction Kits to Boost the United States Market

Country The United States
Market Share % 2022 31%
Market Size (US$ million) by 2023 US$ 400.95 million
Market Size (US$ million) by End of Forecast Period (2033) US$ 792.54 million

According to Future Market Insights, the United States is expected to dominate North America, with a total market share of 92.8% in 2022. The country is projected to continue to exhibit high growth through 2023 and beyond.

In the global landscape, the United States’ share in the market stood maximum at 31% in 2022. In 2023, the market is assessed to amass a total of US$ 400.95 million. Similarly, by the forecast period’s end, the market is estimated to be valued at a maximum of US$ 792.54 million.

Technological advancements in the automation of DNA & RNA extraction across the United States is projected to drive product demand. For instance, Thermo Fischer Scientific launched the Thermo Scientific KingFisher Apex Purification System in April 2021.

Manufacturers in Germany Investing Effectively in Research and Development to Create Advanced RNA Extraction Kits

Country Germany
Market Share % 2022 7.3%
Market Size (US$ million) by 2023 US$ 94.41 million
Market Size (US$ million) by End of Forecast Period (2033) US$ 186.63 million

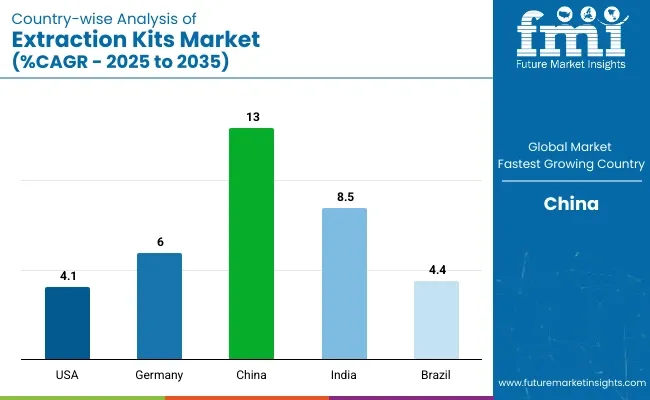
Germany is set to exhibit growth at a CAGR of 8.3% in Europe’s extraction kits market during the forecast period. Germany’s market captured 7.3% of the global market in 2022. By the end of the assessment period, the market is projected to be valued at a sum of US$ 186.63 million.

Increasing investment in research and development in Germany is uplifting the regional market status. Also, the development of new technologies for the fast detection of clinically important compounds is projected to facilitate market expansion.

China Expanding on the Development of RNA Extraction Kits for RNA Purification to Fortify its Market Position

Country China
Market CAGR % through till 2033 9.8%

China is projected to expand at a CAGR rate of 9.8% during the forecast period, anticipating Future Market Insights (FMI). China is expected to spearhead the growth in East Asia due to technological advancement in the healthcare sector.

Key players in the country are working toward developing sophisticated automated systems for nucleic acid extraction. Consequently, augmenting the product’s demand in the market.

Category-wise Insights

DNA Extraction Kits to Account for Nearly Half the Sales in Extraction Kits Market

Segment DNA Extraction Kits
Market Share (2022) 49.88%
Market Size (2023) US$ 645.14 million
Market Size (2033) US$ 1,275.23 million

The DNA extraction kits contributed about 49.88% of the market share in 2022 and are expected to register a CAGR of 7.4% in the forecast period. The availability of a wide range of robust kits and ease of application in various molecular biology applications for the detection of nucleic acids in cancerous tissues is projected to aid segment growth.

Which is the Chief Application in Extraction Kits Market?

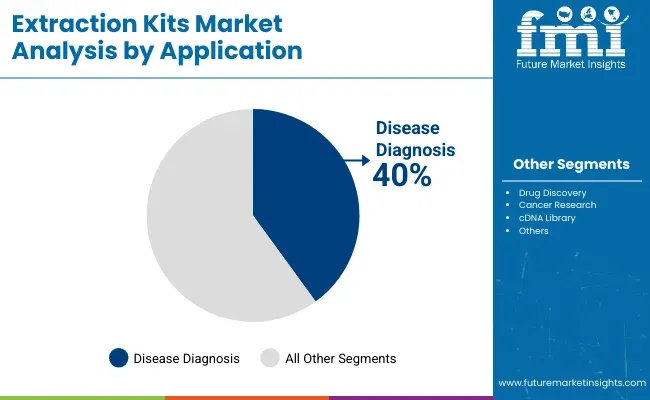
Nearly 2 out of 5 Extraction Kits Sales Come from Disease Diagnosis

Segment Disease Diagnosis
Market Share (2022) 37.08%
Market Size (2023) US$ 479.59 million
Market Size (2033) US$ 947.98 million

In terms of application, the disease diagnosis segment is expected to hold a 37.08% share in revenue, exhibiting growth at 7.8% CAGR in the forecast period. The increasing prevalence of chronic diseases, genetic disorders, and cancer has led to an increase in the use of DNA & RNA extraction kits. This is projected to contribute to the market expansion in the forecast period.

Why is the Demand for Extraction Kits Increasing in Diagnostic Laboratories?

Burgeoning Need for Nucleic Acid Extraction Kits in Diagnostic Laboratories to Propel the Sales

Based on end users, the diagnostic laboratories segment held a market share of more than 29.9% in 2022 and is poised to expand at a CAGR of 7.9% over the upcoming decade. Demand for extraction kits in diagnostic laboratories is increasing due to the high adoption of nucleic acid extraction kits for identifying and characterizing microbes. These microbes are the prime cause of certain chronic ailments.

How can Manufacturers Scale their Business?

  • Leading extraction kit manufacturers are focusing on collaborations and new product launches to gain high revenue. This also helps to expand their sales footprint in emerging countries.
  • Low awareness surrounding these kits in underdeveloped regions offer significant growth opportunity to manufacturers. Vendors can proliferate their operations in new geographies to gain access to many end users.
  • Circulation of investment pockets in developed regions like Europe and North America to help manufacturers prepare progressive extraction kits is also expected to fuel business growth.
  • Creation of user-convenient and accurate extraction kits is gaining high traction in the market. Producers can focus on their manufacturing capacities to develop products aligned with consumers’ requirements.
  • Continuous deployment of general yet effective strategies like mergers, acquisitions, partnerships, and collaborations.

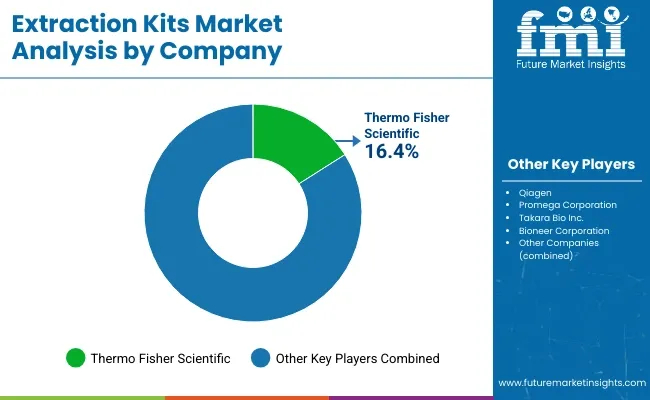
Key Players in the Extraction Kits Industry

  • Bio Rad Laboratories Inc.
  • Thermo Fisher Scientific
  • Promega Corporation
  • Agilent Technologies
  • Bioneer Corporation
  • PerkinElmer Inc.
  • LGC Biosearch Technologies
  • Qiagen
  • General Biosystems
  • Takara Bio Inc.
  • Roche Life Science
  • GeneReach Biotechnology Corporation.
  • Merck Millipore
  • BioFire Defense LLC
  • Akonni Biosystems, Inc
  • Primerdesign Ltd.

Key Developments in the Extraction Kits Market:

  • In July 2021, Bio-Rad Laboratories, Inc. announced its collaboration with Seegene, Inc. which is a provider of multiplex molecular diagnostics. The collaboration was done for the clinical development and commercialization of infectious disease molecular diagnostic products.
  • In March 2021, Promega Corporation launched XpressAmp™ Direct Amplification Reagents that facilitate RNA extraction-free sample preparation for laboratory testing for COVID-19.
  • In March 2021, Agilent Technologies Inc. launched a real-time reverse transcription (qRT) PCR-based diagnostic kit for the detection of SARS-CoV-2 RNA. The product is CE-IVD marked under the European Union in-Vitro Diagnostic Directive 98/79/EC.
  • In August 2021, Shanghai Promega Biological Products Co., Ltd. and Shanghai Henlius Biotech, Inc. collaborated to develop and commercialize a microsatellite instability (MSI) companion diagnostic IVD kit to identify cancer patients.

Scope of Extraction Kits Market Report

Attribute Details
Forecast Period 2023 to 2033
Historical Data Available for 2018 to 2022
Market Analysis US$ million for Value
Key Regions Covered North America, Latin America, Europe, South Asia, East Asia, Oceania, and the Middle East & Africa
Key Countries Covered The United States, Canada, Brazil, Mexico, Argentina, Germany, the United Kingdom, France, Italy, Spain, Russia, BENELUX, China, Japan, South Korea, India, Thailand, Indonesia, Malaysia, Australia, New Zealand, North Africa, GCC Countries, Türkiye, and South Africa
Key Market Segments Covered Product, Application, End User, and Region
Key Companies Profiled
  • Bio Rad Laboratories Inc.
  • Thermo Fisher Scientific
  • Promega Corporation
  • Agilent Technologies
  • Bioneer Corporation
  • PerkinElmer Inc.
  • LGC Biosearch Technologies
  • Qiagen
  • General Biosystems
  • Takara Bio Inc.
  • Roche Life Science
  • GeneReach Biotechnology Corporation.
  • Merck Millipore
  • BioFire Defense LLC
  • Akonni Biosystems, Inc
  • Primerdesign Ltd.
Pricing Available upon Request

Key Market Segments Covered in Extraction Kits Industry Research

By Product:

  • DNA Extraction Kits
    • Sequence-specific DNA
    • Cell-free DNA (cfDNA)
    • Tissue DNA Extraction Kits
  • RNA extraction Kits
    • Total RNA
    • Purified RNAs
    • Viral RNA
    • Sequence-specific RNA
  • Total nucleic acid (RNA + DNA)

By Application:

  • Disease Diagnosis
  • Drug Discovery
  • Cancer Research
  • cDNA Library
  • Others

By End User:

  • Hospitals
  • Academic and Research Institutions
  • Pharmaceutical and Biotechnology Companies
  • Clinical Research Organizations
  • Diagnostic Laboratories
  • Forensic Labs

By Region:

  • North America
  • Latin America
  • Europe
  • South Asia
  • East Asia
  • Oceania
  • The Middle East and Africa (MEA)

Frequently Asked Questions

What is the Current Extraction Kits Market Valuation?

The market is estimated to secure a valuation of US$ 1,293.4 million in 2023.

How Big will the Market by 2033?

The market is estimated to reach US$ 2,556.6 million by 2033.

What is the Growth Potential of the Market?

Through 2033, the market is anticipated to expand at a 7.1% CAGR.

What Boosts the Growth Potential of the Market?

Enhancing government financing for the advancement of extraction technologies to establish new growth potential.

What is the Market Share of the United States?

The United States has a substantial market share at 31%.

Which Product Segment to Grab a Significant Share in the Market?

The DNA extraction kits accounted for about 49.88% of the market share.

Which Application Is Anticipated to Gain Momentum in the Market?

The disease diagnosis category is set to rise at a 7.8% CAGR.

Table of Content

1. Executive Summary

    1.1. Global Market Outlook

    1.2. Demand-side Trends

    1.3. Supply-side Trends

    1.4. Technology Roadmap Analysis

    1.5. Analysis and Recommendations

2. Market Overview

    2.1. Market Coverage / Taxonomy

    2.2. Market Definition / Scope / Limitations

3. Market Background

    3.1. Market Dynamics

        3.1.1. Drivers

        3.1.2. Restraints

        3.1.3. Opportunity 

        3.1.4. Trends

    3.2. Scenario Forecast

        3.2.1. Demand in Optimistic Scenario

        3.2.2. Demand in Likely Scenario

        3.2.3. Demand in Conservative Scenario

    3.3. Opportunity Map Analysis

    3.4. Product Life Cycle Analysis

    3.5. Supply Chain Analysis

        3.5.1. Supply Side Participants and their Roles

            3.5.1.1. Producers

            3.5.1.2. Mid-Level Participants (Traders/ Agents/ Brokers)

            3.5.1.3. Wholesalers and Distributors

        3.5.2. Value Added and Value Created at Node in the Supply Chain

        3.5.3. List of Raw Material Suppliers

        3.5.4. List of Existing and Potential Buyer’s

    3.6. Investment Feasibility Matrix

    3.7. Value Chain Analysis

        3.7.1. Profit Margin Analysis

        3.7.2. Wholesalers and Distributors

        3.7.3. Retailers

    3.8. PESTLE and Porter’s Analysis

    3.9. Regulatory Landscape

        3.9.1. By Key Regions

        3.9.2. By Key Countries

    3.10. Regional Parent Market Outlook

    3.11. Production and Consumption Statistics

    3.12. Import and Export Statistics

4. Global Market Analysis 2018 to 2022 and Forecast, 2023 to 2033

    4.1. Historical Market Size Value (US$ Million) & Volume (Units) Analysis, 2018 to 2022

    4.2. Current and Future Market Size Value (US$ Million) & Volume (Units) Projections, 2023 to 2033

        4.2.1. Y-o-Y Growth Trend Analysis

        4.2.2. Absolute $ Opportunity Analysis

5. Global Market Analysis 2018 to 2022 and Forecast 2023 to 2033, By Product

    5.1. Introduction / Key Findings

    5.2. Historical Market Size Value (US$ Million) & Volume (Units) Analysis By Product, 2018 to 2022

    5.3. Current and Future Market Size Value (US$ Million) & Volume (Units) Analysis and Forecast By Product, 2023 to 2033

        5.3.1. DNA Extraction Kits

            5.3.1.1. Sequence-specific DNA

            5.3.1.2. Cell-free DNA (cfDNA)

            5.3.1.3. Tissue DNA Extraction Kits

        5.3.2. RNA extraction Kits

            5.3.2.1. Total RNA

            5.3.2.2. Purified RNAs

            5.3.2.3. Viral RNA

            5.3.2.4. Sequence-specific RNA

        5.3.3. Total nucleic acid (RNA + DNA)

    5.4. Y-o-Y Growth Trend Analysis By Product, 2018 to 2022

    5.5. Absolute $ Opportunity Analysis By Product, 2023 to 2033

6. Global Market Analysis 2018 to 2022 and Forecast 2023 to 2033, By Application

    6.1. Introduction / Key Findings

    6.2. Historical Market Size Value (US$ Million) & Volume (Units) Analysis By Application, 2018 to 2022

    6.3. Current and Future Market Size Value (US$ Million) & Volume (Units) Analysis and Forecast By Application, 2023 to 2033

        6.3.1. Disease Diagnosis

        6.3.2. Drug Discovery

        6.3.3. Cancer Research

        6.3.4. cDNA Library

        6.3.5. Others

    6.4. Y-o-Y Growth Trend Analysis By Application, 2018 to 2022

    6.5. Absolute $ Opportunity Analysis By Application, 2023 to 2033

7. Global Market Analysis 2018 to 2022 and Forecast 2023 to 2033, By  End User

    7.1. Introduction / Key Findings

    7.2. Historical Market Size Value (US$ Million) & Volume (Units) Analysis By  End User, 2018 to 2022

    7.3. Current and Future Market Size Value (US$ Million) & Volume (Units) Analysis and Forecast By  End User, 2023 to 2033

        7.3.1. Hospitals

        7.3.2. Academic and Research Institutions

        7.3.3. Pharmaceutical and Biotechnology Companies

        7.3.4. Clinical Research Organisations

        7.3.5. Diagnostic Laboratories

        7.3.6. Forensic Labs

    7.4. Y-o-Y Growth Trend Analysis By  End User, 2018 to 2022

    7.5. Absolute $ Opportunity Analysis By  End User, 2023 to 2033

8. Global Market Analysis 2018 to 2022 and Forecast 2023 to 2033, By Region

    8.1. Introduction

    8.2. Historical Market Size Value (US$ Million) & Volume (Units) Analysis By Region, 2018 to 2022

    8.3. Current Market Size Value (US$ Million) & Volume (Units) Analysis and Forecast By Region, 2023 to 2033

        8.3.1. North America

        8.3.2. Latin America

        8.3.3. Europe

        8.3.4. Asia Pacific

        8.3.5. MEA

    8.4. Market Attractiveness Analysis By Region

9. North America Market Analysis 2018 to 2022 and Forecast 2023 to 2033, By Country

    9.1. Historical Market Size Value (US$ Million) & Volume (Units) Trend Analysis By Market Taxonomy, 2018 to 2022

    9.2. Market Size Value (US$ Million) & Volume (Units) Forecast By Market Taxonomy, 2023 to 2033

        9.2.1. By Country

            9.2.1.1. USA

            9.2.1.2. Canada

        9.2.2. By Product

        9.2.3. By Application

        9.2.4. By  End User

    9.3. Market Attractiveness Analysis

        9.3.1. By Country

        9.3.2. By Product

        9.3.3. By Application

        9.3.4. By  End User

    9.4. Key Takeaways

10. Latin America Market Analysis 2018 to 2022 and Forecast 2023 to 2033, By Country

    10.1. Historical Market Size Value (US$ Million) & Volume (Units) Trend Analysis By Market Taxonomy, 2018 to 2022

    10.2. Market Size Value (US$ Million) & Volume (Units) Forecast By Market Taxonomy, 2023 to 2033

        10.2.1. By Country

            10.2.1.1. Brazil

            10.2.1.2. Mexico

            10.2.1.3. Rest of Latin America

        10.2.2. By Product

        10.2.3. By Application

        10.2.4. By  End User

    10.3. Market Attractiveness Analysis

        10.3.1. By Country

        10.3.2. By Product

        10.3.3. By Application

        10.3.4. By  End User

    10.4. Key Takeaways

11. Europe Market Analysis 2018 to 2022 and Forecast 2023 to 2033, By Country

    11.1. Historical Market Size Value (US$ Million) & Volume (Units) Trend Analysis By Market Taxonomy, 2018 to 2022

    11.2. Market Size Value (US$ Million) & Volume (Units) Forecast By Market Taxonomy, 2023 to 2033

        11.2.1. By Country

            11.2.1.1. Germany

            11.2.1.2. UK

            11.2.1.3. France

            11.2.1.4. Spain

            11.2.1.5. Italy

            11.2.1.6. Rest of Europe

        11.2.2. By Product

        11.2.3. By Application

        11.2.4. By  End User

    11.3. Market Attractiveness Analysis

        11.3.1. By Country

        11.3.2. By Product

        11.3.3. By Application

        11.3.4. By  End User

    11.4. Key Takeaways

12. Asia Pacific Market Analysis 2018 to 2022 and Forecast 2023 to 2033, By Country

    12.1. Historical Market Size Value (US$ Million) & Volume (Units) Trend Analysis By Market Taxonomy, 2018 to 2022

    12.2. Market Size Value (US$ Million) & Volume (Units) Forecast By Market Taxonomy, 2023 to 2033

        12.2.1. By Country

            12.2.1.1. China

            12.2.1.2. Japan

            12.2.1.3. South Korea

            12.2.1.4. Singapore

            12.2.1.5. Thailand

            12.2.1.6. Indonesia

            12.2.1.7. Australia

            12.2.1.8. New Zealand

            12.2.1.9. Rest of Asia Pacific

        12.2.2. By Product

        12.2.3. By Application

        12.2.4. By  End User

    12.3. Market Attractiveness Analysis

        12.3.1. By Country

        12.3.2. By Product

        12.3.3. By Application

        12.3.4. By  End User

    12.4. Key Takeaways

13. MEA Market Analysis 2018 to 2022 and Forecast 2023 to 2033, By Country

    13.1. Historical Market Size Value (US$ Million) & Volume (Units) Trend Analysis By Market Taxonomy, 2018 to 2022

    13.2. Market Size Value (US$ Million) & Volume (Units) Forecast By Market Taxonomy, 2023 to 2033

        13.2.1. By Country

            13.2.1.1. GCC Countries

            13.2.1.2. South Africa

            13.2.1.3. Israel

            13.2.1.4. Rest of MEA

        13.2.2. By Product

        13.2.3. By Application

        13.2.4. By  End User

    13.3. Market Attractiveness Analysis

        13.3.1. By Country

        13.3.2. By Product

        13.3.3. By Application

        13.3.4. By  End User

    13.4. Key Takeaways

14. Key Countries Market Analysis

    14.1. USA

        14.1.1. Pricing Analysis

        14.1.2. Market Share Analysis, 2022

            14.1.2.1. By Product

            14.1.2.2. By Application

            14.1.2.3. By  End User

    14.2. Canada

        14.2.1. Pricing Analysis

        14.2.2. Market Share Analysis, 2022

            14.2.2.1. By Product

            14.2.2.2. By Application

            14.2.2.3. By  End User

    14.3. Brazil

        14.3.1. Pricing Analysis

        14.3.2. Market Share Analysis, 2022

            14.3.2.1. By Product

            14.3.2.2. By Application

            14.3.2.3. By  End User

    14.4. Mexico

        14.4.1. Pricing Analysis

        14.4.2. Market Share Analysis, 2022

            14.4.2.1. By Product

            14.4.2.2. By Application

            14.4.2.3. By  End User

    14.5. Germany

        14.5.1. Pricing Analysis

        14.5.2. Market Share Analysis, 2022

            14.5.2.1. By Product

            14.5.2.2. By Application

            14.5.2.3. By  End User

    14.6. UK

        14.6.1. Pricing Analysis

        14.6.2. Market Share Analysis, 2022

            14.6.2.1. By Product

            14.6.2.2. By Application

            14.6.2.3. By  End User

    14.7. France

        14.7.1. Pricing Analysis

        14.7.2. Market Share Analysis, 2022

            14.7.2.1. By Product

            14.7.2.2. By Application

            14.7.2.3. By  End User

    14.8. Spain

        14.8.1. Pricing Analysis

        14.8.2. Market Share Analysis, 2022

            14.8.2.1. By Product

            14.8.2.2. By Application

            14.8.2.3. By  End User

    14.9. Italy

        14.9.1. Pricing Analysis

        14.9.2. Market Share Analysis, 2022

            14.9.2.1. By Product

            14.9.2.2. By Application

            14.9.2.3. By  End User

    14.10. China

        14.10.1. Pricing Analysis

        14.10.2. Market Share Analysis, 2022

            14.10.2.1. By Product

            14.10.2.2. By Application

            14.10.2.3. By  End User

    14.11. Japan

        14.11.1. Pricing Analysis

        14.11.2. Market Share Analysis, 2022

            14.11.2.1. By Product

            14.11.2.2. By Application

            14.11.2.3. By  End User

    14.12. South Korea

        14.12.1. Pricing Analysis

        14.12.2. Market Share Analysis, 2022

            14.12.2.1. By Product

            14.12.2.2. By Application

            14.12.2.3. By  End User

    14.13. Singapore

        14.13.1. Pricing Analysis

        14.13.2. Market Share Analysis, 2022

            14.13.2.1. By Product

            14.13.2.2. By Application

            14.13.2.3. By  End User

    14.14. Thailand

        14.14.1. Pricing Analysis

        14.14.2. Market Share Analysis, 2022

            14.14.2.1. By Product

            14.14.2.2. By Application

            14.14.2.3. By  End User

    14.15. Indonesia

        14.15.1. Pricing Analysis

        14.15.2. Market Share Analysis, 2022

            14.15.2.1. By Product

            14.15.2.2. By Application

            14.15.2.3. By  End User

    14.16. Australia

        14.16.1. Pricing Analysis

        14.16.2. Market Share Analysis, 2022

            14.16.2.1. By Product

            14.16.2.2. By Application

            14.16.2.3. By  End User

    14.17. New Zealand

        14.17.1. Pricing Analysis

        14.17.2. Market Share Analysis, 2022

            14.17.2.1. By Product

            14.17.2.2. By Application

            14.17.2.3. By  End User

    14.18. GCC Countries

        14.18.1. Pricing Analysis

        14.18.2. Market Share Analysis, 2022

            14.18.2.1. By Product

            14.18.2.2. By Application

            14.18.2.3. By  End User

    14.19. South Africa

        14.19.1. Pricing Analysis

        14.19.2. Market Share Analysis, 2022

            14.19.2.1. By Product

            14.19.2.2. By Application

            14.19.2.3. By  End User

    14.20. Israel

        14.20.1. Pricing Analysis

        14.20.2. Market Share Analysis, 2022

            14.20.2.1. By Product

            14.20.2.2. By Application

            14.20.2.3. By  End User

15. Market Structure Analysis

    15.1. Competition Dashboard

    15.2. Competition Benchmarking

    15.3. Market Share Analysis of Top Players

        15.3.1. By Regional

        15.3.2. By Product

        15.3.3. By Application

        15.3.4. By  End User

16. Competition Analysis

    16.1. Competition Deep Dive

        16.1.1. Bio Rad Laboratories Inc.

            16.1.1.1. Overview

            16.1.1.2. Product Portfolio

            16.1.1.3. Profitability by Market Segments

            16.1.1.4. Sales Footprint

            16.1.1.5. Strategy Overview

                16.1.1.5.1. Marketing Strategy

                16.1.1.5.2. Product Strategy

                16.1.1.5.3. Channel Strategy

        16.1.2. Thermo Fisher Scientific

            16.1.2.1. Overview

            16.1.2.2. Product Portfolio

            16.1.2.3. Profitability by Market Segments

            16.1.2.4. Sales Footprint

            16.1.2.5. Strategy Overview

                16.1.2.5.1. Marketing Strategy

                16.1.2.5.2. Product Strategy

                16.1.2.5.3. Channel Strategy

        16.1.3. Promega Corporation

            16.1.3.1. Overview

            16.1.3.2. Product Portfolio

            16.1.3.3. Profitability by Market Segments

            16.1.3.4. Sales Footprint

            16.1.3.5. Strategy Overview

                16.1.3.5.1. Marketing Strategy

                16.1.3.5.2. Product Strategy

                16.1.3.5.3. Channel Strategy

        16.1.4. Agilent Technologies

            16.1.4.1. Overview

            16.1.4.2. Product Portfolio

            16.1.4.3. Profitability by Market Segments

            16.1.4.4. Sales Footprint

            16.1.4.5. Strategy Overview

                16.1.4.5.1. Marketing Strategy

                16.1.4.5.2. Product Strategy

                16.1.4.5.3. Channel Strategy

        16.1.5. Bioneer Corporation

            16.1.5.1. Overview

            16.1.5.2. Product Portfolio

            16.1.5.3. Profitability by Market Segments

            16.1.5.4. Sales Footprint

            16.1.5.5. Strategy Overview

                16.1.5.5.1. Marketing Strategy

                16.1.5.5.2. Product Strategy

                16.1.5.5.3. Channel Strategy

        16.1.6. PerkinElmer Inc.

            16.1.6.1. Overview

            16.1.6.2. Product Portfolio

            16.1.6.3. Profitability by Market Segments

            16.1.6.4. Sales Footprint

            16.1.6.5. Strategy Overview

                16.1.6.5.1. Marketing Strategy

                16.1.6.5.2. Product Strategy

                16.1.6.5.3. Channel Strategy

        16.1.7. LGC Biosearch Technologies

            16.1.7.1. Overview

            16.1.7.2. Product Portfolio

            16.1.7.3. Profitability by Market Segments

            16.1.7.4. Sales Footprint

            16.1.7.5. Strategy Overview

                16.1.7.5.1. Marketing Strategy

                16.1.7.5.2. Product Strategy

                16.1.7.5.3. Channel Strategy

        16.1.8. Qiagen

            16.1.8.1. Overview

            16.1.8.2. Product Portfolio

            16.1.8.3. Profitability by Market Segments

            16.1.8.4. Sales Footprint

            16.1.8.5. Strategy Overview

                16.1.8.5.1. Marketing Strategy

                16.1.8.5.2. Product Strategy

                16.1.8.5.3. Channel Strategy

        16.1.9. General Biosystems

            16.1.9.1. Overview

            16.1.9.2. Product Portfolio

            16.1.9.3. Profitability by Market Segments

            16.1.9.4. Sales Footprint

            16.1.9.5. Strategy Overview

                16.1.9.5.1. Marketing Strategy

                16.1.9.5.2. Product Strategy

                16.1.9.5.3. Channel Strategy

        16.1.10. Takara Bio Inc.

            16.1.10.1. Overview

            16.1.10.2. Product Portfolio

            16.1.10.3. Profitability by Market Segments

            16.1.10.4. Sales Footprint

            16.1.10.5. Strategy Overview

                16.1.10.5.1. Marketing Strategy

                16.1.10.5.2. Product Strategy

                16.1.10.5.3. Channel Strategy

        16.1.11. Roche Life Science

            16.1.11.1. Overview

            16.1.11.2. Product Portfolio

            16.1.11.3. Profitability by Market Segments

            16.1.11.4. Sales Footprint

            16.1.11.5. Strategy Overview

                16.1.11.5.1. Marketing Strategy

                16.1.11.5.2. Product Strategy

                16.1.11.5.3. Channel Strategy

        16.1.12. GeneReach Biotechnology Corporation.

            16.1.12.1. Overview

            16.1.12.2. Product Portfolio

            16.1.12.3. Profitability by Market Segments

            16.1.12.4. Sales Footprint

            16.1.12.5. Strategy Overview

                16.1.12.5.1. Marketing Strategy

                16.1.12.5.2. Product Strategy

                16.1.12.5.3. Channel Strategy

        16.1.13. Merck Millipore

            16.1.13.1. Overview

            16.1.13.2. Product Portfolio

            16.1.13.3. Profitability by Market Segments

            16.1.13.4. Sales Footprint

            16.1.13.5. Strategy Overview

                16.1.13.5.1. Marketing Strategy

                16.1.13.5.2. Product Strategy

                16.1.13.5.3. Channel Strategy

        16.1.14. BioFire Defense LLC

            16.1.14.1. Overview

            16.1.14.2. Product Portfolio

            16.1.14.3. Profitability by Market Segments

            16.1.14.4. Sales Footprint

            16.1.14.5. Strategy Overview

                16.1.14.5.1. Marketing Strategy

                16.1.14.5.2. Product Strategy

                16.1.14.5.3. Channel Strategy

        16.1.15. Akonni Biosystems, Inc

            16.1.15.1. Overview

            16.1.15.2. Product Portfolio

            16.1.15.3. Profitability by Market Segments

            16.1.15.4. Sales Footprint

            16.1.15.5. Strategy Overview

                16.1.15.5.1. Marketing Strategy

                16.1.15.5.2. Product Strategy

                16.1.15.5.3. Channel Strategy

        16.1.16. Primerdesign Ltd.

            16.1.16.1. Overview

            16.1.16.2. Product Portfolio

            16.1.16.3. Profitability by Market Segments

            16.1.16.4. Sales Footprint

            16.1.16.5. Strategy Overview

                16.1.16.5.1. Marketing Strategy

                16.1.16.5.2. Product Strategy

                16.1.16.5.3. Channel Strategy

17. Assumptions & Acronyms Used

18. Research Methodology

Don't pay for what you don't need

Customize your report by selecting specific countries or regions and save 30%!

List of Tables

Table 1: Global Market Value (US$ Million) Forecast by Region, 2018 to 2033

Table 2: Global Market Volume (Units) Forecast by Region, 2018 to 2033

Table 3: Global Market Value (US$ Million) Forecast by Product, 2018 to 2033

Table 4: Global Market Volume (Units) Forecast by Product, 2018 to 2033

Table 5: Global Market Value (US$ Million) Forecast by Application, 2018 to 2033

Table 6: Global Market Volume (Units) Forecast by Application, 2018 to 2033

Table 7: Global Market Value (US$ Million) Forecast by  End User, 2018 to 2033

Table 8: Global Market Volume (Units) Forecast by  End User, 2018 to 2033

Table 9: North America Market Value (US$ Million) Forecast by Country, 2018 to 2033

Table 10: North America Market Volume (Units) Forecast by Country, 2018 to 2033

Table 11: North America Market Value (US$ Million) Forecast by Product, 2018 to 2033

Table 12: North America Market Volume (Units) Forecast by Product, 2018 to 2033

Table 13: North America Market Value (US$ Million) Forecast by Application, 2018 to 2033

Table 14: North America Market Volume (Units) Forecast by Application, 2018 to 2033

Table 15: North America Market Value (US$ Million) Forecast by  End User, 2018 to 2033

Table 16: North America Market Volume (Units) Forecast by  End User, 2018 to 2033

Table 17: Latin America Market Value (US$ Million) Forecast by Country, 2018 to 2033

Table 18: Latin America Market Volume (Units) Forecast by Country, 2018 to 2033

Table 19: Latin America Market Value (US$ Million) Forecast by Product, 2018 to 2033

Table 20: Latin America Market Volume (Units) Forecast by Product, 2018 to 2033

Table 21: Latin America Market Value (US$ Million) Forecast by Application, 2018 to 2033

Table 22: Latin America Market Volume (Units) Forecast by Application, 2018 to 2033

Table 23: Latin America Market Value (US$ Million) Forecast by  End User, 2018 to 2033

Table 24: Latin America Market Volume (Units) Forecast by  End User, 2018 to 2033

Table 25: Europe Market Value (US$ Million) Forecast by Country, 2018 to 2033

Table 26: Europe Market Volume (Units) Forecast by Country, 2018 to 2033

Table 27: Europe Market Value (US$ Million) Forecast by Product, 2018 to 2033

Table 28: Europe Market Volume (Units) Forecast by Product, 2018 to 2033

Table 29: Europe Market Value (US$ Million) Forecast by Application, 2018 to 2033

Table 30: Europe Market Volume (Units) Forecast by Application, 2018 to 2033

Table 31: Europe Market Value (US$ Million) Forecast by  End User, 2018 to 2033

Table 32: Europe Market Volume (Units) Forecast by  End User, 2018 to 2033

Table 33: Asia Pacific Market Value (US$ Million) Forecast by Country, 2018 to 2033

Table 34: Asia Pacific Market Volume (Units) Forecast by Country, 2018 to 2033

Table 35: Asia Pacific Market Value (US$ Million) Forecast by Product, 2018 to 2033

Table 36: Asia Pacific Market Volume (Units) Forecast by Product, 2018 to 2033

Table 37: Asia Pacific Market Value (US$ Million) Forecast by Application, 2018 to 2033

Table 38: Asia Pacific Market Volume (Units) Forecast by Application, 2018 to 2033

Table 39: Asia Pacific Market Value (US$ Million) Forecast by  End User, 2018 to 2033

Table 40: Asia Pacific Market Volume (Units) Forecast by  End User, 2018 to 2033

Table 41: MEA Market Value (US$ Million) Forecast by Country, 2018 to 2033

Table 42: MEA Market Volume (Units) Forecast by Country, 2018 to 2033

Table 43: MEA Market Value (US$ Million) Forecast by Product, 2018 to 2033

Table 44: MEA Market Volume (Units) Forecast by Product, 2018 to 2033

Table 45: MEA Market Value (US$ Million) Forecast by Application, 2018 to 2033

Table 46: MEA Market Volume (Units) Forecast by Application, 2018 to 2033

Table 47: MEA Market Value (US$ Million) Forecast by  End User, 2018 to 2033

Table 48: MEA Market Volume (Units) Forecast by  End User, 2018 to 2033
Sabyasachi Ghosh
Sabyasachi Ghosh

Principal Consultant

Talk to Analyst

Find your sweet spots for generating winning opportunities in this market.

List of Charts

Figure 1: Global Market Value (US$ Million) by Product, 2023 to 2033

Figure 2: Global Market Value (US$ Million) by Application, 2023 to 2033

Figure 3: Global Market Value (US$ Million) by  End User, 2023 to 2033

Figure 4: Global Market Value (US$ Million) by Region, 2023 to 2033

Figure 5: Global Market Value (US$ Million) Analysis by Region, 2018 to 2033

Figure 6: Global Market Volume (Units) Analysis by Region, 2018 to 2033

Figure 7: Global Market Value Share (%) and BPS Analysis by Region, 2023 to 2033

Figure 8: Global Market Y-o-Y Growth (%) Projections by Region, 2023 to 2033

Figure 9: Global Market Value (US$ Million) Analysis by Product, 2018 to 2033

Figure 10: Global Market Volume (Units) Analysis by Product, 2018 to 2033

Figure 11: Global Market Value Share (%) and BPS Analysis by Product, 2023 to 2033

Figure 12: Global Market Y-o-Y Growth (%) Projections by Product, 2023 to 2033

Figure 13: Global Market Value (US$ Million) Analysis by Application, 2018 to 2033

Figure 14: Global Market Volume (Units) Analysis by Application, 2018 to 2033

Figure 15: Global Market Value Share (%) and BPS Analysis by Application, 2023 to 2033

Figure 16: Global Market Y-o-Y Growth (%) Projections by Application, 2023 to 2033

Figure 17: Global Market Value (US$ Million) Analysis by  End User, 2018 to 2033

Figure 18: Global Market Volume (Units) Analysis by  End User, 2018 to 2033

Figure 19: Global Market Value Share (%) and BPS Analysis by  End User, 2023 to 2033

Figure 20: Global Market Y-o-Y Growth (%) Projections by  End User, 2023 to 2033

Figure 21: Global Market Attractiveness by Product, 2023 to 2033

Figure 22: Global Market Attractiveness by Application, 2023 to 2033

Figure 23: Global Market Attractiveness by  End User, 2023 to 2033

Figure 24: Global Market Attractiveness by Region, 2023 to 2033

Figure 25: North America Market Value (US$ Million) by Product, 2023 to 2033

Figure 26: North America Market Value (US$ Million) by Application, 2023 to 2033

Figure 27: North America Market Value (US$ Million) by  End User, 2023 to 2033

Figure 28: North America Market Value (US$ Million) by Country, 2023 to 2033

Figure 29: North America Market Value (US$ Million) Analysis by Country, 2018 to 2033

Figure 30: North America Market Volume (Units) Analysis by Country, 2018 to 2033

Figure 31: North America Market Value Share (%) and BPS Analysis by Country, 2023 to 2033

Figure 32: North America Market Y-o-Y Growth (%) Projections by Country, 2023 to 2033

Figure 33: North America Market Value (US$ Million) Analysis by Product, 2018 to 2033

Figure 34: North America Market Volume (Units) Analysis by Product, 2018 to 2033

Figure 35: North America Market Value Share (%) and BPS Analysis by Product, 2023 to 2033

Figure 36: North America Market Y-o-Y Growth (%) Projections by Product, 2023 to 2033

Figure 37: North America Market Value (US$ Million) Analysis by Application, 2018 to 2033

Figure 38: North America Market Volume (Units) Analysis by Application, 2018 to 2033

Figure 39: North America Market Value Share (%) and BPS Analysis by Application, 2023 to 2033

Figure 40: North America Market Y-o-Y Growth (%) Projections by Application, 2023 to 2033

Figure 41: North America Market Value (US$ Million) Analysis by  End User, 2018 to 2033

Figure 42: North America Market Volume (Units) Analysis by  End User, 2018 to 2033

Figure 43: North America Market Value Share (%) and BPS Analysis by  End User, 2023 to 2033

Figure 44: North America Market Y-o-Y Growth (%) Projections by  End User, 2023 to 2033

Figure 45: North America Market Attractiveness by Product, 2023 to 2033

Figure 46: North America Market Attractiveness by Application, 2023 to 2033

Figure 47: North America Market Attractiveness by  End User, 2023 to 2033

Figure 48: North America Market Attractiveness by Country, 2023 to 2033

Figure 49: Latin America Market Value (US$ Million) by Product, 2023 to 2033

Figure 50: Latin America Market Value (US$ Million) by Application, 2023 to 2033

Figure 51: Latin America Market Value (US$ Million) by  End User, 2023 to 2033

Figure 52: Latin America Market Value (US$ Million) by Country, 2023 to 2033

Figure 53: Latin America Market Value (US$ Million) Analysis by Country, 2018 to 2033

Figure 54: Latin America Market Volume (Units) Analysis by Country, 2018 to 2033

Figure 55: Latin America Market Value Share (%) and BPS Analysis by Country, 2023 to 2033

Figure 56: Latin America Market Y-o-Y Growth (%) Projections by Country, 2023 to 2033

Figure 57: Latin America Market Value (US$ Million) Analysis by Product, 2018 to 2033

Figure 58: Latin America Market Volume (Units) Analysis by Product, 2018 to 2033

Figure 59: Latin America Market Value Share (%) and BPS Analysis by Product, 2023 to 2033

Figure 60: Latin America Market Y-o-Y Growth (%) Projections by Product, 2023 to 2033

Figure 61: Latin America Market Value (US$ Million) Analysis by Application, 2018 to 2033

Figure 62: Latin America Market Volume (Units) Analysis by Application, 2018 to 2033

Figure 63: Latin America Market Value Share (%) and BPS Analysis by Application, 2023 to 2033

Figure 64: Latin America Market Y-o-Y Growth (%) Projections by Application, 2023 to 2033

Figure 65: Latin America Market Value (US$ Million) Analysis by  End User, 2018 to 2033

Figure 66: Latin America Market Volume (Units) Analysis by  End User, 2018 to 2033

Figure 67: Latin America Market Value Share (%) and BPS Analysis by  End User, 2023 to 2033

Figure 68: Latin America Market Y-o-Y Growth (%) Projections by  End User, 2023 to 2033

Figure 69: Latin America Market Attractiveness by Product, 2023 to 2033

Figure 70: Latin America Market Attractiveness by Application, 2023 to 2033

Figure 71: Latin America Market Attractiveness by  End User, 2023 to 2033

Figure 72: Latin America Market Attractiveness by Country, 2023 to 2033

Figure 73: Europe Market Value (US$ Million) by Product, 2023 to 2033

Figure 74: Europe Market Value (US$ Million) by Application, 2023 to 2033

Figure 75: Europe Market Value (US$ Million) by  End User, 2023 to 2033

Figure 76: Europe Market Value (US$ Million) by Country, 2023 to 2033

Figure 77: Europe Market Value (US$ Million) Analysis by Country, 2018 to 2033

Figure 78: Europe Market Volume (Units) Analysis by Country, 2018 to 2033

Figure 79: Europe Market Value Share (%) and BPS Analysis by Country, 2023 to 2033

Figure 80: Europe Market Y-o-Y Growth (%) Projections by Country, 2023 to 2033

Figure 81: Europe Market Value (US$ Million) Analysis by Product, 2018 to 2033

Figure 82: Europe Market Volume (Units) Analysis by Product, 2018 to 2033

Figure 83: Europe Market Value Share (%) and BPS Analysis by Product, 2023 to 2033

Figure 84: Europe Market Y-o-Y Growth (%) Projections by Product, 2023 to 2033

Figure 85: Europe Market Value (US$ Million) Analysis by Application, 2018 to 2033

Figure 86: Europe Market Volume (Units) Analysis by Application, 2018 to 2033

Figure 87: Europe Market Value Share (%) and BPS Analysis by Application, 2023 to 2033

Figure 88: Europe Market Y-o-Y Growth (%) Projections by Application, 2023 to 2033

Figure 89: Europe Market Value (US$ Million) Analysis by  End User, 2018 to 2033

Figure 90: Europe Market Volume (Units) Analysis by  End User, 2018 to 2033

Figure 91: Europe Market Value Share (%) and BPS Analysis by  End User, 2023 to 2033

Figure 92: Europe Market Y-o-Y Growth (%) Projections by  End User, 2023 to 2033

Figure 93: Europe Market Attractiveness by Product, 2023 to 2033

Figure 94: Europe Market Attractiveness by Application, 2023 to 2033

Figure 95: Europe Market Attractiveness by  End User, 2023 to 2033

Figure 96: Europe Market Attractiveness by Country, 2023 to 2033

Figure 97: Asia Pacific Market Value (US$ Million) by Product, 2023 to 2033

Figure 98: Asia Pacific Market Value (US$ Million) by Application, 2023 to 2033

Figure 99: Asia Pacific Market Value (US$ Million) by  End User, 2023 to 2033

Figure 100: Asia Pacific Market Value (US$ Million) by Country, 2023 to 2033

Figure 101: Asia Pacific Market Value (US$ Million) Analysis by Country, 2018 to 2033

Figure 102: Asia Pacific Market Volume (Units) Analysis by Country, 2018 to 2033

Figure 103: Asia Pacific Market Value Share (%) and BPS Analysis by Country, 2023 to 2033

Figure 104: Asia Pacific Market Y-o-Y Growth (%) Projections by Country, 2023 to 2033

Figure 105: Asia Pacific Market Value (US$ Million) Analysis by Product, 2018 to 2033

Figure 106: Asia Pacific Market Volume (Units) Analysis by Product, 2018 to 2033

Figure 107: Asia Pacific Market Value Share (%) and BPS Analysis by Product, 2023 to 2033

Figure 108: Asia Pacific Market Y-o-Y Growth (%) Projections by Product, 2023 to 2033

Figure 109: Asia Pacific Market Value (US$ Million) Analysis by Application, 2018 to 2033

Figure 110: Asia Pacific Market Volume (Units) Analysis by Application, 2018 to 2033

Figure 111: Asia Pacific Market Value Share (%) and BPS Analysis by Application, 2023 to 2033

Figure 112: Asia Pacific Market Y-o-Y Growth (%) Projections by Application, 2023 to 2033

Figure 113: Asia Pacific Market Value (US$ Million) Analysis by  End User, 2018 to 2033

Figure 114: Asia Pacific Market Volume (Units) Analysis by  End User, 2018 to 2033

Figure 115: Asia Pacific Market Value Share (%) and BPS Analysis by  End User, 2023 to 2033

Figure 116: Asia Pacific Market Y-o-Y Growth (%) Projections by  End User, 2023 to 2033

Figure 117: Asia Pacific Market Attractiveness by Product, 2023 to 2033

Figure 118: Asia Pacific Market Attractiveness by Application, 2023 to 2033

Figure 119: Asia Pacific Market Attractiveness by  End User, 2023 to 2033

Figure 120: Asia Pacific Market Attractiveness by Country, 2023 to 2033

Figure 121: MEA Market Value (US$ Million) by Product, 2023 to 2033

Figure 122: MEA Market Value (US$ Million) by Application, 2023 to 2033

Figure 123: MEA Market Value (US$ Million) by  End User, 2023 to 2033

Figure 124: MEA Market Value (US$ Million) by Country, 2023 to 2033

Figure 125: MEA Market Value (US$ Million) Analysis by Country, 2018 to 2033

Figure 126: MEA Market Volume (Units) Analysis by Country, 2018 to 2033

Figure 127: MEA Market Value Share (%) and BPS Analysis by Country, 2023 to 2033

Figure 128: MEA Market Y-o-Y Growth (%) Projections by Country, 2023 to 2033

Figure 129: MEA Market Value (US$ Million) Analysis by Product, 2018 to 2033

Figure 130: MEA Market Volume (Units) Analysis by Product, 2018 to 2033

Figure 131: MEA Market Value Share (%) and BPS Analysis by Product, 2023 to 2033

Figure 132: MEA Market Y-o-Y Growth (%) Projections by Product, 2023 to 2033

Figure 133: MEA Market Value (US$ Million) Analysis by Application, 2018 to 2033

Figure 134: MEA Market Volume (Units) Analysis by Application, 2018 to 2033

Figure 135: MEA Market Value Share (%) and BPS Analysis by Application, 2023 to 2033

Figure 136: MEA Market Y-o-Y Growth (%) Projections by Application, 2023 to 2033

Figure 137: MEA Market Value (US$ Million) Analysis by  End User, 2018 to 2033

Figure 138: MEA Market Volume (Units) Analysis by  End User, 2018 to 2033

Figure 139: MEA Market Value Share (%) and BPS Analysis by  End User, 2023 to 2033

Figure 140: MEA Market Y-o-Y Growth (%) Projections by  End User, 2023 to 2033

Figure 141: MEA Market Attractiveness by Product, 2023 to 2033

Figure 142: MEA Market Attractiveness by Application, 2023 to 2033

Figure 143: MEA Market Attractiveness by  End User, 2023 to 2033

Figure 144: MEA Market Attractiveness by Country, 2023 to 2033

Recommendations

Healthcare

DNA/RNA Extraction Market

Published : June 2023

Healthcare

Respiratory Pathogen Testing Kits Market

Published : March 2023

Explore Healthcare Insights

View Reports