Nucleic Acid Extraction Kit Market Size and Share Forecast Outlook From 2024 to 2034

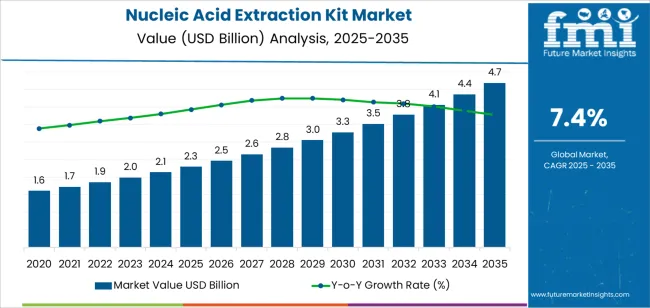
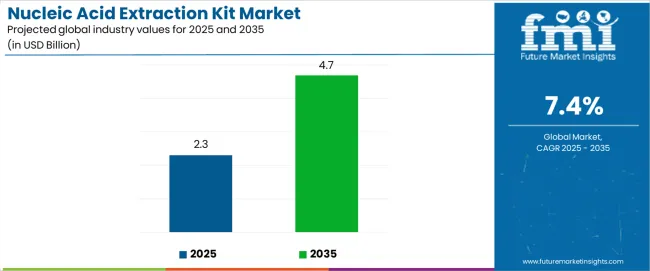
Exhibiting a Y-o-Y growth of 8.1%, the global nucleic acid extraction kit market size is projected to reach USD 2,134.40 million in 2024. It will likely register rapid growth, with global nucleic acid extraction kit demand rising at a CAGR of 7.4%. By 2034, the global market valuation is set to total USD 4,285.08 million.

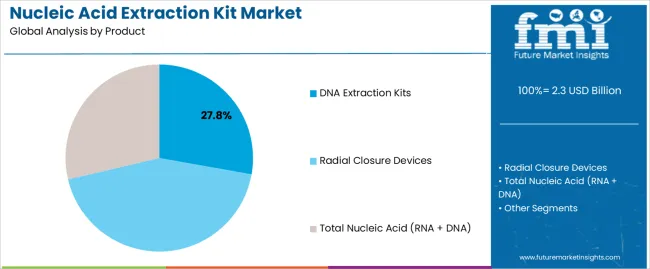
DNA extraction kits remain highly sought-after products because of their rising usage in applications like genetic testing and disease diagnostics. As per the latest analysis, the target segment is estimated to account for a value share of 49.1% in 2024.

The adoption of nucleic acid kits is revolutionizing disease diagnosis globally. This is due to their ability to detect pathogens and genetic abnormalities rapidly and specifically. As a result, the target market is set to expand 2.0X through 2034.

Nucleic Acid Extraction Kit Market Insights:

Attributes Key Insights
Base Market Value (2023) USD 1,974.90 million
Estimated Nucleic Acid Extraction Kit Market Value (2024) USD 2,134.40 million
Projected Nucleic Acid Extraction Kit Market Revenue (2034) USD 4,285.08 million
Value CAGR (2024 to 2034) 7.4%

Nucleic Acid Extraction Kit Market Overview

  • Nucleic acid extraction (NAE) has become a critical step in molecular biology. It is used in many areas of the biological and medical sciences. Rising importance of this process in molecular diagnostics and other applications is putting the nucleic acid extraction kit market into the spotlight.
  • Nucleic acid extraction kits make it simple to extract genome, plasmid, and RNA from samples. They help in obtaining biological information in fields ranging from specimen identification for conservation to personalized medicine and pharmacogenomics.
  • Growing adoption of nucleic acid extraction kits in molecular biology research is expected to boost sales. These kits have become essential for techniques like next-generation sequencing (NSG), polymerase chain reaction (PCR), and sanger sequencing.

Top Factors Driving Growth of the Nucleic Acid Extraction Kit Market

  • Rising prevalence of chronic and infectious diseases, coupled with growing demand for molecular diagnostics
  • Growing emphasis on early and precise diagnosis for better disease management
  • Increasing importance of nucleic acid extraction in pharmaceutical and biotechnology sector for applications like drug discovery and genetic engineering
  • Expanding usage of nucleic acid extraction kits in diagnostic centers and hospitals for routine testing as well as specialized testing like cancer diagnosis and genetic testing
  • Increasing awareness of genetic diseases, especially across developing nations like India and China
  • Rising investments in cancer research
  • Growing usage of nucleic acid extraction kits in forensic analysis and environmental monitoring
  • Surging demand for genetic material processing kits

Global Nucleic Acid Extraction Kit Market Trends

  • Increasing adoption of automation in nucleic acid extraction
  • Rising demand for personalized medicine
  • Growing interest in preventive healthcare
  • Ongoing technological advancements in nucleic acid extraction kits, including miniaturization and automation
  • Surging popularity of point-of-care (POCT) testing, along with rising demand for POCT devices that rely on nucleic acid extraction

Comparison of Historical vs Future Outlook for the Nucleic Acid Extraction Kit Market

Global sales of nucleic acid extraction kits recorded a CAGR of 6.1% from 2019 to 2023. The nucleic acid extraction kit market accounted for around 16.3% of the global molecular diagnostics kit market, valued at USD 11,134.3 million.

Over the forecast period, the global nucleic acid extraction kit industry is set to expand at 7.1% CAGR. It will likely total a valuation of USD 4,285.08 million by 2034, driven by factors like rising prevalence of chronic disease and growing demand for molecular diagnostics.

  • The rising incidence of cancer globally is resulting in the need for advanced RNA and DNA extraction kits. This, in turn, is expected to drive growth of the nucleic acid extraction kit market in the upcoming years.
  • RNA and DNA extraction plays an important role in cancer genetic research. It involves mutation analysis, comparative genomic hybridization, and microsatellite analysis. Thus, rising cancer cases globally and increasing investment in cancer research will likely uplift nucleic acid extraction kit demand.
  • In medical settings, there is an increasing need to handle larger amounts of plasma efficiently to reduce costs and produce concentrated samples for subsequent diagnostic analyses like NSG. This will likely boost sales of nucleic acid extraction kits through 2034.
  • The development of tailored small molecule and antibody-based medicines has accelerated the adoption of genomic tests in cancer patients. By identifying individual targetable mutations, genomic approaches can estimate mutational burden. This can be used to predict therapeutic response to immune-checkpoint inhibitors or to identify cancer-specific proteins to create tailored anticancer vaccines.
  • Growing demand for genetic material extraction kits is anticipated to foster growth of the nucleic acid extraction kit market through 2034. Similarly, high adoption of nucleic acid isolation kits in medical applications will support market expansion.

Insights into Opportunities in the Nucleic Acid Extraction Kit Market

In the past few years, government agencies in the Asia-Pacific and Middle East regions have effectively motivated manufacturers to contribute to the expansion of the healthcare and biopharmacy sectors. Major companies have the opportunity to capitalize on this encouragement to enhance their standing in the market.

Countries in the Asia-Pacific region, particularly developing ones like India, have removed export restrictions on diagnostic kits and reagents. This includes equipment like nucleic acid extraction kits and systems used for detecting coronavirus infections.

Analysis of Top Countries Involved in Producing, Distributing, and Using Nucleic Acid Extraction Kits

The below table shows the estimated growth rates of the top countries. China, India, and the United Kingdom are set to record higher CAGRs of 13.0%, 8.5%, and 8.6% respectively, through 2034.

Market Growth Outlook by Key Countries

Countries Projected Nucleic Acid Extraction Kit Market CAGR
United States 4.1%
Germany 6.0%
United Kingdom 8.6%
Japan 7.9%
China 13.0%
India 8.5%

Rising Demand for Personalized Medicine Boosting the United States Market

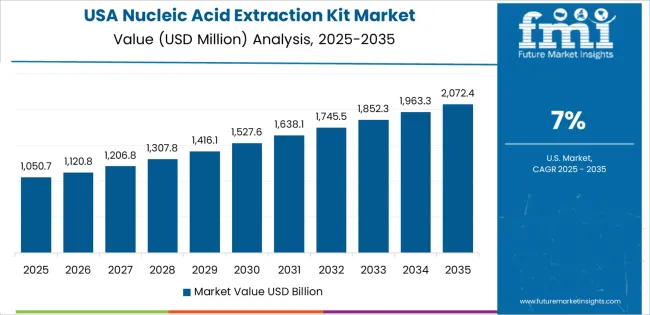
The United States nucleic acid extraction kit market is estimated to be valued at USD 634.06 million in 2024. It will likely exhibit steady growth, with overall demand for nucleic acid extraction kits rising at 4.1% CAGR through 2034. This can be attributed to factors like:

  • Rising cases of diabetes, cancer, and other chronic diseases
  • Increasing investments in life science research, including genome projects
  • Surging popularity of personalized medicine
  • High adoption of automated nucleic acid extraction systems
  • Growing importance of nucleic acid extraction in thriving pharmaceutical and biopharmaceutical industries
  • Integration of nucleic acid extraction with molecular diagnostic technologies like sequencing and PCR

The United States is a frontrunner in the nucleic acid extraction kit market due to several factors. Firstly, the nation boasts a robust research infrastructure with well-established laboratories and academic institutions that conduct extensive genomic research.

Institutions such as the National Institutes of Health (NIH) and leading universities contribute significantly to the demand for nucleic acid extraction kits. Similarly, rising trend of personalized medicine will likely propel nucleic acid extraction kits demand in the nation.

The United States has a well-established healthcare system that emphasizes precision medicine and personalized treatments. This will continue to create a steady demand for nucleic acid extraction kits in clinical diagnostics and research.

China to Become a Happy Hunting Ground for Manufacturers

China is anticipated to emerge as the hotbed for nucleic acid extraction kit manufacturers during the forecast period. The latest report predicts China nucleic acid extraction kit market to thrive at 13.0% CAGR during the forecast period. Some of the key drivers/trends include:

  • Growing incidence of chronic and infectious diseases
  • Rising investments in research and development across fields like molecular diagnostics
  • Increasing government support for the healthcare and medical devices industries

China's expansion in the nucleic acid extraction kit market is notable, driven by advancements in biotechnology and molecular diagnostics. The country's robust investment in research and development, coupled with a burgeoning healthcare sector, is propelling demand for nucleic acid extraction kits.

Growing awareness and adoption of molecular testing techniques in various applications, including academic research and clinical diagnostics, contribute to rapid market growth. Subsequently, development of innovative nucleic acid kits is set to support market expansion.

Expanding Healthcare Industry Influencing Sales in India

Sales of nucleic acid extraction kits in India are poised to grow at a CAGR of 8.5% throughout the forecast period. Accordingly, the nucleic acid extraction kit market in India is estimated to be valued at USD 102.05 million, driven by factors like:

  • Expanding healthcare industries, coupled with growing health awareness
  • Rising prevalence of genetic disorders and cancer
  • Growing demand for genomic DNA extraction kits
  • Increasing government investments in improving healthcare infrastructure and promoting research activities
  • Growing emphasis on preventive healthcare

India is making significant strides in the nucleic acid extraction kit market, showcasing positive growth trends. The nation's advancements in biotechnology and molecular research are contributing to a notable improvement in this sector.

Increasing investment in research and development, coupled with a growing emphasis on healthcare infrastructure, are set to boost market growth in India. The nation is poised to make valuable contributions to the field, reflecting its commitment to advancing biotechnological capabilities and fostering innovation in nucleic acid extraction technologies.

Nucleic Acid Extraction Kit Industry Analysis by Top Investment Segments

The table section offers detailed insights into top segments in the nucleic acid extraction kit industry. This information will likely allow players to frame their strategies accordingly to boost revenue and stay ahead of the competition.

  • The DNA extraction kits segment is expected to account for a prominent revenue share of 49.1% in 2024.
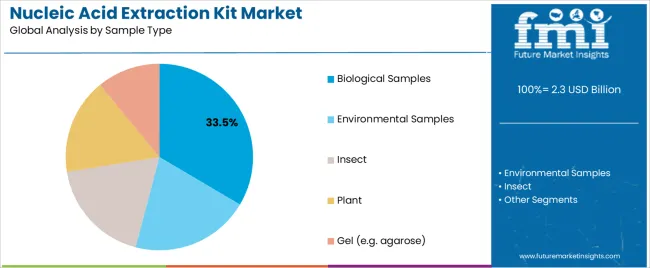
  • By sample type, the biological samples category will likely hold a market share of 45.2% in 2024.
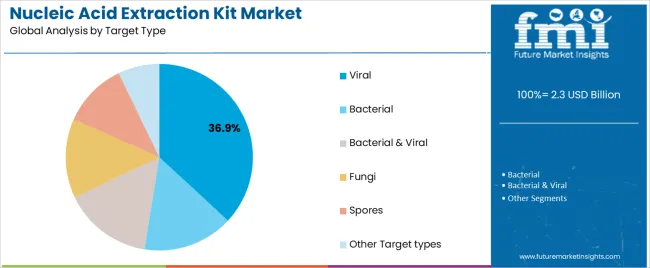
  • Based on target type, the bacterial segment is poised to account for a value share of 31.5% in 2024.
  • By format, the 96-well plate segment will likely total USD 808.19 million in 2024.
  • Based on purpose, the research use only segment is anticipated to account for a value share of 65.3% in 2024
  • By application, the disease diagnosis segment is predicted to generate revenue worth USD 482.28 million by 2024.
  • In terms of end use, the diagnostic laboratories segment is forecast to have a market share of 24.4% in 2024.

Demand Remains High for DNA Extraction Kits in the Market

Market Growth Outlook by Key Products

Products Value CAGR
DNA Extraction Kits 6.2%
Radial Closure Devices 8.0%
Total Nucleic Acid (RNA + DNA) 9.6%

As per the latest analysis, the DNA extraction kits segment is expected to dominate the global market, holding a revenue share of 49.1% in 2024. Over the forecast period, demand for DNA extraction kits is set to increase at 6.2% CAGR.

  • DNA extraction kit demand is high because they save time, ensure reproducibility, and are user-friendly. These advantages are making them a preferred choice for scientists working on DNA-related applications.
  • DNA extraction kits offer a convenient and efficient way to isolate DNA from various samples. These kits provide ready-to-use reagents and simplified protocols, making the extraction process quicker and more accessible for researchers.
  • Rising importance of DNA analysis in applications like genetic testing, personalized medicine, and disease diagnostics will likely propel DNA extraction kit demand.
  • To gain maximum benefits, key players are focusing on developing new DNA extraction kits with enhanced efficiency, purity, and yield of extracted DNA.

Biological Samples Segment to Account for a Market Share of 45.2% in 2024

Market Growth Outlook by Key Samples

Sample Type Value CAGR
Biological Samples 5.4%
Environmental Samples 7.0%
Insect 9.8%
Plant 7.1%
Gel (e.g. agarose) 8.5%
PCR Clean-up (post-PCR amplification product extraction) 12.1%

Based on sample type, the biological samples segment is poised to grow at 5.4% CAGR during the assessment period. It will likely hold a market share of 45.2% in 2024.

  • Biological samples are prominent in the nucleic acid extraction kit market because they provide genetic material like DNA or RNA for analysis. These samples, often from tissues or cells, are crucial for understanding diseases and developing treatments.
  • Growing adoption of biological samples in routine clinical care for diagnosis, prognosis, and monitoring is expected to boost the target segment.
  • Researchers often use biological samples to extract genetic material efficiently, aiding in various applications such as diagnostics and research.

Bacterial Segment Set to Take a Bigger Piece of Pie

Market Growth Outlook by Key Target Type

Target Type Value CAGR
Bacterial 5.6%
Viral 7.0%
Bacterial & Viral 7.9%
Fungi 8.6%
Spores 9.8%
Other Target types 10.7%

The bacterial segment is expected to retain its market dominance, holding a market share of 31.5% in 2024. Further, it will likely record a CAGR of 5.6% throughout the assessment period.

  • Extracting genetic material (nucleic acids) from bacteria helps scientists study and understand them better. This is essential for tasks like diagnosing diseases, developing treatments, and advancing scientific knowledge.
  • Rising need for bacterial nucleic acid extraction in microbiology and molecular biology is expected to foster segment growth.
  • Increasing incidence of bacterial infections is creating a higher demand for diagnostic tools that require reliable bacterial DNA extraction. This will further boost the target segment.

96-well Plate Becoming Popular Format

Market Growth Outlook by Key Format

Format Value CAGR
Columns 9.5%
96-Well Plate 5.4%
Magnetic Beads (Automatable) 7.1%
Other Format 10.0%

Based on format, the 96-well plate segment is set to lead the global market, with a share of 37.9% in 2024. It will also exhibit a CAGR of 5.4% between 2024 and 2034.

  • Rising usage of 96-well plates for nucleic acid extraction due to advantages like increased throughput and cost-effectiveness is driving segment growth.
  • 96 well plate wells significantly increase the throughput and save time and resources. Researchers can extract DNA or RNA from many samples in one go, making the process more streamlined and cost-effective.
  • The 96-well plate format is widely adopted for its convenience and effectiveness in high-throughput applications, contributing to its leading position in the market.
  • 96-well plates are becoming ideal for large-scale studies like drug discovery, genomic research, and clinical diagnostics. This is because these high-scale studies often involve analyzing numerous samples.
  • Development of novel 96-well culture plates by companies like Thermo Fisher Scientific will likely boost segment growth.

Usage of Nucleic Acid Extraction Kits Remains High for Research Purposes

Market Growth Outlook by Key Purpose

Purpose Value CAGR
Research Use Only (RUO) 6.4%
Clinical Use 9.2%

As per the latest report, nucleic acid extraction kit consumption remains high in research projects. The target segment will likely grow at 6.4% CAGR during the forecast period, holding a value share of 65.3% in 2024.

  • Research use only (RUO) is set to dominate the nucleic acid extraction kit market through 2034. This is because these kits are primarily designed and intended for research purposes.
  • Nucleic extraction kits provide scientists and researchers with reliable tools to extract genetic material like DNA and RNA from samples. As a result, they are witnessing higher demand from the research sector.
  • As the demand for genetic research and studies increases, sales of products like nucleic acid extraction kits will grow significantly. This, in turn, is expected to foster segment growth during the forecast period.

Disease Diagnosis Remains the Most Remunerative Application

Market Growth Outlook by Key Application

Application Value CAGR
Disease Diagnosis 4.6%
Drug Diagnosis 6.4%
Cancer Research 7.1%
cDNA library 7.8%
Environmental DNA (eDNA) Studies 8.7%
Food Safety Testing 9.7%
GMO Detection 10.0%
Other Applications 11.0%
Disease Diagnosis 4.6%

Based on application, the disease diagnosis segment is projected to generate significant revenue for the market. As per the latest analysis, the target segment will likely progress at 4.6% CAGR during the forecast period, totaling revenue worth USD 482.28 million in 2024.

  • Nucleic acid extraction kits are mostly used in disease diagnosis applications. They help in extracting genetic material from samples, like blood or saliva. This genetic material contains information about diseases, allowing doctors to identify and diagnose illnesses.
  • Growing prevalence of chronic diseases is expected to boost growth of the target segment. This is because nucleic acid extraction kits are often used to monitor disease progression and develop targeted therapies.
  • Rising focus on early and precise diagnosis for effective disease management will likely uplift nucleic acid extraction kit demand through 2034.

Diagnostic Laboratories Remain Leading End Users

Market Growth Outlook by Key End User

End User Value CAGR
Hospitals 5.4%
Academic & Research Institutes 9.4%
Pharmaceutical & Biotechnology Companies 8.4%
Clinical Research Organizations 6.4%
Diagnostic Laboratories 4.6%
Forensic Labs 10.5%
Food Testing Laboratories 10.1%
Agricultural and Environmental Research Institutes 12.3%

Diagnostic laboratories are expected to remain leading end users of nucleic acid extraction kits during the forecast period. The target segment will likely exhibit a 4.6% CAGR, holding a market share of 24.4% in 2024.

  • Diagnostic laboratories are at the forefront of the nucleic acid extraction kit industry. This is because they heavily rely on these kits for extracting genetic material, like DNA or RNA.
  • Diagnostic labs play a crucial role in medical testing and diagnostics. They often seek advanced nucleic acid extraction kits for advancing diagnostic technologies like real-time PCR to ensure accurate and efficient results.
  • The demand for accurate and reliable nucleic acid extraction is high in diagnostic processes. This is making these kits essential for identifying diseases and conditions.

Competitive Landscape of the Nucleic Acid Extraction Kit Market

Key manufacturers of nucleic acid extraction kits are increasingly investing in research and development to advance in nucleic acid extraction technology. They are continuously introducing new kits and other solutions, as well as implementing strategies acquisitions, mergers, and partnerships to stay ahead of the competition.

Recent Developments in the Nucleic Acid Extraction Kit Market

  • In December 2023, PerkinElmer acquired Covaris, a leading producer of technologies that enable advancements in life science.
  • In 2020, GeneProof introduced the new Geneproof Universal Nucleic Acid Extraction Kit. The new kit is designed for the extraction of bacterial, viral, and human RNA and DNA from one sample at the same time.
  • In April 2023, the new Cell Nucleic Acid Extraction Kit and Automated Nucleic Acid Extraction Workstation SAW-14 were launched by BioPerfectus.
  • In March 2021, a real-time reverse transcription PCR (qRT-PCR) kit registered with CE-IVD was introduced by Agilent Technologies to detect SARS-CoV-2 RNA.

Key Coverage in the Global Nucleic Acid Extraction Kit Market Report

  • Adjacent Study on Global Extraction Kits Market, Nucleic Acid Sample Preparation Kit Market, DNA Sequencing Services Market, and Cell-free Fetal DNA Testing Market
  • Global Extraction Kits Market Analysis
  • Top Manufacturers of Molecular Biology Kits
  • Expected DNA/RNA Extraction Market Size
  • Factors Propelling Nucleic Acid Extraction System Market Growth
  • Detailed Molecular Biology Kit Industry Overview
  • Most Popular Biomedical Extraction Kits in the Market
  • Ongoing Innovation in Molecular Biology Reagents
  • Top Selling Nucleic Acid Purification Kits
  • Impact of Global Infectious Disease Burden on Viral Nucleic Acid Isolation Kit Sales
  • Latest Advancements in Nucleic Acid Extraction Techniques
  • Prices of Commonly Used Products like Qiagen’s DNA Extraction Kits

Scope and Coverage of the Nucleic Acid Extraction Kit Market Report

Attribute Details
Estimated Market Value (2024) USD 2,134.40 million
Projected Market Size (2034) USD 4,285.08 million
Expected Growth Rate (2024 to 2034) 7.4% CAGR
Forecast Period 2024 to 2034
Historical Data Available for 2019 to 2023
Market Analysis USD Million for Value
Key Regions Covered North America; Latin America; East Asia; South Asia & Pacific; Western Europe; Eastern Europe; and Middle East & Africa
Key Countries Covered United States, Canada, Mexico, Brazil, Chile, China, Japan, South Korea, India, ASEAN Countries, Australia & New Zealand, Germany, Italy, France, United Kingdom, Spain, BENELUX, Nordic Countries, Russia, Hungary, Poland, Saudi Arabia, Türkiye, South Africa, Other African Union.
Key Market Segments Covered Product Type, Sample Type, Target Type, Format, Purpose, Application, End User, and Region
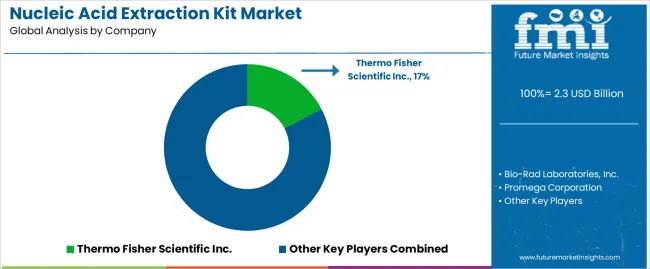
Key Companies Profiled Bio-Rad Laboratories, Inc.; Thermo Fisher Scientific Inc.; Promega Corporation; Agilent Technologies, Inc.; Merck KGaA; Bioneer Corporation; PerkinElmer Inc.; LGC Biosearch Technologies; QIAGEN; GeneBio Systems, Inc.; Takara Bio Inc.; F. Hoffmann-La Roche Ltd; GeneReach Biotechnology Corp.; Akonni Biosystems, Inc.; Primerdesign Ltd; ProtonDx; GVS S.p.A.; TRIVITRON HEALTHCARE PVT. LTD.; Almanac Life Science India; New England Biolabs.; RBC Bioscience Corp.; Zymo Research Corporation.; Omega Bio-tek, Inc.; Molzym GmbH & Co. KG
Report Coverage Market Forecast, Competition Intelligence, DROT Analysis, Market Dynamics and Challenges, Strategic Growth Initiatives

Top Segments Studied in the Nucleic Acid Extraction Kit Market

By Product:

  • DNA Extraction Kits
    • Sequence-specific DNA
    • Cell-free DNA (cfDNA)
    • Tissue DNA Extraction Kits
  • Radial Closure Devices
    • Total RNA
    • Purified RNAs
    • Viral RNA
    • Sequence-specific RNA
  • Total Nucleic Acid (RNA + DNA)

By Sample Type:

  • Biological Samples
    • Cell-free, or nearly cell-free
      • Swab samples
        • Nasal
        • Throat
        • Nasopharyngeal
        • Buccal
        • Oral
      • Saliva
      • Urine
      • Serum
      • Plasma
      • Cerebrospinal fluid (CSF)
    • Tissue
      • Organ (e.g. lung, liver, heart, etc.)
      • Bone
      • Cartilage
      • Skin
      • Tumor biopsy
    • Blood
      • Whole blood
      • RBC (red blood cells)
      • Plasma
      • Serum
      • Dried blood spots
    • Sputum
    • Stool/fecal matter
    • Cells
    • Paraffin embedded tissue
  • Environmental samples
    • Soil
    • Water/wastewater
  • Insect
  • Plant
  • Gel (e.g. agarose)
  • PCR Clean-up (post-PCR amplification product extraction)
  • Other sample types

By Target Type:

  • Bacterial
  • Viral
  • Bacterial & Viral
  • Fungi
  • Spores
  • Other Target types

By Format:

  • Columns
  • 96-Well Plate
  • Magnetic Beads (Automatable)
  • Other Format

By Purpose:

  • Research Use Only (RUO)
  • Clinical Use

By Application:

  • Disease Diagnosis
  • Drug Diagnosis
  • Cancer Research
  • cDNA library
  • Environmental DNA (eDNA) Studies
  • Food Safety Testing
  • GMO Detection
  • Other Applications

By End User:

  • Hospitals
  • Academic & Research Institutes
  • Pharmaceutical & Biotechnology Companies
  • Clinical Research Organizations
  • Diagnostic Laboratories
  • Forensic Labs
  • Food Testing Laboratories
  • Agricultural and Environmental Research Institutes

By Region:

  • North America
  • Latin America
  • East Asia
  • South Asia & Pacific
  • Western Europe
  • Eastern Europe
  • Middle East & Africa

Table of Content

  • 1. Executive Summary
  • 2. Market Overview
  • 3. Key Market Trends
  • 4. Value-Added Insights
  • 5. Market Background
  • 6. Global Market Demand (in Volume Units) Analysis 2019 to 2023 and Forecast, 2024 to 2034
  • 7. Global Market - Pricing Assessment
  • 8. Global Market Demand (in Value or Size in USD million) Analysis 2019 to 2023 and Forecast, 2024 to 2034
  • 9. Global Market Analysis 2019 to 2023 and Forecast 2024 to 2034, By Product
    • 9.1. DNA extraction Kits
      • 9.1.1. Sequence-specific DNA
      • 9.1.2. Cell-free DNA (cfDNA)
      • 9.1.3. Tissue DNA Extraction Kits
    • 9.2. RNA extraction Kits
      • 9.2.1. Total RNA
      • 9.2.2. Purified RNAs
      • 9.2.3. Viral RNA
      • 9.2.4. Sequence-specific RNA
    • 9.3. Total nucleic acid (RNA + DNA)
  • 10. Global Market Analysis 2019 to 2023 and Forecast 2024 to 2034, By Sample Type
    • 10.1. Biological Samples
      • 10.1.1. Cell-free, or nearly cell-free
        • 10.1.1.1. Swab samples
          • 10.1.1.1.1. Nasal
          • 10.1.1.1.2. Throat
          • 10.1.1.1.3. Nasopharyngeal
          • 10.1.1.1.4. Buccal
          • 10.1.1.1.5. Oral
        • 10.1.1.2. Saliva
        • 10.1.1.3. Urine
        • 10.1.1.4. Serum
        • 10.1.1.5. Plasma
        • 10.1.1.6. Cerebrospinal fluid (CSF)
      • 10.1.2. Tissue
        • 10.1.2.1. Organ (e.g. lung, liver, heart, etc.)
        • 10.1.2.2. Bone
        • 10.1.2.3. Cartilage
        • 10.1.2.4. Skin
        • 10.1.2.5. Tumour biopsy
      • 10.1.3. Blood
        • 10.1.3.1. Whole blood
        • 10.1.3.2. RBC (red blood cells)
        • 10.1.3.3. Plasma
        • 10.1.3.4. Serum
        • 10.1.3.5. Dried blood spots
      • 10.1.4. Sputum
      • 10.1.5. Stool/fecal matter
      • 10.1.6. Cells
      • 10.1.7. Paraffin embedded tissue
    • 10.2. Environmental samples
      • 10.2.1. Soil
      • 10.2.2. Water/wastewater
    • 10.3. Insect
    • 10.4. Plant
    • 10.5. Gel (e.g. agarose)
    • 10.6. PCR Clean-up (post-PCR amplification product extraction)
    • 10.7. Other sample types
  • 11. Global Market Analysis 2019 to 2023 and Forecast 2024 to 2034, By Target Type
    • 11.1. Bacterial
    • 11.2. Viral
    • 11.3. Bacterial & Viral
    • 11.4. Fungi
    • 11.5. Spores
    • 11.6. Other
  • 12. Global Market Analysis 2019 to 2023 and Forecast 2024 to 2034, By Format
    • 12.1. Columns
    • 12.2. 96-Well Plate
    • 12.3. Magnetic Beads (Automatable)
    • 12.4. Other Format
  • 13. Global Market Analysis 2019 to 2023 and Forecast 2024 to 2034, By Purpose
    • 13.1. Research Use Only (RUO)
    • 13.2. Clinical Use
  • 14. Global Market Analysis 2019 to 2023 and Forecast 2024 to 2034, By Application
    • 14.1. Disease Diagnosis
    • 14.2. Drug Diagnosis
    • 14.3. Cancer Research
    • 14.4. cDNA library
    • 14.5. Environmental DNA (eDNA) Studies
    • 14.6. Food Safety Testing
    • 14.7. GMO Detection
    • 14.8. Other Applications
  • 15. Global Market Analysis 2019 to 2023 and Forecast 2024 to 2034, By End User
    • 15.1. Hospitals
    • 15.2. Academic & Research Institutes
    • 15.3. Pharmaceutical & Biotechnology Companies
    • 15.4. Clinical Research Organizations
    • 15.5. Diagnostic Laboratories
    • 15.6. Forensic Labs
    • 15.7. Food Testing Laboratories
    • 15.8. Agricultural and Environmental Research Institutes
  • 16. Global Market Analysis 2019 to 2023 and Forecast 2024 to 2034, By Region
    • 16.1. North America
    • 16.2. Latin America
    • 16.3. East Asia
    • 16.4. South Asia & Pacific
    • 16.5. Western Europe
    • 16.6. Eastern Europe
    • 16.7. Middle East & Africa
  • 17. North America Market Analysis 2019 to 2023 and Forecast 2024 to 2034
  • 18. Latin America Market Analysis 2019 to 2023 and Forecast 2024 to 2034
  • 19. East Asia Market Analysis 2019 to 2023 and Forecast 2024 to 2034
  • 20. South Asia & Pacific Market Analysis 2019 to 2023 and Forecast 2024 to 2034
  • 21. Western Europe Market Analysis 2019 to 2023 and Forecast 2024 to 2034
  • 22. Eastern Europe Market Analysis 2019 to 2023 and Forecast 2024 to 2034
  • 23. Middle East & Africa Market Analysis 2019 to 2023 and Forecast 2024 to 2034
  • 24. Market Structure Analysis
  • 25. Competition Analysis
    • 25.1. Bio-Rad Laboratories, Inc.
    • 25.2. Thermo Fisher Scientific Inc.
    • 25.3. Promega Corporation
    • 25.4. Agilent Technologies, Inc.
    • 25.5. Merck KGaA
    • 25.6. Bioneer Corporation
    • 25.7. PerkinElmer Inc.
    • 25.8. LGC Biosearch Technologies
    • 25.9. QIAGEN
    • 25.10. GeneBio Systems, Inc.
    • 25.11. Takara Bio Inc.
    • 25.12. F. Hoffmann-La Roche Ltd
    • 25.13. GeneReach Biotechnology Corp.
    • 25.14. Akonni Biosystems, Inc.
    • 25.15. Primerdesign Ltd
    • 25.16. ProtonDx
    • 25.17. GVS S.p.A.
    • 25.18. TRIVITRON HEALTHCARE PVT. LTD.
    • 25.19. Almanac Life Science India
    • 25.20. New England Biolabs.
    • 25.21. RBC Bioscience Corp.
    • 25.22. Zymo Research Corporation.
    • 25.23. Omega Bio-tek, Inc.
    • 25.24. Molzym GmbH & Co. KG
  • 26. Assumptions and Acronyms Used
  • 27. Research Methodology

List of Tables

Table 1: Global Market Size (US$ million) Analysis 2019 to 2023 and Forecast 2024 to 2034, By Product

Table 2: Global Market Size (US$ million) Analysis 2019 to 2023 and Forecast 2024 to 2034, By Sample Type

Table 3: Global Market Size (US$ million) Analysis 2019 to 2023 and Forecast 2024 to 2034, By Target Type

Table 4: Global Market Size (US$ million) Analysis 2019 to 2023 and Forecast 2024 to 2034, By Format

Table 5: Global Market Size (US$ million) Analysis 2019 to 2023 and Forecast 2024 to 2034, By Purpose

Table 5: Global Market Size (US$ million) Analysis 2019 to 2023 and Forecast 2024 to 2034, By Application

Table 5: Global Market Size (US$ million) Analysis 2019 to 2023 and Forecast 2024 to 2034, By End User

Table 6 : Global Market Size (US$ million) Analysis 2019 to 2023 and Forecast 2024 to 2034, By Region

Table 7: North America Market Size (US$ million) Analysis 2019 to 2023 and Forecast 2024 to 2034, By Country

Table 8: North America Market Size (US$ million) Analysis 2019 to 2023 and Forecast 2024 to 2034, By Product

Table 9: North America Market Size (US$ million) Analysis 2019 to 2023 and Forecast 2024 to 2034, By Sample Type

Table 10: North America Market Size (US$ million) Analysis 2019 to 2023 and Forecast 2024 to 2034, By Target Type

Table 11: North America Market Size (US$ million) Analysis 2019 to 2023 and Forecast 2024 to 2034, By Format

Table 12: North America Market Size (US$ million) Analysis 2019 to 2023 and Forecast 2024 to 2034, By Purpose

Table 13: North America Market Size (US$ million) Analysis 2019 to 2023 and Forecast 2024 to 2034, By Application

Table 14: North America Market Size (US$ million) Analysis 2019 to 2023 and Forecast 2024 to 2034, By End User

Table 15: United States Market Size (US$ million) Analysis 2019 to 2023 and Forecast 2024 to 2034, By Product

Table 16: United States Market Size (US$ million) Analysis 2019 to 2023 and Forecast 2024 to 2034, By Sample Type

Table 17: United States Market Size (US$ million) Analysis 2019 to 2023 and Forecast 2024 to 2034, By Target Type

Table 18: United States Market Size (US$ million) Analysis 2019 to 2023 and Forecast 2024 to 2034, By Format

Table 19: United States Market Size (US$ million) Analysis 2019 to 2023 and Forecast 2024 to 2034, By Purpose

Table 20: United States Market Size (US$ million) Analysis 2019 to 2023 and Forecast 2024 to 2034, By Application

Table 21: United States Market Size (US$ million) Analysis 2019 to 2023 and Forecast 2024 to 2034, By End User

Table 22: Canada Market Size (US$ million) Analysis 2019 to 2023 and Forecast 2024 to 2034, By Product

Table 23: Canada Market Size (US$ million) Analysis 2019 to 2023 and Forecast 2024 to 2034, By Sample Type

Table 24: Canada Market Size (US$ million) Analysis 2019 to 2023 and Forecast 2024 to 2034, By Target Type

Table 25: Canada Market Size (US$ million) Analysis 2019 to 2023 and Forecast 2024 to 2034, By Format

Table 26: Canada Market Size (US$ million) Analysis 2019 to 2023 and Forecast 2024 to 2034, By Purpose

Table 27: Canada Market Size (US$ million) Analysis 2019 to 2023 and Forecast 2024 to 2034, By Application

Table 28: Canada Market Size (US$ million) Analysis 2019 to 2023 and Forecast 2024 to 2034, By End User

Table 29: Mexico Market Size (US$ million) Analysis 2019 to 2023 and Forecast 2024 to 2034, By Product

Table 30: Mexico Market Size (US$ million) Analysis 2019 to 2023 and Forecast 2024 to 2034, By Sample Type

Table 31: Mexico Market Size (US$ million) Analysis 2019 to 2023 and Forecast 2024 to 2034, By Target Type

Table 32: Mexico Market Size (US$ million) Analysis 2019 to 2023 and Forecast 2024 to 2034, By Format

Table 33: Mexico Market Size (US$ million) Analysis 2019 to 2023 and Forecast 2024 to 2034, By Purpose

Table 34: Mexico Market Size (US$ million) Analysis 2019 to 2023 and Forecast 2024 to 2034, By Application

Table 35: Mexico Market Size (US$ million) Analysis 2019 to 2023 and Forecast 2024 to 2034, By End User

Table 36: Latin America Market Size (US$ million) Analysis 2019 to 2023 and Forecast 2024 to 2034, By Country

Table 37: Latin America Market Size (US$ million) Analysis 2019 to 2023 and Forecast 2024 to 2034, By Product

Table 38: Latin America Market Size (US$ million) Analysis 2019 to 2023 and Forecast 2024 to 2034, By Sample Type

Table 39: Latin America Market Size (US$ million) Analysis 2019 to 2023 and Forecast 2024 to 2034, By Target Type

Table 40: Latin America Market Size (US$ million) Analysis 2019 to 2023 and Forecast 2024 to 2034, By Format

Table 41: Latin America Market Size (US$ million) Analysis 2019 to 2023 and Forecast 2024 to 2034, By Purpose

Table 42: Latin America Market Size (US$ million) Analysis 2019 to 2023 and Forecast 2024 to 2034, By Application

Table 43: Latin America Market Size (US$ million) Analysis 2019 to 2023 and Forecast 2024 to 2034, By End User

Table 44: Brazil Market Size (US$ million) Analysis 2019 to 2023 and Forecast 2024 to 2034, By Product

Table 45: Brazil Market Size (US$ million) Analysis 2019 to 2023 and Forecast 2024 to 2034, By Sample Type

Table 46: Brazil Market Size (US$ million) Analysis 2019 to 2023 and Forecast 2024 to 2034, By Target Type

Table 47: Brazil Market Size (US$ million) Analysis 2019 to 2023 and Forecast 2024 to 2034, By Format

Table 48: Brazil Market Size (US$ million) Analysis 2019 to 2023 and Forecast 2024 to 2034, By Purpose

Table 49: Brazil Market Size (US$ million) Analysis 2019 to 2023 and Forecast 2024 to 2034, By Application

Table 50: Brazil Market Size (US$ million) Analysis 2019 to 2023 and Forecast 2024 to 2034, By End User

Table 51: Chile Market Size (US$ million) Analysis 2019 to 2023 and Forecast 2024 to 2034, By Product

Table 52: Chile Market Size (US$ million) Analysis 2019 to 2023 and Forecast 2024 to 2034, By Sample Type

Table 53: Chile Market Size (US$ million) Analysis 2019 to 2023 and Forecast 2024 to 2034, By Target Type

Table 54: Chile Market Size (US$ million) Analysis 2019 to 2023 and Forecast 2024 to 2034, By Format

Table 55: Chile Market Size (US$ million) Analysis 2019 to 2023 and Forecast 2024 to 2034, By Purpose

Table 56: Chile Market Size (US$ million) Analysis 2019 to 2023 and Forecast 2024 to 2034, By Application

Table 57: Chile Market Size (US$ million) Analysis 2019 to 2023 and Forecast 2024 to 2034, By End User

Table 58: East Asia Market Size (US$ million) Analysis 2019 to 2023 and Forecast 2024 to 2034, By Country

Table 59: East Asia Market Size (US$ million) Analysis 2019 to 2023 and Forecast 2024 to 2034, By Product

Table 60: East Asia Market Size (US$ million) Analysis 2019 to 2023 and Forecast 2024 to 2034, By Sample Type

Table 61: East Asia Market Size (US$ million) Analysis 2019 to 2023 and Forecast 2024 to 2034, By Target Type

Table 62: East Asia Market Size (US$ million) Analysis 2019 to 2023 and Forecast 2024 to 2034, By Format

Table 63: East Asia Market Size (US$ million) Analysis 2019 to 2023 and Forecast 2024 to 2034, By Purpose

Table 64: East Asia Market Size (US$ million) Analysis 2019 to 2023 and Forecast 2024 to 2034, By Application

Table 65: East Asia Market Size (US$ million) Analysis 2019 to 2023 and Forecast 2024 to 2034, By End User

Table 66: China Market Size (US$ million) Analysis 2019 to 2023 and Forecast 2024 to 2034, By Product

Table 67: China Market Size (US$ million) Analysis 2019 to 2023 and Forecast 2024 to 2034, By Sample Type

Table 68: China Market Size (US$ million) Analysis 2019 to 2023 and Forecast 2024 to 2034, By Target Type

Table 69: China Market Size (US$ million) Analysis 2019 to 2023 and Forecast 2024 to 2034, By Format

Table 70: China Market Size (US$ million) Analysis 2019 to 2023 and Forecast 2024 to 2034, By Purpose

Table 71: China Market Size (US$ million) Analysis 2019 to 2023 and Forecast 2024 to 2034, By Application

Table 72: China Market Size (US$ million) Analysis 2019 to 2023 and Forecast 2024 to 2034, By End User

Table 73: Japan Market Size (US$ million) Analysis 2019 to 2023 and Forecast 2024 to 2034, By Product

Table 74: Japan Market Size (US$ million) Analysis 2019 to 2023 and Forecast 2024 to 2034, By Sample Type

Table 75: Japan Market Size (US$ million) Analysis 2019 to 2023 and Forecast 2024 to 2034, By Target Type

Table 76: Japan Market Size (US$ million) Analysis 2019 to 2023 and Forecast 2024 to 2034, By Format

Table 77: Japan Market Size (US$ million) Analysis 2019 to 2023 and Forecast 2024 to 2034, By Purpose

Table 78: Japan Market Size (US$ million) Analysis 2019 to 2023 and Forecast 2024 to 2034, By Application

Table 79: Japan Market Size (US$ million) Analysis 2019 to 2023 and Forecast 2024 to 2034, By End User

Table 80: South Korea Market Size (US$ million) Analysis 2019 to 2023 and Forecast 2024 to 2034, By Product

Table 81: South Korea Market Size (US$ million) Analysis 2019 to 2023 and Forecast 2024 to 2034, By Sample Type

Table 82: South Korea Market Size (US$ million) Analysis 2019 to 2023 and Forecast 2024 to 2034, By Target Type

Table 83: South Korea Market Size (US$ million) Analysis 2019 to 2023 and Forecast 2024 to 2034, By Format

Table 84: South Korea Market Size (US$ million) Analysis 2019 to 2023 and Forecast 2024 to 2034, By Purpose

Table 85: South Korea Market Size (US$ million) Analysis 2019 to 2023 and Forecast 2024 to 2034, By Application

Table 86: South Korea Market Size (US$ million) Analysis 2019 to 2023 and Forecast 2024 to 2034, By End User

Table 87: South Asia & Pacific Market Size (US$ million) Analysis 2019 to 2023 and Forecast 2024 to 2034, By Country

Table 88: South Asia & Pacific Market Size (US$ million) Analysis 2019 to 2023 and Forecast 2024 to 2034, By Product

Table 89: South Asia & Pacific Market Size (US$ million) Analysis 2019 to 2023 and Forecast 2024 to 2034, By Sample Type

Table 90: South Asia & Pacific Market Size (US$ million) Analysis 2019 to 2023 and Forecast 2024 to 2034, By Target Type

Table 91: South Asia & Pacific Market Size (US$ million) Analysis 2019 to 2023 and Forecast 2024 to 2034, By Format

Table 92: South Asia & Pacific Market Size (US$ million) Analysis 2019 to 2023 and Forecast 2024 to 2034, By Purpose

Table 93: South Asia & Pacific Market Size (US$ million) Analysis 2019 to 2023 and Forecast 2024 to 2034, By Application

Table 94: South Asia & Pacific Market Size (US$ million) Analysis 2019 to 2023 and Forecast 2024 to 2034, By End User

Table 95: India Market Size (US$ million) Analysis 2019 to 2023 and Forecast 2024 to 2034, By Product

Table 96: India Market Size (US$ million) Analysis 2019 to 2023 and Forecast 2024 to 2034, By Sample Type

Table 97: India Market Size (US$ million) Analysis 2019 to 2023 and Forecast 2024 to 2034, By Target Type

Table 98: India Market Size (US$ million) Analysis 2019 to 2023 and Forecast 2024 to 2034, By Format

Table 99: India Market Size (US$ million) Analysis 2019 to 2023 and Forecast 2024 to 2034, By Purpose

Table 100: India Market Size (US$ million) Analysis 2019 to 2023 and Forecast 2024 to 2034, By Application

Table 101: India Market Size (US$ million) Analysis 2019 to 2023 and Forecast 2024 to 2034, By End User

Table 102: AESAN Countries Market Size (US$ million) Analysis 2019 to 2023 and Forecast 2024 to 2034, By Product

Table 103: AESAN Countries Market Size (US$ million) Analysis 2019 to 2023 and Forecast 2024 to 2034, By Sample Type

Table 104: AESAN Countries Market Size (US$ million) Analysis 2019 to 2023 and Forecast 2024 to 2034, By Target Type

Table 105: AESAN Countries Market Size (US$ million) Analysis 2019 to 2023 and Forecast 2024 to 2034, By Format

Table 106: AESAN Countries Market Size (US$ million) Analysis 2019 to 2023 and Forecast 2024 to 2034, By Purpose

Table 107: AESAN Countries Market Size (US$ million) Analysis 2019 to 2023 and Forecast 2024 to 2034, By Application

Table 108: AESAN Countries Market Size (US$ million) Analysis 2019 to 2023 and Forecast 2024 to 2034, By End User

Table 109: Australia and New Zealand Market Size (US$ million) Analysis 2019 to 2023 and Forecast 2024 to 2034, By Product

Table 110: Australia and New Zealand Market Size (US$ million) Analysis 2019 to 2023 and Forecast 2024 to 2034, By Sample Type

Table 111: Australia and New Zealand Market Size (US$ million) Analysis 2019 to 2023 and Forecast 2024 to 2034, By Target Type

Table 112: Australia and New Zealand Market Size (US$ million) Analysis 2019 to 2023 and Forecast 2024 to 2034, By Format

Table 113: Australia and New Zealand Market Size (US$ million) Analysis 2019 to 2023 and Forecast 2024 to 2034, By Purpose

Table 114: Australia and New Zealand Market Size (US$ million) Analysis 2019 to 2023 and Forecast 2024 to 2034, By Application

Table 115: Australia and New Zealand Market Size (US$ million) Analysis 2019 to 2023 and Forecast 2024 to 2034, By End User

Table 116: Western Europe Market Size (US$ million) Analysis 2019 to 2023 and Forecast 2024 to 2034, By Country

Table 117: Western Europe Market Size (US$ million) Analysis 2019 to 2023 and Forecast 2024 to 2034, By Product

Table 118: Western Europe Market Size (US$ million) Analysis 2019 to 2023 and Forecast 2024 to 2034, By Sample Type

Table 119: Western Europe Market Size (US$ million) Analysis 2019 to 2023 and Forecast 2024 to 2034, By Target Type

Table 120: Western Europe Market Size (US$ million) Analysis 2019 to 2023 and Forecast 2024 to 2034, By Format

Table 121: Western Europe Market Size (US$ million) Analysis 2019 to 2023 and Forecast 2024 to 2034, By Purpose

Table 122: Western Europe Market Size (US$ million) Analysis 2019 to 2023 and Forecast 2024 to 2034, By Application

Table 123: Western Europe Market Size (US$ million) Analysis 2019 to 2023 and Forecast 2024 to 2034, By End User

Table 124: Germany Market Size (US$ million) Analysis 2019 to 2023 and Forecast 2024 to 2034, By Product

Table 125: Germany Market Size (US$ million) Analysis 2019 to 2023 and Forecast 2024 to 2034, By Sample Type

Table 126: Germany Market Size (US$ million) Analysis 2019 to 2023 and Forecast 2024 to 2034, By Target Type

Table 127: Germany Market Size (US$ million) Analysis 2019 to 2023 and Forecast 2024 to 2034, By Format

Table 128: Germany Market Size (US$ million) Analysis 2019 to 2023 and Forecast 2024 to 2034, By Purpose

Table 129: Germany Market Size (US$ million) Analysis 2019 to 2023 and Forecast 2024 to 2034, By Application

Table 130: Germany Market Size (US$ million) Analysis 2019 to 2023 and Forecast 2024 to 2034, By End User

Table 131: Italy Market Size (US$ million) Analysis 2019 to 2023 and Forecast 2024 to 2034, By Product

Table 132: Italy Market Size (US$ million) Analysis 2019 to 2023 and Forecast 2024 to 2034, By Sample Type

Table 133: Italy Market Size (US$ million) Analysis 2019 to 2023 and Forecast 2024 to 2034, By Target Type

Table 134: Italy Market Size (US$ million) Analysis 2019 to 2023 and Forecast 2024 to 2034, By Format

Table 135: Italy Market Size (US$ million) Analysis 2019 to 2023 and Forecast 2024 to 2034, By Purpose

Table 136: Italy Market Size (US$ million) Analysis 2019 to 2023 and Forecast 2024 to 2034, By Application

Table 137: Italy Market Size (US$ million) Analysis 2019 to 2023 and Forecast 2024 to 2034, By End User

Table 138: France Market Size (US$ million) Analysis 2019 to 2023 and Forecast 2024 to 2034, By Product

Table 139: France Market Size (US$ million) Analysis 2019 to 2023 and Forecast 2024 to 2034, By Sample Type

Table 140: France Market Size (US$ million) Analysis 2019 to 2023 and Forecast 2024 to 2034, By Target Type

Table 141: France Market Size (US$ million) Analysis 2019 to 2023 and Forecast 2024 to 2034, By Format

Table 142: France Market Size (US$ million) Analysis 2019 to 2023 and Forecast 2024 to 2034, By Purpose

Table 143: France Market Size (US$ million) Analysis 2019 to 2023 and Forecast 2024 to 2034, By Application

Table 144: France Market Size (US$ million) Analysis 2019 to 2023 and Forecast 2024 to 2034, By End User

Table 145: United Kingdom Market Size (US$ million) Analysis 2019 to 2023 and Forecast 2024 to 2034, By Product

Table 146: United Kingdom Market Size (US$ million) Analysis 2019 to 2023 and Forecast 2024 to 2034, By Sample Type

Table 147: United Kingdom Market Size (US$ million) Analysis 2019 to 2023 and Forecast 2024 to 2034, By Target Type

Table 148: United Kingdom Market Size (US$ million) Analysis 2019 to 2023 and Forecast 2024 to 2034, By Format

Table 149: United Kingdom Market Size (US$ million) Analysis 2019 to 2023 and Forecast 2024 to 2034, By Purpose

Table 150: United Kingdom Market Size (US$ million) Analysis 2019 to 2023 and Forecast 2024 to 2034, By Application

Table 151: United Kingdom Market Size (US$ million) Analysis 2019 to 2023 and Forecast 2024 to 2034, By End User

Table 152: Spain Market Size (US$ million) Analysis 2019 to 2023 and Forecast 2024 to 2034, By Product

Table 153: Spain Market Size (US$ million) Analysis 2019 to 2023 and Forecast 2024 to 2034, By Sample Type

Table 154: Spain Market Size (US$ million) Analysis 2019 to 2023 and Forecast 2024 to 2034, By Target Type

Table 155: Spain Market Size (US$ million) Analysis 2019 to 2023 and Forecast 2024 to 2034, By Format

Table 156: Spain Market Size (US$ million) Analysis 2019 to 2023 and Forecast 2024 to 2034, By Purpose

Table 157: Spain Market Size (US$ million) Analysis 2019 to 2023 and Forecast 2024 to 2034, By Application

Table 158: Spain Market Size (US$ million) Analysis 2019 to 2023 and Forecast 2024 to 2034, By End User

Table 159: BENELUX Market Size (US$ million) Analysis 2019 to 2023 and Forecast 2024 to 2034, By Product

Table 160: BENELUX Market Size (US$ million) Analysis 2019 to 2023 and Forecast 2024 to 2034, By Sample Type

Table 161: BENELUX Market Size (US$ million) Analysis 2019 to 2023 and Forecast 2024 to 2034, By Target Type

Table 162: BENELUX Market Size (US$ million) Analysis 2019 to 2023 and Forecast 2024 to 2034, By Format

Table 163: BENELUX Market Size (US$ million) Analysis 2019 to 2023 and Forecast 2024 to 2034, By Purpose

Table 164: BENELUX Market Size (US$ million) Analysis 2019 to 2023 and Forecast 2024 to 2034, By Application

Table 165: BENELUX Market Size (US$ million) Analysis 2019 to 2023 and Forecast 2024 to 2034, By End User

Table 166: Nordic Countries Market Size (US$ million) Analysis 2019 to 2023 and Forecast 2024 to 2034, By Product

Table 167: Nordic Countries Market Size (US$ million) Analysis 2019 to 2023 and Forecast 2024 to 2034, By Sample Type

Table 168: Nordic Countries Market Size (US$ million) Analysis 2019 to 2023 and Forecast 2024 to 2034, By Target Type

Table 169: Nordic Countries Market Size (US$ million) Analysis 2019 to 2023 and Forecast 2024 to 2034, By Format

Table 170: Nordic Countries Market Size (US$ million) Analysis 2019 to 2023 and Forecast 2024 to 2034, By Purpose

Table 172: Nordic Countries Market Size (US$ million) Analysis 2019 to 2023 and Forecast 2024 to 2034, By Application

Table 173: Nordic Countries Market Size (US$ million) Analysis 2019 to 2023 and Forecast 2024 to 2034, By End User

Table 174: Eastern Europe Market Size (US$ million) Analysis 2019 to 2023 and Forecast 2024 to 2034, By Country

Table 175: Eastern Europe Market Size (US$ million) Analysis 2019 to 2023 and Forecast 2024 to 2034, By Product

Table 176: Eastern Europe Market Size (US$ million) Analysis 2019 to 2023 and Forecast 2024 to 2034, By Sample Type

Table 177: Eastern Europe Market Size (US$ million) Analysis 2019 to 2023 and Forecast 2024 to 2034, By Target Type

Table 178: Eastern Europe Market Size (US$ million) Analysis 2019 to 2023 and Forecast 2024 to 2034, By Format

Table 179: Eastern Europe Market Size (US$ million) Analysis 2019 to 2023 and Forecast 2024 to 2034, By Purpose

Table 180: Eastern Europe Market Size (US$ million) Analysis 2019 to 2023 and Forecast 2024 to 2034, By Application

Table 181: Eastern Europe Market Size (US$ million) Analysis 2019 to 2023 and Forecast 2024 to 2034, By End User

Table 182: Russia Market Size (US$ million) Analysis 2019 to 2023 and Forecast 2024 to 2034, By Product

Table 183: Russia Market Size (US$ million) Analysis 2019 to 2023 and Forecast 2024 to 2034, By Sample Type

Table 184: Russia Market Size (US$ million) Analysis 2019 to 2023 and Forecast 2024 to 2034, By Target Type

Table 185: Russia Market Size (US$ million) Analysis 2019 to 2023 and Forecast 2024 to 2034, By Format

Table 186: Russia Market Size (US$ million) Analysis 2019 to 2023 and Forecast 2024 to 2034, By Purpose

Table 187: Russia Market Size (US$ million) Analysis 2019 to 2023 and Forecast 2024 to 2034, By Application

Table 188: Russia Market Size (US$ million) Analysis 2019 to 2023 and Forecast 2024 to 2034, By End User

Table 189: Hungary Market Size (US$ million) Analysis 2019 to 2023 and Forecast 2024 to 2034, By Product

Table 190: Hungary Market Size (US$ million) Analysis 2019 to 2023 and Forecast 2024 to 2034, By Sample Type

Table 191: Hungary Market Size (US$ million) Analysis 2019 to 2023 and Forecast 2024 to 2034, By Target Type

Table 192: Hungary Market Size (US$ million) Analysis 2019 to 2023 and Forecast 2024 to 2034, By Format

Table 193: Hungary Market Size (US$ million) Analysis 2019 to 2023 and Forecast 2024 to 2034, By Purpose

Table 194: Hungary Market Size (US$ million) Analysis 2019 to 2023 and Forecast 2024 to 2034, By Application

Table 195: Hungary Market Size (US$ million) Analysis 2019 to 2023 and Forecast 2024 to 2034, By End User

Table 196: Poland Market Size (US$ million) Analysis 2019 to 2023 and Forecast 2024 to 2034, By Product

Table 197: Poland Market Size (US$ million) Analysis 2019 to 2023 and Forecast 2024 to 2034, By Sample Type

Table 198: Poland Market Size (US$ million) Analysis 2019 to 2023 and Forecast 2024 to 2034, By Target Type

Table 199: Poland Market Size (US$ million) Analysis 2019 to 2023 and Forecast 2024 to 2034, By Format

Table 200: Poland Market Size (US$ million) Analysis 2019 to 2023 and Forecast 2024 to 2034, By Purpose

Table 201: Poland Market Size (US$ million) Analysis 2019 to 2023 and Forecast 2024 to 2034, By Application

Table 202: Poland Market Size (US$ million) Analysis 2019 to 2023 and Forecast 2024 to 2034, By End User

Table 203: Middle East and Africa Market Size (US$ million) Analysis 2019 to 2023 and Forecast 2024 to 2034, By Country

Table 204: Middle East and Africa Market Size (US$ million) Analysis 2019 to 2023 and Forecast 2024 to 2034, By Product

Table 205: Middle East and Africa Market Size (US$ million) Analysis 2019 to 2023 and Forecast 2024 to 2034, By Sample Type

Table 206: Middle East and Africa Market Size (US$ million) Analysis 2019 to 2023 and Forecast 2024 to 2034, By Target Type

Table 207: Middle East and Africa Market Size (US$ million) Analysis 2019 to 2023 and Forecast 2024 to 2034, By Format

Table 208: Middle East and Africa Market Size (US$ million) Analysis 2019 to 2023 and Forecast 2024 to 2034, By Purpose

Table 209: Middle East and Africa Market Size (US$ million) Analysis 2019 to 2023 and Forecast 2024 to 2034, By Application

Table 210: Middle East and Africa Market Size (US$ million) Analysis 2019 to 2023 and Forecast 2024 to 2034, By End User

Table 211: Saudi Arabia Market Size (US$ million) Analysis 2019 to 2023 and Forecast 2024 to 2034, By Product

Table 212: Saudi Arabia Market Size (US$ million) Analysis 2019 to 2023 and Forecast 2024 to 2034, By Sample Type

Table 213: Saudi Arabia Market Size (US$ million) Analysis 2019 to 2023 and Forecast 2024 to 2034, By Target Type

Table 214: Saudi Arabia Market Size (US$ million) Analysis 2019 to 2023 and Forecast 2024 to 2034, By Format

Table 215: Saudi Arabia Market Size (US$ million) Analysis 2019 to 2023 and Forecast 2024 to 2034, By Purpose

Table 216: Saudi Arabia Market Size (US$ million) Analysis 2019 to 2023 and Forecast 2024 to 2034, By Application

Table 217: Saudi Arabia Market Size (US$ million) Analysis 2019 to 2023 and Forecast 2024 to 2034, By End User

Table 218: Türkiye Market Size (US$ million) Analysis 2019 to 2023 and Forecast 2024 to 2034, By Product

Table 219: Türkiye Market Size (US$ million) Analysis 2019 to 2023 and Forecast 2024 to 2034, By Sample Type

Table 220: Türkiye Market Size (US$ million) Analysis 2019 to 2023 and Forecast 2024 to 2034, By Target Type

Table 221: Türkiye Market Size (US$ million) Analysis 2019 to 2023 and Forecast 2024 to 2034, By Format

Table 222: Türkiye Market Size (US$ million) Analysis 2019 to 2023 and Forecast 2024 to 2034, By Purpose

Table 223: Türkiye Market Size (US$ million) Analysis 2019 to 2023 and Forecast 2024 to 2034, By Application

Table 224: Türkiye Market Size (US$ million) Analysis 2019 to 2023 and Forecast 2024 to 2034, By End User

Table 225: South Africa Market Size (US$ million) Analysis 2019 to 2023 and Forecast 2024 to 2034, By Product

Table 226: South Africa Market Size (US$ million) Analysis 2019 to 2023 and Forecast 2024 to 2034, By Sample Type

Table 227: South Africa Market Size (US$ million) Analysis 2019 to 2023 and Forecast 2024 to 2034, By Target Type

Table 228: South Africa Market Size (US$ million) Analysis 2019 to 2023 and Forecast 2024 to 2034, By Format

Table 229: South Africa Market Size (US$ million) Analysis 2019 to 2023 and Forecast 2024 to 2034, By Purpose

Table 230: South Africa Market Size (US$ million) Analysis 2019 to 2023 and Forecast 2024 to 2034, By Application

Table 231: South Africa Market Size (US$ million) Analysis 2019 to 2023 and Forecast 2024 to 2034, By End User

Table 232: Other African Union Market Size (US$ million) Analysis 2019 to 2023 and Forecast 2024 to 2034, By Product

Table 233: Other African Union Market Size (US$ million) Analysis 2019 to 2023 and Forecast 2024 to 2034, By Sample Type

Table 234: Other African Union Market Size (US$ million) Analysis 2019 to 2023 and Forecast 2024 to 2034, By Target Type

Table 235: Other African Union Market Size (US$ million) Analysis 2019 to 2023 and Forecast 2024 to 2034, By Format

Table 236: Other African Union Market Size (US$ million) Analysis 2019 to 2023 and Forecast 2024 to 2034, By Purpose

Table 237: Other African Union Market Size (US$ million) Analysis 2019 to 2023 and Forecast 2024 to 2034, By Application

Table 238: Other African Union Market Size (US$ million) Analysis 2019 to 2023 and Forecast 2024 to 2034, By End User

List of Figures

Figure 1: Global Market Share, By Product, 2024 (E)

Figure 2: Global Market Share, By Sample Type, 2024 (E)

Figure 3: Global Market Share, By Target Type, 2024 (E)

Figure 4: Global Market Share, By Format, 2024 (E)

Figure 5: Global Market Share, By Purpose 2024 (E)

Figure 6: Global Market Share, By Application 2024 (E)

Figure 7: Global Market Share, By End User 2024 (E)

Figure 8: Global Market Share, By Country, 2024 (E)

Figure 9: Global Market Value Analysis (US$ million), 2019 to 2023

Figure 10: Global Market Value Forecast (US$ million), 2024 to 2034

Figure 11: Global Market Absolute Market Absolute $ Opportunity, 2024 to 2034

Figure 12: Global Market Share Analysis (%), By Product, 2024 (E) to 2034 (F)

Figure 13: Global Market Y-o-Y Analysis (%), By Product, 2024 to 2034

Figure 14: Global Market Attractiveness Analysis By Product, 2024 to 2034

Figure 15: Global Market Share Analysis (%), By Sample Type, 2024 (E) to 2034 (F)

Figure 16: Global Market Y-o-Y Analysis (%), By Sample Type, 2024 to 2034

Figure 17: Global Market Attractiveness Analysis By Sample Type, 2024 to 2034

Figure 18: Global Market Share Analysis (%), By Target Type, 2024 (E) to 2034 (F)

Figure 19: Global Market Y-o-Y Analysis (%), By Target Type, 2024 to 2034

Figure 20: Global Market Attractiveness Analysis By Target Type, 2024 to 2034

Figure 21: Global Market Share Analysis (%), By Format, 2024 (E) to 2034 (F)

Figure 22: Global Market Y-o-Y Analysis (%), By Format, 2024 to 2034

Figure 23: Global Market Attractiveness Analysis By Format, 2024 to 2034

Figure 24: Global Market Share Analysis (%), By Purpose, 2024 (E) and 2034 (F)

Figure 25: Global Market Y-o-Y Analysis (%), By Purpose, 2024 to 2034

Figure 26: Global Market Attractiveness Analysis By Purpose, 2024 to 2034

Figure 27: Global Market Share Analysis (%), By Application, 2024 (E) and 2034 (F)

Figure 28: Global Market Y-o-Y Analysis (%), By Application, 2024 to 2034

Figure 29: Global Market Attractiveness Analysis By Application, 2024 to 2034

Figure 30: Global Market Share Analysis (%), By End User, 2024 (E) and 2034 (F)

Figure 31: Global Market Y-o-Y Analysis (%), By End User, 2024 to 2034

Figure 32: Global Market Attractiveness Analysis By End User, 2024 to 2034

Figure 33: Global Market Share Analysis (%), By Region, 2024 (E) and 2034 (F)

Figure 34: Global Market Y-o-Y Analysis (%), By Region, 2024 to 2034

Figure 35: Global Market Attractiveness Analysis By Region, 2024 to 2034

Figure 36: North America Market Share, By Product, 2024 (E)

Figure 37: North America Market Share, By Sample Type, 2024 (E)

Figure 38: North America Market Share, By Target Type, 2024 (E)

Figure 39: North America Market Share, By Format, 2024 (E)

Figure 40: North America Market Share, By Purpose, 2024 (E)

Figure 41: North America Market Share, By Application, 2024 (E)

Figure 42: North America Market Share, By End User, 2024 (E)

Figure 43: North America Market Share, By Country, 2024 (E)

Figure 44: North America Market Value (US$ million) Analysis 2019 to 2023

Figure 45: North America Market Value (US$ million) Analysis 2024 to 2034

Figure 46: North America Market Attractiveness Analysis by Product, 2024 to 2034

Figure 47: North America Market Attractiveness Analysis By Sample Type, 2024 to 2034

Figure 48: North America Market Attractiveness Analysis By Target Type, 2024 to 2034

Figure 49: North America Market Attractiveness Analysis By Format, 2024 to 2034

Figure 50: North America Market Attractiveness Analysis By Purpose, 2024 to 2034

Figure 51: North America Market Attractiveness Analysis By Application, 2024 to 2034

Figure 52: North America Market Attractiveness Analysis By End User, 2024 to 2034

Figure 53: North America Market Attractiveness Analysis by Country, 2024 to 2034

Figure 54: Latin America Market Share, By Product, 2024 (E)

Figure 55: Latin America Market Share, By Sample Type, 2024 (E)

Figure 56: Latin America Market Share, By Target Type, 2024 (E)

Figure 57: Latin America Market Share, By Format, 2024 (E)

Figure 58: Latin America Market Share, By Purpose, 2024 (E)

Figure 59: Latin America Market Share, By Application, 2024 (E)

Figure 60: Latin America Market Share, By End User, 2024 (E)

Figure 61: Latin America Market Share, By Country, 2024 (E)

Figure 62: Latin America Market Value (US$ million) Analysis 2019 to 2023

Figure 63: Latin America Market Value (US$ million) Analysis 2024 to 2034

Figure 64: Latin America Market Attractiveness Analysis by Product, 2024 to 2034

Figure 65: Latin America Market Attractiveness Analysis By Sample Type, 2024 to 2034

Figure 66: Latin America Market Attractiveness Analysis By Target Type, 2024 to 2034

Figure 67: Latin America Market Attractiveness Analysis By Format, 2024 to 2034

Figure 68: Latin America Market Attractiveness Analysis by Purpose, 2024 to 2034

Figure 69: Latin America Market Attractiveness Analysis By Application, 2024 to 2034

Figure 70: Latin America Market Attractiveness Analysis By End User, 2024 to 2034

Figure 71: Latin America Market Attractiveness Analysis by Country, 2024 to 2034

Figure 72: East Asia Market Share, By Product, 2024 (E)

Figure 73: East Asia Market Share, By Sample Type, 2024 (E)

Figure 74: East Asia Market Share, By Target Type, 2024 (E)

Figure 75: East Asia Market Share, By Format, 2024 (E)

Figure 76: East Asia Market Share, By Purpose, 2024 (E)

Figure 77: East Asia Market Share, By Application, 2024 (E)

Figure 78: East Asia Market Share, By End User, 2024 (E)

Figure 79: East Asia Market Share, By Country, 2024 (E)

Figure 80: East Asia Market Value (US$ million) Analysis 2019 to 2023

Figure 81: East Asia Market Value (US$ million) Analysis 2024 to 2034

Figure 82: East Asia Market Attractiveness Analysis by Product, 2024 to 2034

Figure 83: East Asia Market Attractiveness Analysis By Sample Type, 2024 to 2034

Figure 84: East Asia Market Attractiveness Analysis By Target Type, 2024 to 2034

Figure 85: East Asia Market Attractiveness Analysis By Format, 2024 to 2034

Figure 86: East Asia Market Attractiveness Analysis By Purpose, 2024 to 2034

Figure 87: East Asia Market Attractiveness Analysis By Application, 2024 to 2034

Figure 88: East Asia Market Attractiveness Analysis By End User, 2024 to 2034

Figure 89: East Asia Market Attractiveness Analysis by Country, 2024 to 2034

Figure 90: South Asia and Pacific Market Share, By Product, 2024 (E)

Figure 91: South Asia and Pacific Market Share, By Sample Type, 2024 (E)

Figure 92: South Asia and Pacific Market Share, By Target Type, 2024 (E)

Figure 93: South Asia and Pacific Market Share, By Format, 2024 (E)

Figure 94: South Asia and Pacific Market Share, By Purpose, 2024 (E)

Figure 95: South Asia and Pacific Market Share, By Application, 2024 (E)

Figure 96: South Asia and Pacific Market Share, By End User, 2024 (E)

Figure 97: South Asia and Pacific Market Share, By Country, 2024 (E)

Figure 98: South Asia and Pacific Market Value (US$ million) Analysis 2019 to 2023

Figure 99: South Asia and Pacific Market Value (US$ million) Analysis 2024 to 2034

Figure 100: South Asia and Pacific Market Attractiveness Analysis by Product, 2024 to 2034

Figure 101: South Asia and Pacific Market Attractiveness Analysis By Sample Type, 2024 to 2034

Figure 102: South Asia and Pacific Market Attractiveness Analysis By Target Type, 2024 to 2034

Figure 103: South Asia and Pacific Market Attractiveness Analysis By Format, 2024 to 2034

Figure 104: South Asia and Pacific Market Attractiveness Analysis By Purpose, 2024 to 2034

Figure 105: South Asia and Pacific Market Attractiveness Analysis By Application, 2024 to 2034

Figure 106: South Asia and Pacific Market Attractiveness Analysis By End User, 2024 to 2034

Figure 107: South Asia and Pacific Market Attractiveness Analysis by Country, 2024 to 2034

Figure 108: Western Europe Market Share, By Product, 2024 (E)

Figure 109: Western Europe Market Share, By Sample Type, 2024 (E)

Figure 110: Western Europe Market Share, By Target Type, 2024 (E)

Figure 111: Western Europe Market Share, By Format, 2024 (E)

Figure 112: Western Europe Market Share, By Purpose, 2024 (E)

Figure 113: Western Europe Market Share, By Application, 2024 (E)

Figure 114: Western Europe Market Share, By End User, 2024 (E)

Figure 115: Western Europe Market Share, By Country, 2024 (E)

Figure 116: Western Europe Market Value (US$ million) Analysis 2019 to 2023

Figure 117: Western Europe Market Value (US$ million) Analysis 2024 to 2034

Figure 118: Western Europe Market Attractiveness Analysis by Product, 2024 to 2034

Figure 119: Western Europe Market Attractiveness Analysis By Sample Type, 2024 to 2034

Figure 120: Western Europe Market Attractiveness Analysis By Target Type, 2024 to 2034

Figure 121: Western Europe Market Attractiveness Analysis By Format, 2024 to 2034

Figure 122: Western Europe Market Attractiveness Analysis By Purpose, 2024 to 2034

Figure 123: Western Europe Market Attractiveness Analysis By Application, 2024 to 2034

Figure 124: Western Europe Market Attractiveness Analysis By End User, 2024 to 2034

Figure 125: Western Europe Market Attractiveness Analysis by Country, 2024 to 2034

Figure 126: Eastern Europe Market Share, By Product, 2024 (E)

Figure 127: Eastern Europe Market Share, By Sample Type, 2024 (E)

Figure 128: Eastern Europe Market Share, By Target Type, 2024 (E)

Figure 129: Eastern Europe Market Share, By Format, 2024 (E)

Figure 130: Eastern Europe Market Share, By Purpose, 2024 (E)

Figure 131: Eastern Europe Market Share, By Application, 2024 (E)

Figure 132: Eastern Europe Market Share, By End User, 2024 (E)

Figure 133: Eastern Europe Market Share, By Country, 2024 (E)

Figure 134: Eastern Europe Market Value (US$ million) Analysis 2019 to 2023

Figure 135: Eastern Europe Market Value (US$ million) Analysis 2024 to 2034

Figure 136: Eastern Europe Market Attractiveness Analysis by Product, 2024 to 2034

Figure 137: Eastern Europe Market Attractiveness Analysis By Sample Type, 2024 to 2034

Figure 138: Eastern Europe Market Attractiveness Analysis By Target Type, 2024 to 2034

Figure 139: Eastern Europe Market Attractiveness Analysis By Format, 2024 to 2034

Figure 140: Eastern Europe Market Attractiveness Analysis By Purpose, 2024 to 2034

Figure 141: Eastern Europe Market Attractiveness Analysis By Application, 2024 to 2034

Figure 142: Eastern Europe Market Attractiveness Analysis By End User, 2024 to 2034

Figure 143: Eastern Europe Market Attractiveness Analysis by Country, 2024 to 2034

Figure 144: Middle East and Africa Market Share, By Product, 2024 (E)

Figure 145: Middle East and Africa Market Share, By Sample Type, 2024 (E)

Figure 146: Middle East and Africa Market Share, By Target Type, 2024 (E)

Figure 147: Middle East and Africa Market Share, By Format, 2024 (E)

Figure 148: Middle East and Africa Market Share, By Purpose, 2024 (E)

Figure 149: Middle East and Africa Market Share, By Application, 2024 (E)

Figure 150: Middle East and Africa Market Share, By End User, 2024 (E)

Figure 151: Middle East and Africa Market Share, By Country, 2024 (E)

Figure 152: Middle East and Africa Market Value (US$ million) Analysis 2019 to 2023

Figure 153: Middle East and Africa Market Value (US$ million) Analysis 2024 to 2034

Figure 154: Middle East and Africa Market Attractiveness Analysis by Product, 2024 to 2034

Figure 155: Middle East and Africa Market Attractiveness Analysis By Sample Type, 2024 to 2034

Figure 156: Middle East and Africa Market Attractiveness Analysis By Target Type, 2024 to 2034

Figure 157: Middle East and Africa Market Attractiveness Analysis By Format, 2024 to 2034

Figure 158: Middle East and Africa Market Attractiveness Analysis By Purpose, 2024 to 2034

Figure 159: Middle East and Africa Market Attractiveness Analysis By Application, 2024 to 2034

Figure 160: Middle East and Africa Market Attractiveness Analysis By End User, 2024 to 2034

Figure 161: Middle East and Africa Market Attractiveness Analysis by Country, 2024 to 2034

Figure 162: Global Market: Company Share Analysis (2024)

Frequently Asked Questions

How big is the global nucleic acid extraction kit market?

The global market value is estimated to total USD 2,134.40 million in 2024.

What is the expected market size for 2034?

The nucleic acid extraction market size is set to reach USD 4,285.08 million by 2034.

What is the demand outlook for nucleic acid extraction kits?

Global demand is projected to increase at 7.4% CAGR through 2034.

Which product segment dominates the market?

The DNA extraction kits segment dominates the global market.

What was the last 5 years’ CAGR for the global market?

The global market expanded at a 6.1% CAGR from 2019 to 2023.

What is the United States market outlook?

The United States nucleic acid extraction kit industry is set to record a CAGR of 4.1%.

How big is the extraction kit market?

As per the FMI, the global extraction kit was valued at around USD 1,293.4 million in 2023.

What is the cost of automated DNA extractor?

Automated DNA extractor costs over 100000 in India.

What is the price of plasmid DNA isolation kit in India?

Plasmid DNA isolation kit price in India ranges from 2700 to 3500.

Explore In-vitro Diagnostics Devices Insights

Future Market Insights

Nucleic Acid Extraction Kit Market