Reports

- Global Locations -

Headquarters

Future Market Insights, Inc.

Christiana Corporate, 200
Continental Drive, Suite 401,
Newark, Delaware - 19713,
United States

T: +1-845-579-5705

Americas

Future Market Insights, Inc.

616 Corporate Way, Suite 2-9018,
Valley Cottage, NY 10989, United States

T: +1-347-918-3531

MEA

Future Market Insights

1602-6 Jumeirah Bay X2 Tower, Plot No: JLT-PH2-X2A,
Jumeirah Lakes Towers, Dubai,
United Arab Emirates

Europe

Future Market Insights

3rd Floor, 207 Regent Street,
W1B 3HH London
United Kingdom

T: + 44 (0) 20 8123 9659
D: +44 (0) 20 3287 4268

Asia Pacific

Future Market Insights

IndiaLand Global Tech Park, Unit UG-1, Behind Grand HighStreet, Phase 1, Hinjawadi, MH, Pune – 411057, India

Kidney Stone Extraction Balloon Market Snapshot (2022 to 2032)

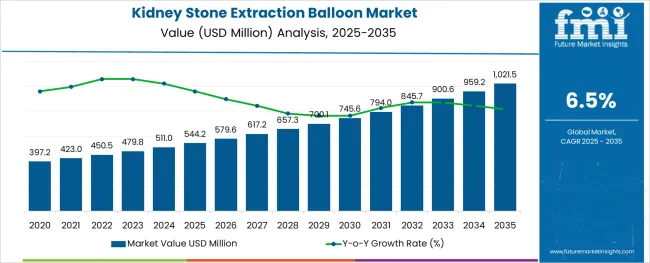
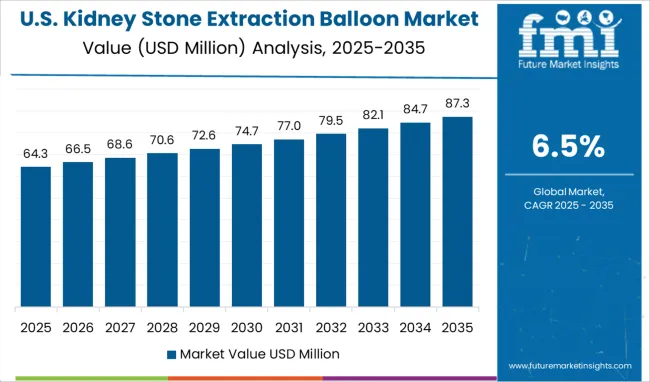
Increasing from US$ 450.5 Million in 2022 to US$ 902.2 Million by 2032, the global kidney stone extraction market is expected to display a CAGR of 6.5% from 2022 to 2032. The CAGR was valued at 6% from 2016 to 2021.

The growth of the market can be attributed to the increasing prevalence of kidney stones among the expanding geriatric population.

Report Attributes Details
Projected Market Value (2022) US$ 450.5 Million
Anticipated Forecast Value (2032) US$ 902.2 Million
Estimated Growth Rate (2022 to 2032) 6.5%

The growing prevalence of obesity, eating disorders, and high blood pressure among the growing population is projected to drive the market for kidney extraction balloon during the forecast period. As per the Centers for Disease Control and Prevention (CDC), from 1999 to 2000 through 2017 - March 2020, US obesity prevalence increased from 30.5% to 41.9%. During the same time, the prevalence of severe obesity increased from 4.7% to 9.2%.

Growing collaborations among players are anticipated to benefit the market in the coming time. For instance, United Medical Systems Inc., with its parent company, called, New State Capital Partners LLC, invested in American Stone Management LLC. United Medical Systems established the concept of shared mobile medical services, majorly for Urology. Such factors are expected to benefit the industry in the forecast period.

Don't pay for what you don't need

Customize your report by selecting specific countries or regions and save 30%!

What are the Factors Favoring the Global Kidney Stone Extraction Balloon Market?

The growing prevalence of kidney stone diseases is anticipated to be the key factor responsible for market growth during the forecast period. As per the European Association of Urology and National Kidney Foundation 2019, in countries with a high standard of life such as the USA, Canada, and Sweden, the disease is prevalent in more than 10% of the population.

Increasing adoption of minimally invasive stone removal procedures is another factor that is projected to boost market growth during the forecast period. As per Advances in Chronic Kidney Diseases, in the United States, minimally invasive treatments have been adopted primarily for lithotripsy, percutaneous nephrolithotomy, and ureteroscopy lithotripsy. Changing market dynamics are likely to augment the market size in the coming time.

What are the Factors Limiting the Global Kidney Stone Extraction Balloon Market?

The major limitation associated with balloon dilation is a more limited size of the papillary opening, which may control the size of the stone that can be extracted using the balloon or a basket catheter. Stones that measure more than 8 mm demand mechanical lithotripsy to allow transpupillary extraction.

Other factors affecting the market growth include the risk of developing urinary tract infection, and injury to the ureter during the procedure, among others. Also, a lack of expertise and a dearth of efficient healthcare infrastructure can limit and impede the expansion of the market during the forecast period.

However, ongoing Research and Development for new techniques and devices in stone disease are anticipated to offer significant opportunities to the market during the forecast period.
Sabyasachi Ghosh
Sabyasachi Ghosh

Principal Consultant

Talk to Analyst

Find your sweet spots for generating winning opportunities in this market.

Why is North America Projected to Dominate the Global Kidney Stone Extraction Balloon Market?

According to the analysis, the global kidney stone extraction market is anticipated to be dominated by North America. In 2022, the region is expected to secure about 32% of the total global revenue.

The domination of the region can be attributed to the increasing prevalence of kidney stones. The market in the region is progressing owing to the presence of favorable reimbursement policies. Also, rising awareness among the patient population about novel methods for stone disease treatment is likely to augment the market size in the coming time.
What is the Role of Europe in Developing the Global Kidney Stone Extraction Balloon Market?

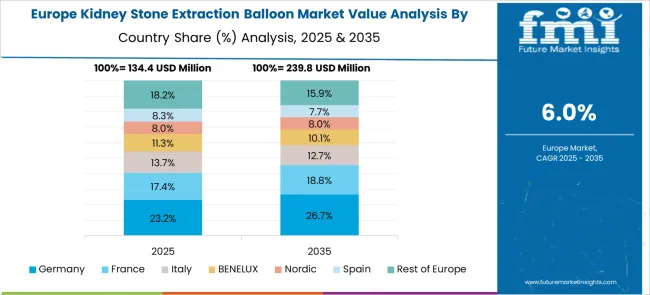
As per the analysis, Europe is projected to be the second-largest kidney stone extraction balloon market during the forecast period. In 2022, Europe is likely to claim 28% of the total market revenue.

The growth of the region can be attributed to the increasing number of kidney stone cases in Europe. Further, higher acceptance of the technologically developed product, increasing healthcare expenses, and developments made by players in the region. In 2019, Dornier MedTech launched an OptiVision technology for its product Dornier Delta III. It is the first image post-processing software that was designed to enhance stone treatment outcomes.

Get the data you need at a Fraction of the cost

Personalize your report by choosing insights you need
and save 40%!

Why is Asia-Pacific Projected to be a Lucrative Market for Kidney Stone Extraction Balloon Market?

According to the analysis, Asia-Pacific is projected to be the most lucrative market during the forecast period. The growth of the market can be attributed to the presence of developing countries. Increasing awareness about medical devices and the presence of a large patient pool is projected to benefit the regional market.

According to National Center for Biotechnology Information, 12% of Indians are expected to have urinary stones and 50% of them are likely to end up with the loss of kidney functions. Expanding geriatric population affected with kidney stones in Asia-Pacific is anticipated to support the kidney stone extraction balloon market in the forthcoming period.

What is the Role of Startups in Developing the Global Kidney Stone Extraction Balloon Market?

Players such as Klotho Therapeutics, Invizius, Chinook Therapeutics, Oxalo Therapeutics, Kantum Bio, Monogram Health, Strive Health, pulse data, and ProKidney, are some of the emerging entities in the global kidney stone extraction balloon market.

Players in the market are raising funds which will strengthen the market in the coming time. For instance, a healthcare startup, pulseData raised US$ 16.5 Million to help lower the costs to treat kidney diseases. Such factors are anticipated to boost the startup market growth in the coming time.
Competition Analysis

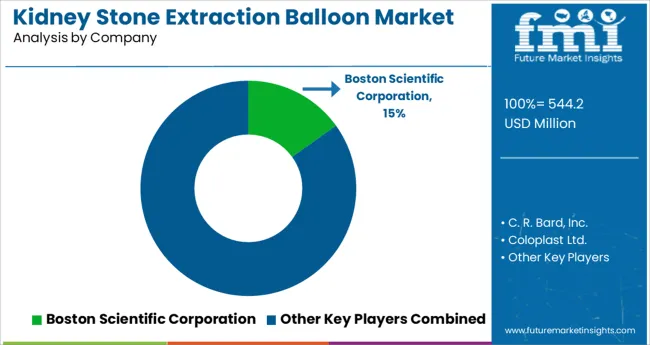
Key players in the global kidney stone extraction balloon market include C. R. Bard, Inc., Boston Scientific Corporation, Coloplast Ltd., iVascular SLU, Cook Medical, Inc., Med Pro Medical B.V., Teleflex Incorporated, NuAngle, and many others.

Recent Development:

  • In June 2022, Boston Scientific Corporation announced that it has entered into a definitive agreement with Synergy Innovation to purchase its majority stake in M.I Tech Co., Ltd, a publicly traded Korean Manufacturer and distributor of medical devices for endoscopic and urologic procedures.
  • In December 2020, Teleflex Incorporated, a known global provider of healthcare supplies and services, announced that it completed the acquisition of Z-Medica, a pioneer in the manufacture of hemostatic products.

Report Scope

Report Attribute Details
Growth Rate (2022 to 2032) 6.5%
Market Value in 2022 US$ 450.5 Million
Market Value in 2032 US$ 902.2 Million
Base Year for Estimation 2021
Historical Data 2016 to 2021
Forecast Period 2022 to 2032
Quantitative Units USD Million for Value
Report Coverage Revenue Forecast, Volume Forecast, Company Ranking, Competitive Landscape, Growth Factors, Trends, and Pricing Analysis
Segments Covered
  • Type
  • Filler
  • End User
  • Region
Regions Covered
  • North America
  • Latin America
  • Europe
  • Asia Pacific
  • Middle East & Africa
Key Countries Profiled
  • United States of America
  • Canada
  • Argentina
  • Brazil
  • Mexico
  • Germany
  • United Kingdom
  • France
  • Spain
  • Italy
  • Nordic Countries
  • Poland
  • Russia
  • Australia & New Zealand
  • China
  • India
  • ASIAN
  • GCC Countries
  • North Africa
  • South Africa
Key Companies Profiled C. R. Bard, Inc., Boston Scientific Corporation, Coloplast Ltd., iVascular SLU, Cook Medical, Inc., Med Pro Medical B.V., Teleflex Incorporated, NuAngle, and many others.
Customization Scope Available upon Request

Key Segments Profiled in the Global Kidney Stone Extraction Balloon Market

By Type:

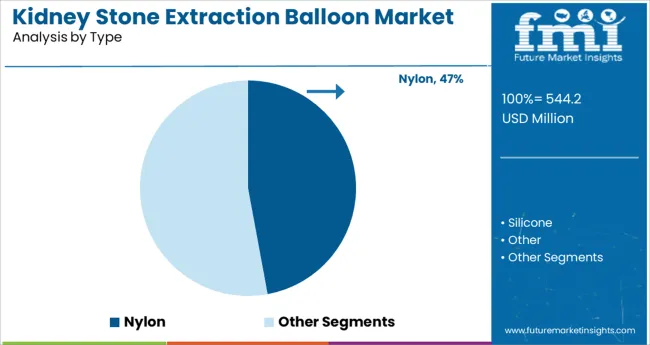
  • Nylon
  • Silicone
  • Other

By Filler:

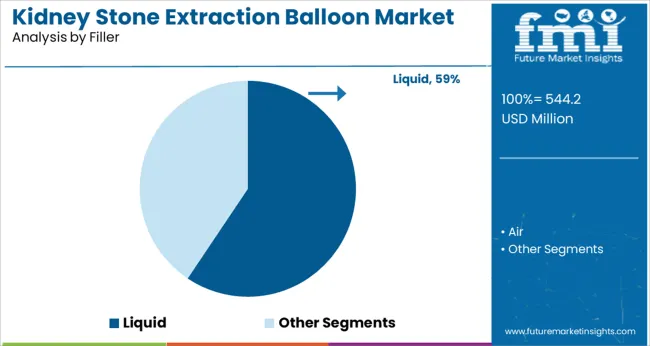
  • Liquid
  • Air

By End User:

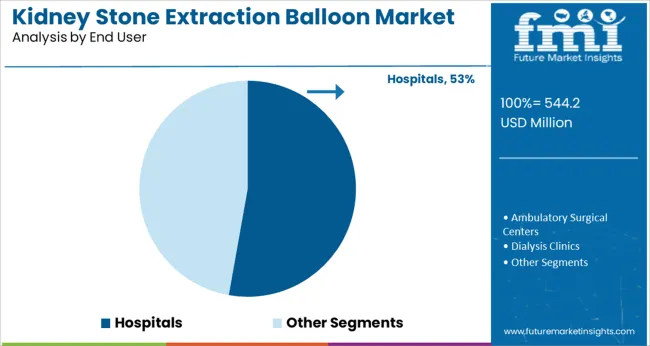
  • Hospitals
  • Ambulatory Surgical Centers
  • Dialysis Clinics

By Region:

  • North American
  • Latin American
  • European
  • Asia Pacific
  • Middle East and Africa

Frequently Asked Questions

What is the Expected Market Value of the Global Kidney Stone Extraction Balloon Market during the forecast period?

The global kidney stone extraction balloon market is expected to secure US$ 902.2 Million by 2032.

What is the Projected CAGR of the Global Kidney Stone Extraction Balloon Market in the Assessment Period?

The global kidney stone extraction balloon market is anticipated to record a CAGR of 6.5% during the forecast period.

Which are the Eminent Players in the Global Kidney Stone Balloon Extraction Market?

C. R. Bard, Inc., Boston Scientific Corporation, Coloplast Ltd., and iVascular SLU are some of the known players in the global kidney stone balloon extraction market.

Table of Content

1. Executive Summary | Kidney Stone Extraction Balloon Market

    1.1. Global Market Outlook

    1.2. Demand-side Trends

    1.3. Supply-side Trends

    1.4. Technology Roadmap Analysis

    1.5. Analysis and Recommendations

2. Market Overview

    2.1. Market Coverage / Taxonomy

    2.2. Market Definition / Scope / Limitations

3. Market Background

    3.1. Market Dynamics

        3.1.1. Drivers

        3.1.2. Restraints

        3.1.3. Opportunity

        3.1.4. Trends

    3.2. Scenario Forecast

        3.2.1. Demand in Optimistic Scenario

        3.2.2. Demand in Likely Scenario

        3.2.3. Demand in Conservative Scenario

    3.3. Opportunity Map Analysis

    3.4. Investment Feasibility Matrix

    3.5. PESTLE and Porter’s Analysis

    3.6. Regulatory Landscape

        3.6.1. By Key Regions

        3.6.2. By Key Countries

    3.7. Regional Parent Market Outlook

4. Global Market Analysis 2016 to 2021 and Forecast, 2022 to 2032

    4.1. Historical Market Size Value (US$ Million) Analysis, 2016 to 2021

    4.2. Current and Future Market Size Value (US$ Million) Projections, 2022 to 2032

        4.2.1. Y-o-Y Growth Trend Analysis

        4.2.2. Absolute Opportunity Analysis

5. Global Market Analysis 2016 to 2021 and Forecast 2022 to 2032, By Material Type

    5.1. Introduction / Key Findings

    5.2. Historical Market Size Value (US$ Million) Analysis By Material Type, 2016 to 2021

    5.3. Current and Future Market Size Value (US$ Million) Analysis and Forecast By Material Type, 2022 to 2032

        5.3.1. Nylon

        5.3.2. Silicone

        5.3.3. Other Materials

    5.4. Y-o-Y Growth Trend Analysis By Material Type, 2016 to 2021

    5.5. Absolute Opportunity Analysis By Material Type, 2022 to 2032

6. Global Market Analysis 2016 to 2021 and Forecast 2022 to 2032, By Filler

    6.1. Introduction / Key Findings

    6.2. Historical Market Size Value (US$ Million) Analysis By Filler, 2016 to 2021

    6.3. Current and Future Market Size Value (US$ Million) Analysis and Forecast By Filler, 2022 to 2032

        6.3.1. Liquid

        6.3.2. Air

    6.4. Y-o-Y Growth Trend Analysis By Filler, 2016 to 2021

    6.5. Absolute Opportunity Analysis By Filler, 2022 to 2032

7. Global Market Analysis 2016 to 2021 and Forecast 2022 to 2032, By End User

    7.1. Introduction / Key Findings

    7.2. Historical Market Size Value (US$ Million) Analysis By End User, 2016 to 2021

    7.3. Current and Future Market Size Value (US$ Million) Analysis and Forecast By End User, 2022 to 2032

        7.3.1. Hospitals

        7.3.2. Ambulatory Surgical Centers

        7.3.3. Dialysis Clinics

    7.4. Y-o-Y Growth Trend Analysis By End User, 2016 to 2021

    7.5. Absolute Opportunity Analysis By End User, 2022 to 2032

8. Global Market Analysis 2016 to 2021 and Forecast 2022 to 2032, By Region

    8.1. Introduction

    8.2. Historical Market Size Value (US$ Million) Analysis By Region, 2016 to 2021

    8.3. Current Market Size Value (US$ Million) Analysis and Forecast By Region, 2022 to 2032

        8.3.1. North America

        8.3.2. Latin America

        8.3.3. Europe

        8.3.4. Asia Pacific

        8.3.5. Middle East and Africa

    8.4. Market Attractiveness Analysis By Region

9. North America Market Analysis 2016 to 2021 and Forecast 2022 to 2032, By Country

    9.1. Historical Market Size Value (US$ Million) Trend Analysis By Market Taxonomy, 2016 to 2021

    9.2. Market Size Value (US$ Million) Forecast By Market Taxonomy, 2022 to 2032

        9.2.1. By Country

            9.2.1.1. United States of America

            9.2.1.2. Canada

        9.2.2. By Material Type

        9.2.3. By Filler

        9.2.4. By End User

    9.3. Market Attractiveness Analysis

        9.3.1. By Country

        9.3.2. By Material Type

        9.3.3. By Filler

        9.3.4. By End User

    9.4. Key Takeaways

10. Latin America Market Analysis 2016 to 2021 and Forecast 2022 to 2032, By Country

    10.1. Historical Market Size Value (US$ Million) Trend Analysis By Market Taxonomy, 2016 to 2021

    10.2. Market Size Value (US$ Million) Forecast By Market Taxonomy, 2022 to 2032

        10.2.1. By Country

            10.2.1.1. Brazil

            10.2.1.2. Mexico

            10.2.1.3. Rest of Latin America

        10.2.2. By Material Type

        10.2.3. By Filler

        10.2.4. By End User

    10.3. Market Attractiveness Analysis

        10.3.1. By Country

        10.3.2. By Material Type

        10.3.3. By Filler

        10.3.4. By End User

    10.4. Key Takeaways

11. Europe Market Analysis 2016 to 2021 and Forecast 2022 to 2032, By Country

    11.1. Historical Market Size Value (US$ Million) Trend Analysis By Market Taxonomy, 2016 to 2021

    11.2. Market Size Value (US$ Million) Forecast By Market Taxonomy, 2022 to 2032

        11.2.1. By Country

            11.2.1.1. Germany

            11.2.1.2. United Kingdom

            11.2.1.3. France

            11.2.1.4. Spain

            11.2.1.5. Italy

            11.2.1.6. Rest of Europe

        11.2.2. By Material Type

        11.2.3. By Filler

        11.2.4. By End User

    11.3. Market Attractiveness Analysis

        11.3.1. By Country

        11.3.2. By Material Type

        11.3.3. By Filler

        11.3.4. By End User

    11.4. Key Takeaways

12. Asia Pacific Market Analysis 2016 to 2021 and Forecast 2022 to 2032, By Country

    12.1. Historical Market Size Value (US$ Million) Trend Analysis By Market Taxonomy, 2016 to 2021

    12.2. Market Size Value (US$ Million) Forecast By Market Taxonomy, 2022 to 2032

        12.2.1. By Country

            12.2.1.1. China

            12.2.1.2. Japan

            12.2.1.3. South Korea

            12.2.1.4. India

            12.2.1.5. Malaysia

            12.2.1.6. Singapore

            12.2.1.7. Australia

            12.2.1.8. New Zealand

            12.2.1.9. Rest of Asia-Pacific (APAC)

        12.2.2. By Material Type

        12.2.3. By Filler

        12.2.4. By End User

    12.3. Market Attractiveness Analysis

        12.3.1. By Country

        12.3.2. By Material Type

        12.3.3. By Filler

        12.3.4. By End User

    12.4. Key Takeaways

13. Middle East and Africa Market Analysis 2016 to 2021 and Forecast 2022 to 2032, By Country

    13.1. Historical Market Size Value (US$ Million) Trend Analysis By Market Taxonomy, 2016 to 2021

    13.2. Market Size Value (US$ Million) Forecast By Market Taxonomy, 2022 to 2032

        13.2.1. By Country

            13.2.1.1. GCC Countries

            13.2.1.2. South Africa

            13.2.1.3. Israel

            13.2.1.4. Rest of Middle East and Africa

        13.2.2. By Material Type

        13.2.3. By Filler

        13.2.4. By End User

    13.3. Market Attractiveness Analysis

        13.3.1. By Country

        13.3.2. By Material Type

        13.3.3. By Filler

        13.3.4. By End User

    13.4. Key Takeaways

14. Key Countries Market Analysis

    14.1. United States of America

        14.1.1. Pricing Analysis

        14.1.2. Market Share Analysis, 2021

            14.1.2.1. By Material Type

            14.1.2.2. By Filler

            14.1.2.3. By End User

    14.2. Canada

        14.2.1. Pricing Analysis

        14.2.2. Market Share Analysis, 2021

            14.2.2.1. By Material Type

            14.2.2.2. By Filler

            14.2.2.3. By End User

    14.3. Brazil

        14.3.1. Pricing Analysis

        14.3.2. Market Share Analysis, 2021

            14.3.2.1. By Material Type

            14.3.2.2. By Filler

            14.3.2.3. By End User

    14.4. Mexico

        14.4.1. Pricing Analysis

        14.4.2. Market Share Analysis, 2021

            14.4.2.1. By Material Type

            14.4.2.2. By Filler

            14.4.2.3. By End User

    14.5. Germany

        14.5.1. Pricing Analysis

        14.5.2. Market Share Analysis, 2021

            14.5.2.1. By Material Type

            14.5.2.2. By Filler

            14.5.2.3. By End User

    14.6. United Kingdom

        14.6.1. Pricing Analysis

        14.6.2. Market Share Analysis, 2021

            14.6.2.1. By Material Type

            14.6.2.2. By Filler

            14.6.2.3. By End User

    14.7. France

        14.7.1. Pricing Analysis

        14.7.2. Market Share Analysis, 2021

            14.7.2.1. By Material Type

            14.7.2.2. By Filler

            14.7.2.3. By End User

    14.8. Spain

        14.8.1. Pricing Analysis

        14.8.2. Market Share Analysis, 2021

            14.8.2.1. By Material Type

            14.8.2.2. By Filler

            14.8.2.3. By End User

    14.9. Italy

        14.9.1. Pricing Analysis

        14.9.2. Market Share Analysis, 2021

            14.9.2.1. By Material Type

            14.9.2.2. By Filler

            14.9.2.3. By End User

    14.10. China

        14.10.1. Pricing Analysis

        14.10.2. Market Share Analysis, 2021

            14.10.2.1. By Material Type

            14.10.2.2. By Filler

            14.10.2.3. By End User

    14.11. Japan

        14.11.1. Pricing Analysis

        14.11.2. Market Share Analysis, 2021

            14.11.2.1. By Material Type

            14.11.2.2. By Filler

            14.11.2.3. By End User

    14.12. South Korea

        14.12.1. Pricing Analysis

        14.12.2. Market Share Analysis, 2021

            14.12.2.1. By Material Type

            14.12.2.2. By Filler

            14.12.2.3. By End User

    14.13. Malaysia

        14.13.1. Pricing Analysis

        14.13.2. Market Share Analysis, 2021

            14.13.2.1. By Material Type

            14.13.2.2. By Filler

            14.13.2.3. By End User

    14.14. Singapore

        14.14.1. Pricing Analysis

        14.14.2. Market Share Analysis, 2021

            14.14.2.1. By Material Type

            14.14.2.2. By Filler

            14.14.2.3. By End User

    14.15. Australia

        14.15.1. Pricing Analysis

        14.15.2. Market Share Analysis, 2021

            14.15.2.1. By Material Type

            14.15.2.2. By Filler

            14.15.2.3. By End User

    14.16. New Zealand

        14.16.1. Pricing Analysis

        14.16.2. Market Share Analysis, 2021

            14.16.2.1. By Material Type

            14.16.2.2. By Filler

            14.16.2.3. By End User

    14.17. GCC Countries

        14.17.1. Pricing Analysis

        14.17.2. Market Share Analysis, 2021

            14.17.2.1. By Material Type

            14.17.2.2. By Filler

            14.17.2.3. By End User

    14.18. South Africa

        14.18.1. Pricing Analysis

        14.18.2. Market Share Analysis, 2021

            14.18.2.1. By Material Type

            14.18.2.2. By Filler

            14.18.2.3. By End User

    14.19. Israel

        14.19.1. Pricing Analysis

        14.19.2. Market Share Analysis, 2021

            14.19.2.1. By Material Type

            14.19.2.2. By Filler

            14.19.2.3. By End User

15. Market Structure Analysis

    15.1. Competition Dashboard

    15.2. Competition Benchmarking

    15.3. Market Share Analysis of Top Players

        15.3.1. By Regional

        15.3.2. By Material Type

        15.3.3. By Filler

        15.3.4. By End User

16. Competition Analysis

    16.1. Competition Deep Dive

        16.1.1. Boston Scientific Corporation

            16.1.1.1. Overview

            16.1.1.2. Product Portfolio

            16.1.1.3. Profitability by Market Segments

            16.1.1.4. Sales Footprint

            16.1.1.5. Strategy Overview

                16.1.1.5.1. Marketing Strategy

        16.1.2. C. R. Bard, Inc.

            16.1.2.1. Overview

            16.1.2.2. Product Portfolio

            16.1.2.3. Profitability by Market Segments

            16.1.2.4. Sales Footprint

            16.1.2.5. Strategy Overview

                16.1.2.5.1. Marketing Strategy

        16.1.3. Coloplast Ltd.

            16.1.3.1. Overview

            16.1.3.2. Product Portfolio

            16.1.3.3. Profitability by Market Segments

            16.1.3.4. Sales Footprint

            16.1.3.5. Strategy Overview

                16.1.3.5.1. Marketing Strategy

        16.1.4. Cook Medical, Inc.

            16.1.4.1. Overview

            16.1.4.2. Product Portfolio

            16.1.4.3. Profitability by Market Segments

            16.1.4.4. Sales Footprint

            16.1.4.5. Strategy Overview

                16.1.4.5.1. Marketing Strategy

        16.1.5. Jiangsu ChangMei Medtech Co., Ltd.

            16.1.5.1. Overview

            16.1.5.2. Product Portfolio

            16.1.5.3. Profitability by Market Segments

            16.1.5.4. Sales Footprint

            16.1.5.5. Strategy Overview

                16.1.5.5.1. Marketing Strategy

        16.1.6. iVascular SLU

            16.1.6.1. Overview

            16.1.6.2. Product Portfolio

            16.1.6.3. Profitability by Market Segments

            16.1.6.4. Sales Footprint

            16.1.6.5. Strategy Overview

                16.1.6.5.1. Marketing Strategy

        16.1.7. Med Pro Medical B.V.

            16.1.7.1. Overview

            16.1.7.2. Product Portfolio

            16.1.7.3. Profitability by Market Segments

            16.1.7.4. Sales Footprint

            16.1.7.5. Strategy Overview

                16.1.7.5.1. Marketing Strategy

        16.1.8. NuAngle

            16.1.8.1. Overview

            16.1.8.2. Product Portfolio

            16.1.8.3. Profitability by Market Segments

            16.1.8.4. Sales Footprint

            16.1.8.5. Strategy Overview

                16.1.8.5.1. Marketing Strategy

        16.1.9. Teleflex Incorporated

            16.1.9.1. Overview

            16.1.9.2. Product Portfolio

            16.1.9.3. Profitability by Market Segments

            16.1.9.4. Sales Footprint

            16.1.9.5. Strategy Overview

                16.1.9.5.1. Marketing Strategy

        16.1.10. Medorah Meditek Pvt. Ltd.

            16.1.10.1. Overview

            16.1.10.2. Product Portfolio

            16.1.10.3. Profitability by Market Segments

            16.1.10.4. Sales Footprint

            16.1.10.5. Strategy Overview

                16.1.10.5.1. Marketing Strategy

17. Assumptions & Acronyms Used

18. Research Methodology

List of Tables

Table 1: Global Market Value (US$ Million) Forecast by Region, 2016 to 2032

Table 2: Global Market Value (US$ Million) Forecast by Material Type, 2016 to 2032

Table 3: Global Market Value (US$ Million) Forecast by Filler, 2016 to 2032

Table 4: Global Market Value (US$ Million) Forecast by End User, 2016 to 2032

Table 5: North America Market Value (US$ Million) Forecast by Country, 2016 to 2032

Table 6: North America Market Value (US$ Million) Forecast by Material Type, 2016 to 2032

Table 7: North America Market Value (US$ Million) Forecast by Filler, 2016 to 2032

Table 8: North America Market Value (US$ Million) Forecast by End User, 2016 to 2032

Table 9: Latin America Market Value (US$ Million) Forecast by Country, 2016 to 2032

Table 10: Latin America Market Value (US$ Million) Forecast by Material Type, 2016 to 2032

Table 11: Latin America Market Value (US$ Million) Forecast by Filler, 2016 to 2032

Table 12: Latin America Market Value (US$ Million) Forecast by End User, 2016 to 2032

Table 13: Europe Market Value (US$ Million) Forecast by Country, 2016 to 2032

Table 14: Europe Market Value (US$ Million) Forecast by Material Type, 2016 to 2032

Table 15: Europe Market Value (US$ Million) Forecast by Filler, 2016 to 2032

Table 16: Europe Market Value (US$ Million) Forecast by End User, 2016 to 2032

Table 17: Asia Pacific Market Value (US$ Million) Forecast by Country, 2016 to 2032

Table 18: Asia Pacific Market Value (US$ Million) Forecast by Material Type, 2016 to 2032

Table 19: Asia Pacific Market Value (US$ Million) Forecast by Filler, 2016 to 2032

Table 20: Asia Pacific Market Value (US$ Million) Forecast by End User, 2016 to 2032

Table 21: Middle East and Africa Market Value (US$ Million) Forecast by Country, 2016 to 2032

Table 22: Middle East and Africa Market Value (US$ Million) Forecast by Material Type, 2016 to 2032

Table 23: Middle East and Africa Market Value (US$ Million) Forecast by Filler, 2016 to 2032

Table 24: Middle East and Africa Market Value (US$ Million) Forecast by End User, 2016 to 2032

List of Charts

Figure 1: Global Market Value (US$ Million) by Material Type, 2022 to 2032

Figure 2: Global Market Value (US$ Million) by Filler, 2022 to 2032

Figure 3: Global Market Value (US$ Million) by End User, 2022 to 2032

Figure 4: Global Market Value (US$ Million) by Region, 2022 to 2032

Figure 5: Global Market Value (US$ Million) Analysis by Region, 2016 to 2032

Figure 6: Global Market Value Share (%) and BPS Analysis by Region, 2022 to 2032

Figure 7: Global Market Y-o-Y Growth (%) Projections by Region, 2022 to 2032

Figure 8: Global Market Value (US$ Million) Analysis by Material Type, 2016 to 2032

Figure 9: Global Market Value Share (%) and BPS Analysis by Material Type, 2022 to 2032

Figure 10: Global Market Y-o-Y Growth (%) Projections by Material Type, 2022 to 2032

Figure 11: Global Market Value (US$ Million) Analysis by Filler, 2016 to 2032

Figure 12: Global Market Value Share (%) and BPS Analysis by Filler, 2022 to 2032

Figure 13: Global Market Y-o-Y Growth (%) Projections by Filler, 2022 to 2032

Figure 14: Global Market Value (US$ Million) Analysis by End User, 2016 to 2032

Figure 15: Global Market Value Share (%) and BPS Analysis by End User, 2022 to 2032

Figure 16: Global Market Y-o-Y Growth (%) Projections by End User, 2022 to 2032

Figure 17: Global Market Attractiveness by Material Type, 2022 to 2032

Figure 18: Global Market Attractiveness by Filler, 2022 to 2032

Figure 19: Global Market Attractiveness by End User, 2022 to 2032

Figure 20: Global Market Attractiveness by Region, 2022 to 2032

Figure 21: North America Market Value (US$ Million) by Material Type, 2022 to 2032

Figure 22: North America Market Value (US$ Million) by Filler, 2022 to 2032

Figure 23: North America Market Value (US$ Million) by End User, 2022 to 2032

Figure 24: North America Market Value (US$ Million) by Country, 2022 to 2032

Figure 25: North America Market Value (US$ Million) Analysis by Country, 2016 to 2032

Figure 26: North America Market Value Share (%) and BPS Analysis by Country, 2022 to 2032

Figure 27: North America Market Y-o-Y Growth (%) Projections by Country, 2022 to 2032

Figure 28: North America Market Value (US$ Million) Analysis by Material Type, 2016 to 2032

Figure 29: North America Market Value Share (%) and BPS Analysis by Material Type, 2022 to 2032

Figure 30: North America Market Y-o-Y Growth (%) Projections by Material Type, 2022 to 2032

Figure 31: North America Market Value (US$ Million) Analysis by Filler, 2016 to 2032

Figure 32: North America Market Value Share (%) and BPS Analysis by Filler, 2022 to 2032

Figure 33: North America Market Y-o-Y Growth (%) Projections by Filler, 2022 to 2032

Figure 34: North America Market Value (US$ Million) Analysis by End User, 2016 to 2032

Figure 35: North America Market Value Share (%) and BPS Analysis by End User, 2022 to 2032

Figure 36: North America Market Y-o-Y Growth (%) Projections by End User, 2022 to 2032

Figure 37: North America Market Attractiveness by Material Type, 2022 to 2032

Figure 38: North America Market Attractiveness by Filler, 2022 to 2032

Figure 39: North America Market Attractiveness by End User, 2022 to 2032

Figure 40: North America Market Attractiveness by Country, 2022 to 2032

Figure 41: Latin America Market Value (US$ Million) by Material Type, 2022 to 2032

Figure 42: Latin America Market Value (US$ Million) by Filler, 2022 to 2032

Figure 43: Latin America Market Value (US$ Million) by End User, 2022 to 2032

Figure 44: Latin America Market Value (US$ Million) by Country, 2022 to 2032

Figure 45: Latin America Market Value (US$ Million) Analysis by Country, 2016 to 2032

Figure 46: Latin America Market Value Share (%) and BPS Analysis by Country, 2022 to 2032

Figure 47: Latin America Market Y-o-Y Growth (%) Projections by Country, 2022 to 2032

Figure 48: Latin America Market Value (US$ Million) Analysis by Material Type, 2016 to 2032

Figure 49: Latin America Market Value Share (%) and BPS Analysis by Material Type, 2022 to 2032

Figure 50: Latin America Market Y-o-Y Growth (%) Projections by Material Type, 2022 to 2032

Figure 51: Latin America Market Value (US$ Million) Analysis by Filler, 2016 to 2032

Figure 52: Latin America Market Value Share (%) and BPS Analysis by Filler, 2022 to 2032

Figure 53: Latin America Market Y-o-Y Growth (%) Projections by Filler, 2022 to 2032

Figure 54: Latin America Market Value (US$ Million) Analysis by End User, 2016 to 2032

Figure 55: Latin America Market Value Share (%) and BPS Analysis by End User, 2022 to 2032

Figure 56: Latin America Market Y-o-Y Growth (%) Projections by End User, 2022 to 2032

Figure 57: Latin America Market Attractiveness by Material Type, 2022 to 2032

Figure 58: Latin America Market Attractiveness by Filler, 2022 to 2032

Figure 59: Latin America Market Attractiveness by End User, 2022 to 2032

Figure 60: Latin America Market Attractiveness by Country, 2022 to 2032

Figure 61: Europe Market Value (US$ Million) by Material Type, 2022 to 2032

Figure 62: Europe Market Value (US$ Million) by Filler, 2022 to 2032

Figure 63: Europe Market Value (US$ Million) by End User, 2022 to 2032

Figure 64: Europe Market Value (US$ Million) by Country, 2022 to 2032

Figure 65: Europe Market Value (US$ Million) Analysis by Country, 2016 to 2032

Figure 66: Europe Market Value Share (%) and BPS Analysis by Country, 2022 to 2032

Figure 67: Europe Market Y-o-Y Growth (%) Projections by Country, 2022 to 2032

Figure 68: Europe Market Value (US$ Million) Analysis by Material Type, 2016 to 2032

Figure 69: Europe Market Value Share (%) and BPS Analysis by Material Type, 2022 to 2032

Figure 70: Europe Market Y-o-Y Growth (%) Projections by Material Type, 2022 to 2032

Figure 71: Europe Market Value (US$ Million) Analysis by Filler, 2016 to 2032

Figure 72: Europe Market Value Share (%) and BPS Analysis by Filler, 2022 to 2032

Figure 73: Europe Market Y-o-Y Growth (%) Projections by Filler, 2022 to 2032

Figure 74: Europe Market Value (US$ Million) Analysis by End User, 2016 to 2032

Figure 75: Europe Market Value Share (%) and BPS Analysis by End User, 2022 to 2032

Figure 76: Europe Market Y-o-Y Growth (%) Projections by End User, 2022 to 2032

Figure 77: Europe Market Attractiveness by Material Type, 2022 to 2032

Figure 78: Europe Market Attractiveness by Filler, 2022 to 2032

Figure 79: Europe Market Attractiveness by End User, 2022 to 2032

Figure 80: Europe Market Attractiveness by Country, 2022 to 2032

Figure 81: Asia Pacific Market Value (US$ Million) by Material Type, 2022 to 2032

Figure 82: Asia Pacific Market Value (US$ Million) by Filler, 2022 to 2032

Figure 83: Asia Pacific Market Value (US$ Million) by End User, 2022 to 2032

Figure 84: Asia Pacific Market Value (US$ Million) by Country, 2022 to 2032

Figure 85: Asia Pacific Market Value (US$ Million) Analysis by Country, 2016 to 2032

Figure 86: Asia Pacific Market Value Share (%) and BPS Analysis by Country, 2022 to 2032

Figure 87: Asia Pacific Market Y-o-Y Growth (%) Projections by Country, 2022 to 2032

Figure 88: Asia Pacific Market Value (US$ Million) Analysis by Material Type, 2016 to 2032

Figure 89: Asia Pacific Market Value Share (%) and BPS Analysis by Material Type, 2022 to 2032

Figure 90: Asia Pacific Market Y-o-Y Growth (%) Projections by Material Type, 2022 to 2032

Figure 91: Asia Pacific Market Value (US$ Million) Analysis by Filler, 2016 to 2032

Figure 92: Asia Pacific Market Value Share (%) and BPS Analysis by Filler, 2022 to 2032

Figure 93: Asia Pacific Market Y-o-Y Growth (%) Projections by Filler, 2022 to 2032

Figure 94: Asia Pacific Market Value (US$ Million) Analysis by End User, 2016 to 2032

Figure 95: Asia Pacific Market Value Share (%) and BPS Analysis by End User, 2022 to 2032

Figure 96: Asia Pacific Market Y-o-Y Growth (%) Projections by End User, 2022 to 2032

Figure 97: Asia Pacific Market Attractiveness by Material Type, 2022 to 2032

Figure 98: Asia Pacific Market Attractiveness by Filler, 2022 to 2032

Figure 99: Asia Pacific Market Attractiveness by End User, 2022 to 2032

Figure 100: Asia Pacific Market Attractiveness by Country, 2022 to 2032

Figure 101: Middle East and Africa Market Value (US$ Million) by Material Type, 2022 to 2032

Figure 102: Middle East and Africa Market Value (US$ Million) by Filler, 2022 to 2032

Figure 103: Middle East and Africa Market Value (US$ Million) by End User, 2022 to 2032

Figure 104: Middle East and Africa Market Value (US$ Million) by Country, 2022 to 2032

Figure 105: Middle East and Africa Market Value (US$ Million) Analysis by Country, 2016 to 2032

Figure 106: Middle East and Africa Market Value Share (%) and BPS Analysis by Country, 2022 to 2032

Figure 107: Middle East and Africa Market Y-o-Y Growth (%) Projections by Country, 2022 to 2032

Figure 108: Middle East and Africa Market Value (US$ Million) Analysis by Material Type, 2016 to 2032

Figure 109: Middle East and Africa Market Value Share (%) and BPS Analysis by Material Type, 2022 to 2032

Figure 110: Middle East and Africa Market Y-o-Y Growth (%) Projections by Material Type, 2022 to 2032

Figure 111: Middle East and Africa Market Value (US$ Million) Analysis by Filler, 2016 to 2032

Figure 112: Middle East and Africa Market Value Share (%) and BPS Analysis by Filler, 2022 to 2032

Figure 113: Middle East and Africa Market Y-o-Y Growth (%) Projections by Filler, 2022 to 2032

Figure 114: Middle East and Africa Market Value (US$ Million) Analysis by End User, 2016 to 2032

Figure 115: Middle East and Africa Market Value Share (%) and BPS Analysis by End User, 2022 to 2032

Figure 116: Middle East and Africa Market Y-o-Y Growth (%) Projections by End User, 2022 to 2032

Figure 117: Middle East and Africa Market Attractiveness by Material Type, 2022 to 2032

Figure 118: Middle East and Africa Market Attractiveness by Filler, 2022 to 2032

Figure 119: Middle East and Africa Market Attractiveness by End User, 2022 to 2032

Figure 120: Middle East and Africa Market Attractiveness by Country, 2022 to 2032

Recommendations

Healthcare

DNA/RNA Extraction Market

Published : June 2023

Healthcare

Stent Graft Balloon Catheter Market

Published : November 2022

Healthcare

Acute Kidney Injury Treatment Market

Published : July 2022

Explore Healthcare Insights

View Reports

Kidney Stone Extraction Balloon Market