The gemstone market is likely to grow from USD 36,044.1 million in 2025 to USD 68,297.7 million by 2035, representing substantial growth and demonstrating the accelerating adoption of colored gemstones and the optimization of jewelry design across fine jewelry manufacturing, luxury art collections, and ornamental applications.
The gemstone supply chain operates through an intricate network that links mining regions, cutting hubs, and certification bodies to luxury brands and retailers. Africa, South America, and Asia continue to dominate global gemstone sourcing, with countries like Zambia, Mozambique, Colombia, and Sri Lanka providing a consistent supply of both precious and semi-precious stones. These regions are critical not only for natural gemstone mining but also for fostering initiatives that promote traceable and ethical extraction processes.
Processing and cutting hubs play an essential role in value addition, where precision and craftsmanship directly determine final market valuation. India, particularly Surat and Jaipur, remains the global leader in gemstone cutting and polishing, supported by advanced lapidary infrastructure. Thailand is recognized for its specialization in colored gemstones, while Belgium, particularly Antwerp, retains its dominance in high-end diamond cutting and global distribution networks.
Ethical sourcing mechanisms are gaining prominence as consumer awareness and luxury brand accountability increase. Blockchain-based systems are being deployed to ensure mine-to-market transparency, eliminating the risk of conflict stones and fraudulent labeling. Responsible mining certifications, such as the Responsible Jewelry Council (RJC) and Fairmined standards, are being adopted as prerequisites for trade participation in high-value gemstone transactions.
The rise of lab-grown gemstone production marks a defining transformation in the supply structure. Technologies such as Chemical Vapor Deposition (CVD) and High-Pressure High-Temperature (HPHT) methods are enabling scalable, cost-effective, and traceable gemstone synthesis. These production models not only shorten the supply chain but also appeal to a segment of consumers seeking ethically produced, sustainable luxury products. As these synthetic processes achieve greater precision and color consistency, they are increasingly integrated into mainstream jewelry lines, signaling a long-term coexistence between mined and lab-grown gemstones in the global supply ecosystem.
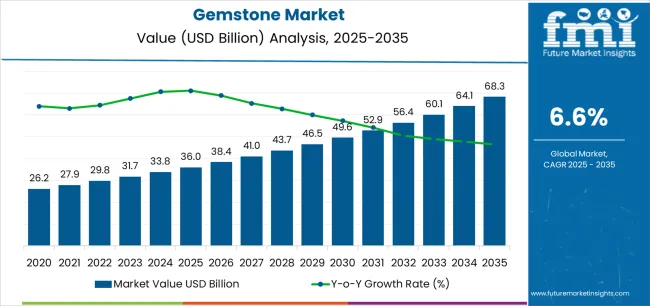
Where revenue comes from - now vs next (industry-level view)
| Period | Primary Revenue Buckets | Share | Notes |
|---|---|---|---|
| Today | Natural gemstone rough sales (mining output) | 42% | Mine-to-market, rough stone auctions |
| Cut & polished gemstone sales | 35% | Jewelry manufacturing, retail distribution | |
| Fine jewelry retail (gemstone-set) | 15% | Luxury brands, independent jewelers | |
| Investment-grade stones | 8% | Collector market, wealth preservation | |
| Future (3-5 yrs) | Ethically certified natural gemstones | 35-40% | Traceable sourcing, sustainability premiums |
| Lab-grown gemstone alternatives | 20-25% | Affordable luxury, millennials & Gen Z | |
| Luxury jewelry & high-end ornaments | 18-22% | Designer collaborations, branded collections | |
| Investment & collector market | 12-16% | Rare stones, auction houses, wealth diversification | |
| Digital gemstone authentication | 8-12% | Blockchain verification, NFT-linked physical gems | |
| Custom & bespoke jewelry services | 5-8% | Personalization, direct-to-consumer brands |
| Metric | Value |
|---|---|
| Market Value (2025) | USD 36,044.1 million |
| Market Forecast (2035) | USD 68,297.7 million |
| Growth Rate | 6.6% CAGR |
| Leading Technology | Ruby |
| Primary Application | Jewelry & Ornaments |
The market demonstrates strong fundamentals with ruby capturing a dominant share through timeless appeal and investment value optimization. Jewelry and ornaments applications drive primary demand, supported by increasing luxury consumption and gemstone appreciation requirements. Geographic expansion remains concentrated in developed markets with established luxury goods infrastructure, while emerging economies show accelerating adoption rates driven by wealth creation initiatives and rising jewelry ownership standards.
Primary Classification: The market segments by product type into emerald, ruby, opal, sapphire, and spinel, representing the evolution from traditional precious stones to diverse colored gemstone options for comprehensive jewelry and luxury applications.
Secondary Classification: Application segmentation divides the market into jewelry & ornaments and luxury art sectors, reflecting distinct requirements for wearability, aesthetic display, and investment value standards.
Tertiary Classification: Regional distribution covers North America, Latin America, Western Europe, Eastern Europe, East Asia, South Asia Pacific, and Middle East & Africa, with developed markets leading adoption while emerging economies show accelerating growth patterns driven by wealth expansion and luxury consumption programs.
The segmentation structure reveals market progression from classical precious stone categories toward diverse colored gemstone appreciation with enhanced design versatility and investment potential, while application diversity spans from personal adornment jewelry to museum-quality art pieces requiring exceptional gemstone specimens.
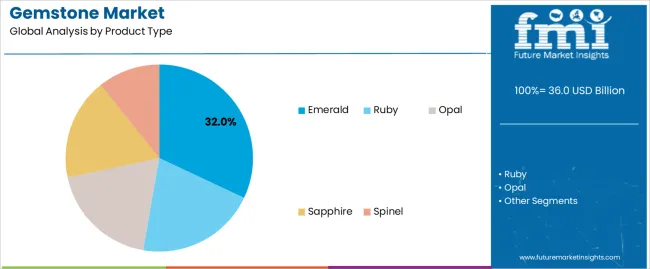
Market Position: Ruby commands the leading position in the gemstone market with 32% market share through superior value features, including exceptional color saturation, historical prestige, and investment appreciation that enable collectors and jewelry enthusiasts to achieve optimal luxury positioning across diverse fine jewelry and collection applications.
Value Drivers: The segment benefits from consumer preference for traditional precious stones that provide timeless appeal, wealth preservation characteristics, and cultural significance without requiring extensive gemstone knowledge. Advanced sourcing features enable Burmese pigeon blood quality, heat treatment enhancement, and integration with platinum and gold settings, where rarity and color intensity represent critical value requirements.
Competitive Advantages: Ruby differentiates through proven investment performance, cultural symbolism across Asian markets, and compatibility with heritage jewelry designs that enhance aesthetic impact while maintaining optimal value retention suitable for diverse bridal jewelry and heirloom collection applications.
Key market characteristics:
Emerald maintains a 24% market position in the gemstone market due to distinctive green coloration and historical significance advantages. These gemstones appeal to collectors requiring vivid color with garden inclusion character for luxury applications. Market presence is sustained by Colombian production excellence, emphasizing color saturation and transparency through specialized mining and cutting techniques.
Sapphire captures 22% market share through color variety requirements in blue, pink, yellow, and padparadscha applications, engagement ring popularity, and royal heritage associations. These consumers demand durable gemstones capable of daily wear while providing color options and Kashmir-quality rarities.
Opal accounts for 12% market share through play-of-color requirements in black opal, boulder opal, and fire opal applications requiring unique optical effects with Australian origin premiums and artistic jewelry designs.
Spinel captures 10% market share through color range diversity, mistaken ruby history, and growing collector appreciation requiring affordable alternatives with exceptional brilliance and untreated natural coloration.
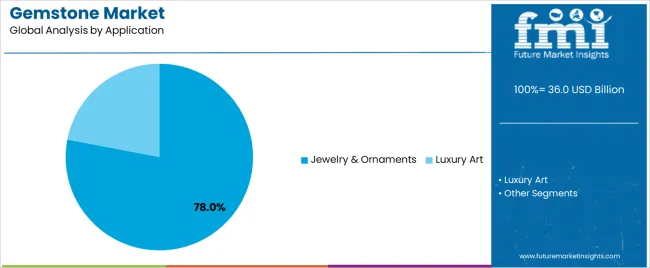
Market Position: Jewelry & Ornaments command dominant market presence with 78% share through personal adornment requirements that demand wearable gemstone applications in rings, necklaces, earrings, and bracelets for luxury fashion and special occasions.
Value Drivers: This application category addresses consumer desire for beauty, status expression, emotional significance, and investment diversification through gemstone jewelry ownership and inheritance traditions.
Growth Characteristics: The segment benefits from wedding industry demand, luxury fashion trends, and cultural jewelry traditions that support sustained gemstone consumption and fine jewelry market advancement.
Luxury Art applications capture 22% market share through museum-quality specimens, decorative objets d'art, and exceptional gemstone carvings requiring investment-grade stones with artistic display and wealth preservation characteristics.
| Category | Factor | Impact | Why It Matters |
|---|---|---|---|
| Driver | Wealth expansion & luxury consumption growth (emerging market affluence, UHNW individuals) | ★★★★★ | Rising disposable incomes drive gemstone demand; emerging market consumers seek luxury goods and wealth preservation through tangible assets like rare gemstones. |
| Driver | Bridal jewelry demand & engagement ring traditions (millennial marriages, cultural ceremonies) | ★★★★★ | Wedding industry drives colored gemstone adoption; consumers increasingly choose sapphires, emeralds, and rubies over traditional diamond engagement rings for uniqueness. |
| Driver | Ethical sourcing & transparency demands (conflict-free certification, responsible mining) | ★★★★☆ | Consumer consciousness creates premium for ethical gemstones; traceable supply chains and fair labor practices influence purchasing decisions among younger buyers. |
| Restraint | Supply constraints & mining depletion (finite deposits, declining quality, extraction challenges) | ★★★★☆ | Premium gemstone sources face exhaustion; legendary mines like Burma rubies and Kashmir sapphires produce declining outputs, constraining supply and inflating prices. |
| Restraint | Treatment disclosure & synthetic competition (lab-grown alternatives, heat treatment prevalence) | ★★★☆☆ | Natural gemstone values challenged by synthetics; lab-grown alternatives offer identical appearance at fraction of cost, creating consumer confusion and market segmentation. |
| Trend | Lab-grown gemstone acceptance (affordable luxury, ethical positioning, millennial preferences) | ★★★★★ | Synthetic gemstones gain market share; technologically identical alternatives appeal to budget-conscious and ethics-focused consumers, especially for larger carat weights. |
| Trend | Blockchain & digital certification (provenance tracking, NFT integration, anti-counterfeiting) | ★★★★☆ | Digital technologies transform authentication; blockchain-tracked gemstones provide immutable provenance records, while NFTs link physical stones to digital ownership certificates. |
The gemstone market demonstrates varied regional dynamics with Growth Leaders including China (8.9% growth rate) and India (8.3% growth rate) driving expansion through luxury consumption growth and jewelry manufacturing development. Steady Performers encompass Germany (7.6% growth rate), United States (6.3% growth rate), and developed regions, benefiting from established luxury markets and gemstone appreciation culture. Emerging Markets feature developing regions where wealth creation and jewelry tradition support consistent growth patterns.
Regional synthesis reveals East Asian markets leading adoption through luxury brand consumption and gemstone investment culture, while South Asian countries maintain strong expansion supported by jewelry manufacturing excellence and cultural ornament traditions. European markets show substantial growth driven by luxury tourism and heritage jewelry appreciation.
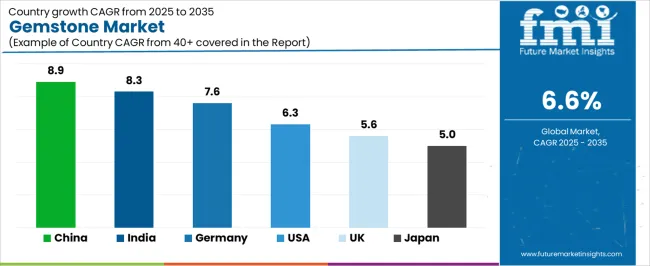
| Region/Country | 2025-2035 Growth | How to win | What to watch out |
|---|---|---|---|
| China | 8.9% | Focus on investment-grade stones; luxury brand partnerships | Economic volatility; regulatory changes; synthetic acceptance |
| India | 8.3% | Lead with jewelry manufacturing; cultural celebrations | Gold competition; price sensitivity; import duties |
| Germany | 7.6% | Emphasize ethical sourcing; museum-quality pieces | Economic uncertainty; luxury spending cycles |
| United States | 6.3% | Push colored gemstone engagement rings; designer collections | Synthetic competition; diamond industry pushback |
| UK | 5.6% | Offer royal heritage connections; auction market access | Economic challenges; luxury market saturation |
| Japan | 5.0% | Premium positioning; rare stone specialization | Aging demographics; conservative preferences |
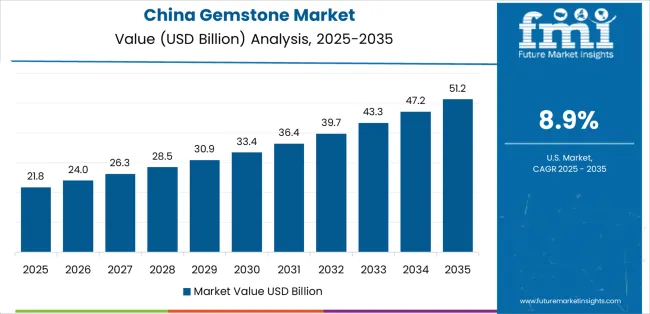
China establishes fastest market growth through explosive luxury consumption expansion and comprehensive wealth creation development, integrating gemstones as standard components in investment portfolios and luxury jewelry collections. The country's 8.9% growth rate reflects economic prosperity and cultural appreciation for colored gemstones that encourage the acquisition of ruby, emerald, and sapphire jewelry in high-net-worth and aspirational consumer segments. Growth concentrates in major cities, including Beijing, Shanghai, and Shenzhen, where luxury retail development showcases high-end jewelry boutiques that appeal to consumers seeking status symbols and investment-grade gemstones for wealth preservation applications.
Chinese luxury consumers are adopting gemstone jewelry that combines international luxury brand prestige with traditional Chinese aesthetic preferences, including jadeite integration and auspicious color combinations. Distribution channels through luxury shopping districts and authorized brand boutiques expand market access, while cultural gifting traditions support adoption across diverse bridal jewelry and business gift segments.
Strategic Market Indicators:
In Mumbai, Jaipur, and Surat, jewelry manufacturers and gemstone traders are processing colored gemstones as standard business for domestic jewelry market and export manufacturing applications, driven by cultural jewelry traditions and government gemstone industry programs that emphasize the importance of jewelry craftsmanship. The market holds a 8.3% growth rate, supported by wedding industry demand and jewelry manufacturing hub development programs that promote gemstone cutting and jewelry fabrication for domestic and international markets. Indian consumers and manufacturers are acquiring gemstones that provide cultural significance and manufacturing value, particularly appealing in regions where wedding jewelry and religious ornaments represent essential cultural expenditures.
Market expansion benefits from established jewelry manufacturing infrastructure and growing middle-class purchasing power that enable widespread gemstone consumption for wedding jewelry and daily wear applications. Technology adoption follows patterns established in jewelry industry, where traditional craftsmanship and cultural preferences drive design development and product positioning.
Market Intelligence Brief:
Germany establishes market leadership through comprehensive luxury goods appreciation and advanced gemstone trading infrastructure development, integrating colored gemstones across fine jewelry retailers and museum collections. The country's 7.6% growth rate reflects established luxury consumption culture and mature gemstone appreciation that supports widespread purchase of certified gemstones in jewelry stores and auction houses. Growth concentrates in major cities, including Munich, Hamburg, and Frankfurt, where luxury retail showcases high-end gemstone jewelry that appeals to consumers seeking ethical sourcing and investment-grade specimens for collection applications.
German luxury retailers leverage established jewelry distribution networks and comprehensive gemological certification capabilities, including ethical sourcing verification and gemstone authentication that create consumer confidence and quality assurance. The market benefits from mature luxury standards and consumer protection regulations that support certified gemstone adoption while encouraging transparency and sustainable sourcing advancement.
Market Intelligence Brief:
United States demonstrates strong gemstone market adoption with 6.3% growth rate, driven by colored gemstone engagement ring trends and celebrity influence. Major luxury markets including New York, Los Angeles, and Miami showcase fine jewelry retailers where colored gemstones provide alternatives to traditional diamond jewelry and unique personalization options for engagement rings, anniversary gifts, and statement jewelry. The market benefits from established luxury retail infrastructure, influential fashion media coverage, and growing consumer interest in gemstone individuality and ethical alternatives. American consumers prioritize uniqueness, quality certification, and designer brand associations for gemstone purchases.
Distribution patterns favor luxury department stores and independent fine jewelers with gemological expertise, while online luxury retailers serve convenience-focused consumers through virtual consultation and home try-on programs. Market growth concentrates in engagement jewelry and luxury fashion segments where colored gemstones justify premium pricing and designer positioning.
Market Intelligence Brief:
United Kingdom's luxury market demonstrates mature gemstone adoption with 5.6% growth rate, supported by royal jewelry heritage and established auction market presence. Major luxury centers including London's Hatton Garden, Bond Street boutiques, and international auction houses showcase exceptional gemstones where historical provenance and royal associations provide premium positioning for colored gemstone jewelry and investment-grade specimens. The market benefits from established gemstone trade history, influential auction results setting price benchmarks, and cultural appreciation for vintage and antique jewelry featuring colored gemstones.
British consumers prioritize provenance documentation, historical significance, and proven investment performance in gemstone acquisitions. Distribution channels through heritage jewelers, auction houses, and luxury boutiques expand market access for both contemporary and estate jewelry featuring colored gemstones.
Strategic Market Considerations:
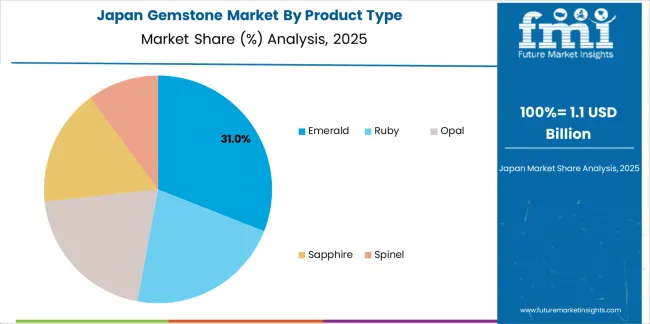
Japan's market expansion benefits from luxury brand appreciation, including high-end jewelry in Tokyo and Osaka, cultural gift-giving traditions, and collector programs that increasingly incorporate gemstones for luxury purchases. The country maintains a 5.0% growth rate, driven by quality consciousness and appreciation for rare gemstones with exceptional beauty and craftsmanship.
Market dynamics focus on premium gemstone jewelry that balances aesthetic perfection with brand prestige important to Japanese luxury consumers. Growing interest in Western jewelry styles creates continued demand for colored gemstones in engagement rings and fashion jewelry alongside traditional pearl preferences.
Strategic Market Considerations:
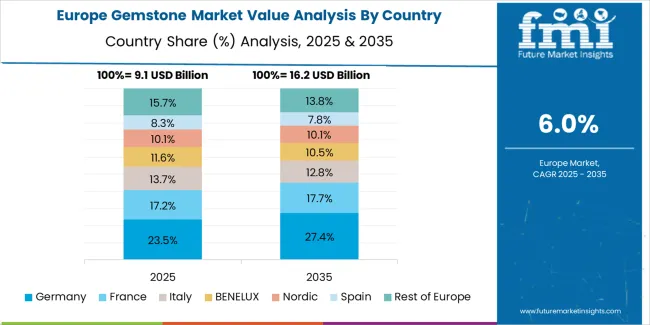
The gemstone market in Europe is projected to grow from USD 12,676.7 million in 2025 to USD 24,268.4 million by 2035, registering a CAGR of 6.7% over the forecast period. Germany is expected to maintain its leadership position with a 28.4% market share in 2025, supported by its advanced luxury retail infrastructure and major gemstone trading centers in Munich, Hamburg, and Frankfurt.
United Kingdom follows with a 23.6% share in 2025, driven by comprehensive auction market activity and heritage jewelry appreciation. France holds a 19.8% share through haute joaillerie excellence and luxury brand headquarters positioning. Italy commands a 14.7% share, while Spain accounts for 13.5% in 2025. The rest of Europe region is anticipated to gain momentum, expanding its collective share from 8.4% to 9.6% by 2035, attributed to increasing gemstone jewelry adoption in Nordic countries and emerging Eastern European luxury markets implementing wealth expansion programs.
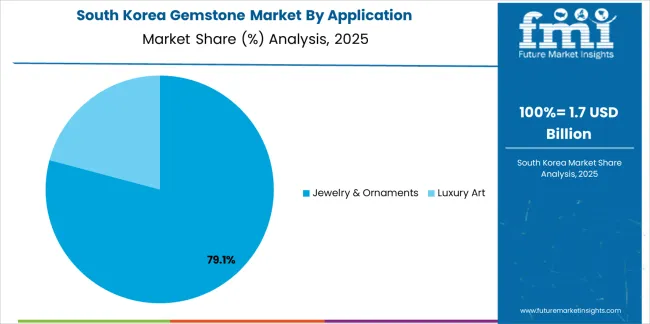
South Korea demonstrates growing gemstone market adoption with 7.2% growth rate, driven by luxury brand consumption and K-pop celebrity influence. Major shopping districts including Seoul's Gangnam, Myeongdong, and duty-free zones showcase international luxury jewelry brands where colored gemstones provide fashion-forward alternatives and investment pieces for affluent Korean consumers influenced by celebrity endorsements and social media trends. The market benefits from high luxury brand penetration, strong social media engagement driving jewelry trends, and cultural emphasis on appearance and status display through luxury goods ownership.
Korean consumers prioritize brand authentication, contemporary designs, and celebrity-inspired jewelry styles featuring colored gemstones. Market growth reflects both domestic luxury consumption and Chinese tourist purchases at duty-free retailers. Distribution channels through luxury brand flagship stores and duty-free shopping centers serve local affluent consumers and international tourists, while growing interest in fine jewelry investment creates collector opportunities. Celebrity partnerships between Korean entertainment stars and international jewelry brands facilitate gemstone jewelry promotion optimized for younger luxury consumers including branded collections, limited editions, and social media marketing campaigns featuring colored gemstone jewelry aligned with K-pop fashion aesthetics and luxury lifestyle aspirations driving gemstone awareness among millennial and Gen Z demographics.
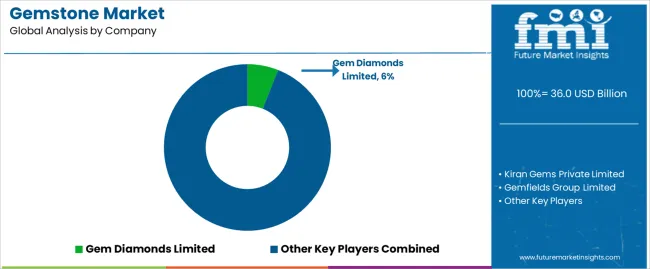
The gemstone market demonstrates fragmented competitive dynamics with numerous mining companies, trading houses, cutting centers, and retail brands globally, where top 5 players control approximately 55-60% of mining output but significantly lower percentage of overall retail value. Market leadership requires balancing multiple capabilities including mine development and operation, gemstone cutting and polishing expertise, certification and authentication services, and luxury brand positioning across diverse colored gemstone categories and geographic markets.
Structure: Competitive landscape divides between integrated mining companies controlling gem deposits and rough stone supply, specialized gemstone cutting centers providing manufacturing expertise, international trading houses connecting miners with retailers, luxury jewelry brands creating finished products, and independent dealers serving collectors and investors. Mining leaders maintain advantage through resource control and rough stone supply, while luxury brands differentiate through design excellence, brand prestige, and retail distribution commanding premium pricing power.
Leadership is maintained through: mine ownership and resource access, cutting expertise and manufacturing quality, brand prestige and luxury positioning, and distribution networks (luxury retail presence, auction house relationships, dealer networks, online platforms).
What's commoditizing: commercial-quality gemstones without exceptional characteristics, standard calibrated stones for mass jewelry production, and heat-treated gemstones without rarity premiums.
Margin Opportunities: investment-grade rare gemstones with exceptional quality, ethically certified and traceable stones commanding sustainability premiums, custom cutting and bespoke jewelry services, digital authentication and blockchain provenance, lab-grown gemstone production for affordable luxury segment, and comprehensive gemstone advisory and wealth management services.
| Stakeholder | What they actually control | Typical strengths | Typical blind spots |
|---|---|---|---|
| Integrated mining companies | Gem deposits, rough stone supply, production volumes | Resource control, supply consistency, scale advantages | Retail brand building; consumer relationships; design innovation |
| Luxury jewelry brands | Brand equity, retail distribution, finished jewelry | Consumer relationships, premium pricing, design excellence | Rough stone sourcing; supply volatility; mining operations |
| Specialized cutting centers | Manufacturing expertise, skilled labor, cutting technology | Quality optimization, yield maximization, technical capability | Brand building; consumer access; market price-setting power |
| International trading houses | Market intelligence, buyer-seller networks, financing | Supply chain connectivity, risk management, market access | Mining operations; brand retail; consumer trends |
| Independent dealers & auction houses | Rare stone access, collector relationships, market knowledge | Investment-grade focus, provenance expertise, high-value transactions | Mass market scale; mining operations; manufacturing |
Market competition intensifies around ethical sourcing verification, digital authentication integration, and lab-grown gemstone positioning. Companies investing in blockchain-tracked supply chains, comprehensive sustainability programs, and strategic lab-grown gemstone offerings position themselves advantageously for sustained market share gains. Success increasingly depends on balancing traditional gemstone mystique and rarity value with modern consumer demands for transparency, ethics, and accessible luxury that drive purchasing confidence across diverse consumer segments from investment collectors to fashion-conscious millennials.
| Item | Value |
|---|---|
| Quantitative Units | USD 36,044.1 million |
| Product Type | Emerald, Ruby, Opal, Sapphire, Spinel |
| Application | Jewelry & Ornaments, Luxury Art |
| Regions Covered | North America, Latin America, Western Europe, Eastern Europe, East Asia, South Asia Pacific, Middle East & Africa |
| Countries Covered | China, India, Germany, United States, United Kingdom, Japan, South Korea, France, Italy, UAE, and 30+ additional countries |
| Key Companies Profiled | Gem Diamonds Limited, Kiran Gems Private Limited, Gemfields Group Limited, PJSC ALROSA, Anglo American plc, Petra Diamonds Limited, Colored Gemstones Group, Fura Gems Inc., Gemesis Corporation |
| Additional Attributes | Dollar sales by product type and application categories, regional adoption trends across East Asia, South Asia Pacific, and Western Europe, competitive landscape with mining companies and luxury jewelry brands, consumer preferences for color quality and certification standards, integration with jewelry design platforms and retail distribution systems, innovations in ethical sourcing and blockchain authentication, and development of gemstone offerings with enhanced transparency and investment value optimization capabilities. |
The global gemstone market is estimated to be valued at USD 36.0 billion in 2025.
The market size for the gemstone market is projected to reach USD 68,297.7 billion by 2035.
The gemstone market is expected to grow at a 6.6% CAGR between 2025 and 2035.
The key product types in gemstone market are emerald, ruby, opal, sapphire and spinel.
In terms of application, jewelry & ornaments segment to command 78.0% share in the gemstone market in 2025.


Full Research Suite comprises of:
Market outlook & trends analysis
Interviews & case studies
Strategic recommendations
Vendor profiles & capabilities analysis
5-year forecasts
8 regions and 60+ country-level data splits
Market segment data splits
12 months of continuous data updates
DELIVERED AS:
PDF EXCEL ONLINE
Gemstone Cosmetic Powder Market Analysis - Trends, Growth & Forecast 2025 to 2035
Examining Market Share Trends in the Colored Gemstones Industry
Coloured Gemstone Market Analysis - Size, Share, and Forecast 2025 to 2035
India Colored Gemstones Market Size and Share Forecast Outlook 2025 to 2035

Thank you!
You will receive an email from our Business Development Manager. Please be sure to check your SPAM/JUNK folder too.
Chat With
MaRIA