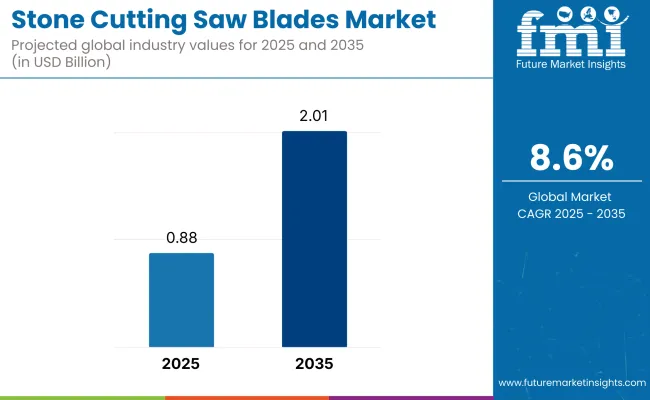
The stone cutting saw blades market is anticipated to be valued at USD 0.88 billion in 2025. It is expected to grow at a CAGR of 8.6% during the forecast period and reach a value of USD 2.01 billion in 2035.
In 2024, the global stone cutting saw blades market experienced substantial momentum, driven by escalating demand in the construction sector. Demand for precision cutting tools was also driven by a proliferation of large infrastructure works, especially urban redevelopment as well as high-rises. In addition, home renovations and remodeling that were on the rise, especially in the residential sector, contributed to industry growth.

Advancements in technology, particularly on blade materials, boosted tools' capability and improved durability, such as diamond-tipped saws and carbide-coated saws, which gave rise to more adoption. Increased government investments in smart cities and sustainable construction practices also stimulated growth in the industry.
Looking ahead to 2025 and beyond, construction activities in emerging economies will fuel the growth path of the industry. Forecasts indicate automation as well as AI-assisted cutting methods are likely to set new standards for the industry, providing for accuracy and curtailing material wastage.
Additionally, rising emphasis on eco-friendly materials and sustainable building techniques may influence product innovation. The commercial sector, especially in Asia and the Middle East, is projected to be a primary growth driver, with increasing infrastructure development initiatives. The ongoing expansion of real estate and urbanization trends worldwide will continue to fuel demand, ensuring steady industry expansion.
Surveyed Q1 2025, n=500 stakeholder participants evenly distributed across manufacturers, distributors, construction firms, and contractors in North America, Western Europe, China, and India
Regional Variance
High Variance
Divergent Views on ROI
69% of North American stakeholders deemed automation and precision engineering "worth the investment," whereas 41% of Indian firms still rely on manually operated saws.
Consensus
Diamond: Tipped Blades: Selected by 71% globally for their high durability, particularly in large-scale infrastructure projects.
Regional Variance
Shared Challenges
83% of respondents cited rising raw material costs (diamond saw grit prices up 25%, carbide materials up 17%) as a major concern.
Regional Differences
Manufacturers
Distributors
End-Users (Construction Firms & Contractors)
Alignment
73% of global manufacturers plan to invest in next-generation blade coatings to enhance longevity.
Divergence
Global Consensus
Durability, cost pressures, and technological advancements remain core industry concerns.
Regional Variances
Strategic Outlook
A region-specific approach is necessary for industry penetration, with performance-driven innovation in North America, sustainable alternatives in Western Europe, and cost-effective solutions in China and India.
| Countries | Government Regulations & Mandatory Certifications Impact |
|---|---|
| United States | The OSHA enforces workplace safety standards for stone cutting operations, requiring compliance with silica dust exposure limits. The EPA regulates emissions from manufacturing processes. Companies must adhere to ANSI B7.1 safety standards for abrasive wheels and obtain ISO 9001 for quality management. |
| Canada | CSA Group sets safety standards for industrial saw blades. The Workplace Hazardous Materials Information System (WHMIS) mandates proper labeling and handling of cutting tools. Environmental laws regulate waste disposal from blade manufacturing. Certification with CAN/CSA Z94.3 is required for safety compliance. |
| Germany | The DIN EN 847-1 standard governs tool safety for cutting blades. Compliance with CE marking is mandatory for industry entry. The BG Bau (German construction safety authority) enforces strict workplace safety laws. The Federal Emission Control Act regulates the environmental impact of manufacturing. |
| United Kingdom | The UKCA marking replaces CE marking post-Brexit, ensuring compliance with health, safety, and environmental standards. The Health and Safety Executive (HSE) enforces workplace safety regulations, especially regarding dust control and blade operation. ISO 45001 certification is recommended for occupational safety. |
| France | The AFNOR (French Standards Association) enforces safety requirements for industrial tools. The INRS (National Institute for Research and Security) mandates worker protection measures. CE certification is required for saw blade manufacturers. The Grenelle II Act imposes environmental impact regulations on production facilities. |
| China | The CCC (China Compulsory Certification) mark is mandatory for imported and locally made cutting blades. The National Safety Production Law enforces worker safety in stone cutting operations. The Ministry of Ecology and Environment regulates emissions from blade manufacturing plants. |
| India | The BIS (Bureau of Indian Standards) IS 2745 regulates the quality and safety of saw blades. The Factories Act mandates safe handling practices for industrial tools-environmental norms set by the Central Pollution Control Board (CPCB) control emissions from production facilities. |
| Japan | The JIS (Japanese Industrial Standards) B4411 governs the quality of industrial saw blades. The Ministry of Economy, Trade, and Industry (METI) enforces safety and performance standards. Workplace safety laws focus on noise and dust control in stone cutting applications. |
| Brazil | The INMETRO (National Institute of Metrology, Quality, and Technology) certification is required for saw blades. The NR-12 standard mandates safety measures for industrial machinery, including stone cutting saws. The Environmental Crimes Law enforces waste disposal regulations for manufacturers. |

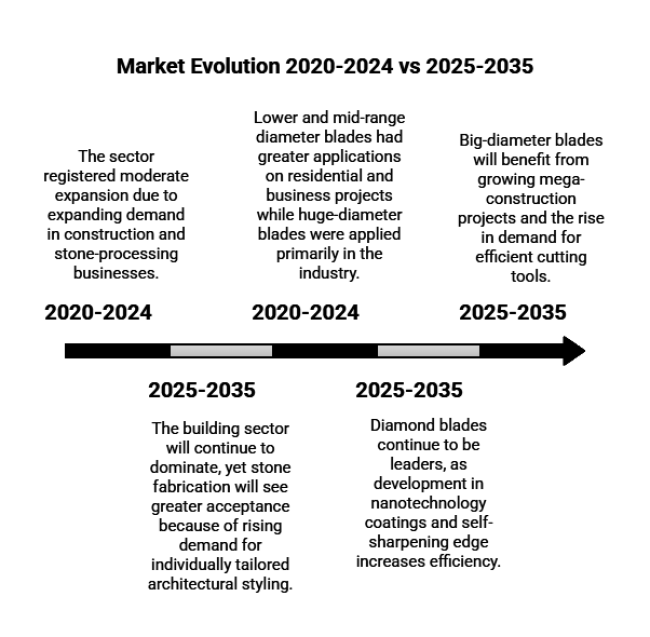
| 2020 to 2024 (Historical Analysis) | 2025 to 2035 (Future Projections) |
|---|---|
| The sector registered moderate expansion due to expanding demand in construction and stone-processing businesses. | The industry is forecast to grow at a CAGR of 8.6%, to reach USD 2.01 billion in 2035, driven by industrialization and infrastructure growth. |
| The dominant diamond blades captured the industry by virtue of better durability and effectiveness, accompanied by ongoing breakthroughs in sintered and laser-welding technologies. | Diamond blades continue to be leaders, as development in nanotechnology coatings and self-sharpening edge increases efficiency. |
| Lower and mid-range diameter blades had greater applications on residential and business projects while huge-diameter blades were applied primarily in the industry. | Big-diameter blades will benefit from growing mega-construction projects and the rise in demand for efficient cutting tools. |
| Construction industries were the biggest end-use client, as propelled by the urbanization pace and infrastructure outlays. | The building sector will continue to dominate, yet stone fabrication will see greater acceptance because of rising demand for individually tailored architectural styling. |
The diamond blades sub-segment is set to grow at a CAGR of 8.4% from 2023 to 2033, maintaining its dominance due to exceptional cutting performance, versatility, and durability. These blades are highly efficient making them good for cutting and other activities related to stone and concrete working; hence, they become the best in forming a cutting instrument with the durability of using it for several years as being cost-effective. It then encourages several businesses to use this blade because they don't need blade replacements regularly.
Existing advancements in the technology of making sintered, electroplated, and laser-welded diamond blades are facilitating the cutting precision along with the operational efficiency, leading such tools to place a stronger mark in the industry. Increased investments in high-performance cutting tools in construction, infrastructure, and industrial applications continue to ensure that diamond blades remain the preferred option in the industry until 2035 and beyond for sustained expansion in the industry.
The construction industry is projected to be the top end-user, expanding at a CAGR of 8.2% from 2025 to 2035, driven by increasing infrastructure projects worldwide. Demand for advanced cutting tools is propelled by rising urbanization and large-scale developments in residential, commercial and transportation sectors. The industry relies on granite, limestone, and marble for building façades, flooring, and road construction, thereby driving growth in the industry.
The ongoing changeover towards automated and precision cutting of stones is further adding to the expansion of the segments. Building safety regulations and sustainability measures are also acting as incentives for the adoption of advanced cutting tools with high efficiency, thereby making construction the key driving sector for cutting tools.
The medium diameter blade segment is expected to lead owing to its wide applicability in construction as well as stone fabrication. They provide the best possible combination of accuracy, longevity, and cost-effectiveness cutting granite, synthetic stone, and reinforced concrete. These blades are extensively used in handheld and table saws to perform high-precision cuts in architectural, commercial, and industrial applications.
Expansion of urban growth and megacorp commercial infrastructure projects is also increasing demand. Medium diameter blades will continue holding the industry lead, as industry needs in construction and fabrication evolve over the period to 2035, with technology advances geared to increase both blade longevity and cutting performance.

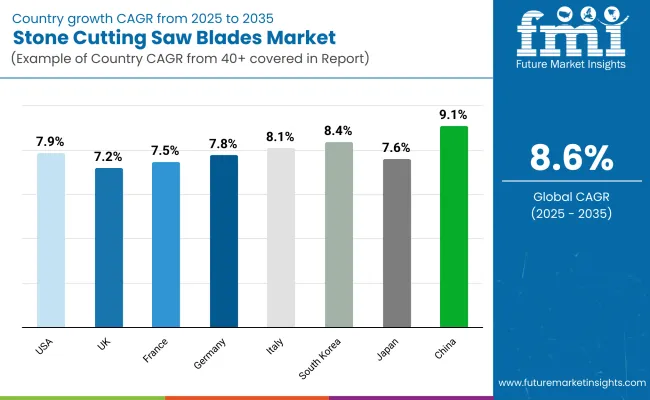
The USA stone cutting saw blades market is forecasted to expand at a CAGR of 7.9% from 2025 to 2035, driven by large-scale infrastructure projects and stringent safety regulations. The rise in residential and commercial construction, alongside increased spending on roadways and bridges, is bolstering demand for high-performance cutting tools. The Infrastructure Investment and Jobs Act (IIJA) is a key driver, allocating substantial funds for urban development and boosting sales of cutting tools used in granite, marble, and concrete applications.
Major players in the USA are increasingly investing in recyclable and sustainable blade materials, aligning with evolving EPA (Environmental Protection Agency) guidelines. Import regulations, including Section 301 tariffs on Chinese saw blades, are influencing domestic manufacturers to scale production. With technological advancements and regulatory compliance playing a pivotal role, the USA remains a lucrative hub supplier.
The UK is forecasted to expand at a CAGR of 7.2% from 2025 to 2035, driven by increasing urbanization, stringent workplace safety laws, and sustainability initiatives. With the UK Construction Strategy 2025 emphasizing infrastructure modernization, demand for high-quality cutting tools is on the rise. The UKCA (UK Conformity Assessed) marking has replaced the CE marking post-Brexit, making regulatory compliance crucial for manufacturers.
The UK’s import-dependent industry is seeing shifts due to higher tariffs on non-compliant products, creating opportunities for domestic blade manufacturers. Additionally, technological advancements such as smart saw blade integration with CNC machinery are gaining traction, enhancing operational efficiency. With sustainability and digital transformation playing key roles, the UK remains a competitive landscape for premium cutting tools.
France is forecasted to expand at a CAGR of 7.5% from 2025 to 2035, fueled by government-backed infrastructure projects and technological advancements in stone-cutting equipment. The France Reliance economic recovery plan is accelerating public sector investments in roads, bridges, and commercial real estate, increasing demand for high-precision cutting tools.
France's dominance in the luxury stone industry-especially in marble and limestone production-supports a strong demand for high-performance saw blades. Additionally, automation in stone fabrication workshops is leading to the increased use of CNC-compatible cutting tools. The rise in public-private partnerships (PPPs) in construction further enhances growth prospects. With government-led infrastructure modernization and advanced industrial techniques, France is positioned as a key hub for precision cutting tools.
Germany is forecasted to expand at a CAGR of 7.8% from 2025 to 2035, driven by a robust construction sector, strict safety regulations, and advancements in cutting-edge technology. The DIN EN 847-1 standard governs tool safety, ensuring high-quality manufacturing practices for saw blades. Compliance with CE marking remains mandatory, with additional workplace safety requirements enforced by BG Bau (German construction safety authority).
Germany’s environmental laws, particularly under the Federal Emission Control Act, impose strict regulations on blade manufacturing processes, encouraging innovation in low-dust and low-noise cutting technologies. With leading German firms focusing on precision engineering and material innovation, the country remains a hub for high-performance production.
Italy is forecasted to expand at a CAGR of 8.1% from 2025 to 2035, supported by its dominant position in the global stone-processing industry. With Italy being a leader in marble and granite production, demand for high-precision saw blades is continuously rising. The Made in Italy certification ensures product quality and export competitiveness, making local manufacturers key players in the international industry.
Italy’s high-end architectural sector relies on precision-cut stones, fostering innovation in CNC-compatible and laser-guided cutting tools. Additionally, the EU’s circular economy regulations are influencing manufacturers to develop recyclable and reusable blade materials. With a combination of heritage craftsmanship and advanced manufacturing, Italy remains a lucrative industry for high-performance cutting solutions.
South Korea is forecasted to expand at a CAGR of 8.4% from 2025 to 2035, driven by rapid urbanization, smart manufacturing advancements, and rising construction activity. Government-backed Smart City initiatives are increasing demand for precision cutting tools in infrastructure development.
South Korea’s semiconductor and high-tech manufacturing industry is influencing material innovation in saw blade coatings, enhancing durability and performance. The country’s commitment to carbon-neutral manufacturing is also driving investments in sustainable blade production techniques. With continuous innovation in high-performance and energy-efficient cutting tools, South Korea remains a dynamic hub for precision cutting technology.
Japan is forecasted to expand at a CAGR of 7.6% from 2025 to 2035, propelled by its advanced manufacturing ecosystem and strict industrial safety standards. The JIS B4411 certification governs the quality of diamond saw blades used in industrial applications, ensuring high standards in cutting efficiency and durability.
Environmental sustainability is a key focus, with regulations encouraging the use of low-carbon and recyclable blade materials. Japan’s demand for premium architectural stone materials in luxury construction projects further drives industry growth. With a strong emphasis on precision cutting and technological advancements, Japan remains a key player in the industry.
It is projected that China will experience a period from 2025 to 2035 characterized by a CAGR of 9.1%, fuelled by stringent VOC regulations as well as rapid industrialization. The CCC (China Compulsory Certification) mark for saw blades dictates quality and safety compliance in these products.
The pressures exerted by environmental regulations in China have pushed manufacturers to look beyond cutting operations that have extremely reduced emission rates and dust-free cutting solutions. The adoption of smart manufacturing and AI-driven cutting systems is transforming the industry, making China a dominant force in global saw blade production.

As a result, the global stone cutting saw blades market has grown significantly in 2024 owing to rise in demand of accurate cutting equipment in buildings, mining and monument creation. Industrial tools like Bosch Tools, Diamond Products, MK Diamond Products, Husqvarna Group, and Continental Diamond Tool have been making efforts to build-up their product portfolio and geographical presence to capitalize on the emerging opportunities.
Such players centre their ongoing product development around innovation, strategic partnerships, and sustainability in order to meet the changing needs of high-performance-cutting-requiring industries.
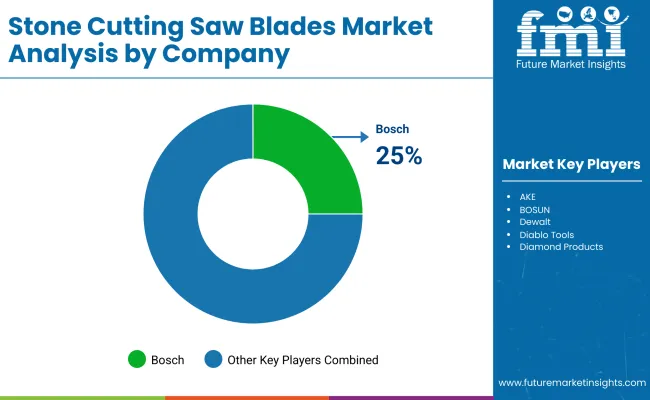
Bosch Tools has an estimated share of about 25% and continues to be a leader through continuous innovation and strategic investments. Amongst the diamond-tipped saw blades launched by Bosch in 2024 with enhanced durability and cutting efficiency were those directed towards the construction and mining sectors.
The company has entered a collaboration with Caterpillar Inc., one of the leading construction equipment suppliers, for integrating its saw blades into various automated cutting systems. Per Bosch's official website, this partnership aims at enhancing productivity and cutting down on downtime during huge construction projects. Moreover, Bosch also ramped up its facilities in Asia to meet the demand for precision cutting tools.
Residing and specializing in the saw blade industry with a notable 20% industry share, Diamond Products has adopted a product diversification strategy based on niche technology, integrating advanced materials and technologies into its saw blade industry.
In 2020, the company launched a series of segmented diamond blades which would allow for cutting of hard item like granite and marble. As Construction Equipment Guide reported, Diamond Products also purchased Laser Weld Technologies, a lesser-known company that focuses on laser-welding technology. The acquisition enabled Diamond Products to improve its capacity to provide high-performance, long-lasting blades. It further strengthened its distribution channel in Europe as well as North America to provide better access to customers.
In 2024, MK Diamond Products with a share of about 18% of the industry has focused on innovation and sustainability. To work toward global sustainability goals, the company introduced to its line a new series of eco-friendly saw blades derived from recycled materials.
Further working in collaboration with fellow industry leader Skanska, MK Diamond Products is developing and creating custom cutting solutions for urban infrastructure projects. As reported by Construction Dive, the partnership focuses on improving efficiency and minimizing waste in large-scale construction projects. Moreover, MK Diamond Products focused on R&D to produce blades with modern cooling technologies, which helped in making its stronghold in the industry.
Husqvarna Group, which holds a 15% share in the industry, is keenly focused on expanding its presence in monument fabrication and landscaping. Husqvarna brought to industry in 2024 a line of turbo diamond blades characterized by greater cutting speed and precision for detailed stone carving and engraving. With this, the company partnered with Komatsu, a global mining equipment supplier, to develop integrated cutting solutions for quarrying operations, as reported by Mining Technology.
The aim of this partnership is to create more efficient operations and decrease energy usage in mining applications. Similarly, Husqvarna has expanded into conveying on-site training and maintenance of its saw blades.
Continental Diamond Tool, with an industry share approximately 12%, focused on technology advancements and partnerships in 2024. The Company introduced new series of ultra-thin diamond blades with less kerf loss, targeting the glass and ceramic industries. Another company, Continental Diamond Tool, announced a collaboration with renewable energy leader.
First Solar to implement bubble cutting solutions for solar panel manufacture, according to Renewable Energy World. That will be carry out to maximize production efficiency and minimize material wastage in renewable energy installations. Continental Diamond Tool also invested in digital twin technology to improve blade performance and reliability.
By blade type, the sector is segmented into diamond blades and carbide blades.
In terms of blade diameter, the industry is segmented into small diameter blades, medium diameter blades, and large diameter blades.
By end user, the sector is segmented into the construction industry and the stone fabrication industry.
The industry is segmented by region into North America, Latin America, Western Europe, South Asia & Pacific, East Asia, Middle East, and Africa.
Rising construction activities, advancements in blade technology, and increasing demand for precision cutting are key drivers.
Diamond blades provide superior durability and precision for cutting hard materials, while carbide blades are cost-effective for softer stones.
Strict environmental and safety regulations are driving the development of eco-friendly, high-efficiency options.
The construction and stone fabrication industries are the primary users due to their need for precise and efficient cutting.
Innovations in blade coatings, bonding techniques, and cutting-edge designs are enhancing speed, precision, and longevity.


Our Research Products

The "Full Research Suite" delivers actionable market intel, deep dives on markets or technologies, so clients act faster, cut risk, and unlock growth.

The Leaderboard benchmarks and ranks top vendors, classifying them as Established Leaders, Leading Challengers, or Disruptors & Challengers.

Locates where complements amplify value and substitutes erode it, forecasting net impact by horizon

We deliver granular, decision-grade intel: market sizing, 5-year forecasts, pricing, adoption, usage, revenue, and operational KPIs—plus competitor tracking, regulation, and value chains—across 60 countries broadly.

Spot the shifts before they hit your P&L. We track inflection points, adoption curves, pricing moves, and ecosystem plays to show where demand is heading, why it is changing, and what to do next across high-growth markets and disruptive tech

Real-time reads of user behavior. We track shifting priorities, perceptions of today’s and next-gen services, and provider experience, then pace how fast tech moves from trial to adoption, blending buyer, consumer, and channel inputs with social signals (#WhySwitch, #UX).

Partner with our analyst team to build a custom report designed around your business priorities. From analysing market trends to assessing competitors or crafting bespoke datasets, we tailor insights to your needs.
Supplier Intelligence
Discovery & Profiling
Capacity & Footprint
Performance & Risk
Compliance & Governance
Commercial Readiness
Who Supplies Whom
Scorecards & Shortlists
Playbooks & Docs
Category Intelligence
Definition & Scope
Demand & Use Cases
Cost Drivers
Market Structure
Supply Chain Map
Trade & Policy
Operating Norms
Deliverables
Buyer Intelligence
Account Basics
Spend & Scope
Procurement Model
Vendor Requirements
Terms & Policies
Entry Strategy
Pain Points & Triggers
Outputs
Pricing Analysis
Benchmarks
Trends
Should-Cost
Indexation
Landed Cost
Commercial Terms
Deliverables
Brand Analysis
Positioning & Value Prop
Share & Presence
Customer Evidence
Go-to-Market
Digital & Reputation
Compliance & Trust
KPIs & Gaps
Outputs
Full Research Suite comprises of:
Market outlook & trends analysis
Interviews & case studies
Strategic recommendations
Vendor profiles & capabilities analysis
5-year forecasts
8 regions and 60+ country-level data splits
Market segment data splits
12 months of continuous data updates
DELIVERED AS:
PDF EXCEL ONLINE
Saw Blades Market Size, Share, and Forecast 2025 to 2035
Sawing and Cutting Tools Market Growth, Trends and Forecast from 2025 to 2035
Hacksaw Blades Market Size and Share Forecast Outlook 2025 to 2035
Woodworking Circular Saw Blades Market Size and Share Forecast Outlook 2025 to 2035
SAW Filter Market Size and Share Forecast Outlook 2025 to 2035
Stone Paper Market Size and Share Forecast Outlook 2025 to 2035
Stone Crushing Equipment Market Size and Share Forecast Outlook 2025 to 2035
Cutting Tool Packaging Market Size and Share Forecast Outlook 2025 to 2035
Stone Processing Machine Market Size and Share Forecast Outlook 2025 to 2035
Cutting Boards Market Size and Share Forecast Outlook 2025 to 2035
Cutting and Bending Machine Market Size and Share Forecast Outlook 2025 to 2035
Cutting Balloons Market Insights – Growth, Demand & Forecast 2025 to 2035
Stone Analysis Software Market – Trends & Forecast 2025 to 2035
Saw Palmetto Market Analysis by Powder, Whole and others Forms Through 2035
Cutting Fluid Market Growth – Trends & Forecast 2025-2035
Examining Stone Paper Market Share & Industry Trends
Destoner Machine Market Trend Analysis Based on Product Type, End-Use, Automation, and Region 2025 to 2035
Gemstone Market Size and Share Forecast Outlook 2025 to 2035
Gemstone Cosmetic Powder Market Analysis - Trends, Growth & Forecast 2025 to 2035
TC-SAW Filter Market

Thank you!
You will receive an email from our Business Development Manager. Please be sure to check your SPAM/JUNK folder too.
Chat With
MaRIA