Reports

- Global Locations -

Headquarters

Future Market Insights, Inc.

Christiana Corporate, 200
Continental Drive, Suite 401,
Newark, Delaware - 19713,
United States

T: +1-845-579-5705

Americas

Future Market Insights, Inc.

616 Corporate Way, Suite 2-9018,
Valley Cottage, NY 10989, United States

T: +1-347-918-3531

MEA

Future Market Insights

1602-6 Jumeirah Bay X2 Tower, Plot No: JLT-PH2-X2A,
Jumeirah Lakes Towers, Dubai,
United Arab Emirates

Europe

Future Market Insights

3rd Floor, 207 Regent Street,
W1B 3HH London
United Kingdom

T: + 44 (0) 20 8123 9659
D: +44 (0) 20 3287 4268

Asia Pacific

Future Market Insights

IndiaLand Global Tech Park, Unit UG-1, Behind Grand HighStreet, Phase 1, Hinjawadi, MH, Pune – 411057, India

Cutting and Bending Machine Market Outlook (2022 to 2032)

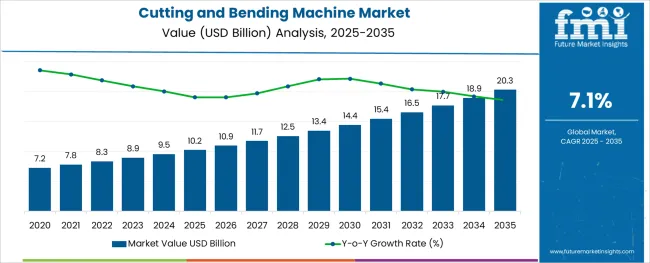
The global cutting and bending machine market size reached US$ 7,751.7 Million in 2021 and it is expected to touch a valuation of US$ 8,238.3 Million in 2022. Furthermore, with growing adoption across diverse industries including automotive, aerospace, electronics, and construction, the overall sales of cutting and bending machines are projected to rise at 7.1% CAGR between 2022 and 2032, reaching a valuation of US$ 16,383.6 Million by 2032.

Cutting and bending machines have become essential equipment across manufacturing industries where they are increasingly used to cut and bend objects with better precision and at quick intervals of time.

There was a time when automotive and electronic component manufacturers had to make use of manual machines that were heavy and resulted in less precise end products. After manually operated machines, semi-automatic machines came onto the scene, and in recent years, these machines have been operated automatically, which helped in the digital age of these markets.

Modern automatic cutting and bending machines are highly efficient and provide more precise cuts and bends. They have allowed manufacturing companies to significantly improve their overall productivity, reduce labor requirements, and save money.

Robust growth of manufacturing industries such as automotive, aerospace, electrical & electronics, and marine & construction along with increasing adoption of cutting and bending machines in these sectors is expected to boost the global market during the forecast period.

Similarly, the booming sheet metal fabrication business due to increasing demand for sheet metal in sectors including aerospace and automotive is expected to boost sales of cutting and bending machines in the upcoming years.

There is significant growth in the sales of cutting machines, which have inevitable applications in industrial development and metal manufacturing. Metal fabrication is the process of building structures from raw metal material, which includes cutting, bending, welding, and forming. The automobile, aerospace, construction, and energy industries all depend on the extremely cyclical metal fabrication business.

Due to the market's volatility, the industry has been forced to streamline production procedures and concentrate on the ability to consistently produce high-capacity output. This calls for highly efficient and sophisticated cutting and bending machines, which in turn spurs the market's overall growth and offers numerous opportunities for participants to expand their product portfolios and boost their product revenue in the global market.

Companies are investing significantly in order to expand their production in the regional market and grab growth opportunities. They are highly focused on providing solutions integrated with the internet of things and other advanced technologies specifically for process monitoring, preventive maintenance, and lights-out production capability. Thus, the development of new cutting and bending machines integrated with advanced technologies will help the market to thrive rapidly over the next ten years.

The global cutting and bending machine market forms approximately 45% to 55% of the overall metal processing equipment market and this figure is expected to move upwards over the next ten years as demand for advanced cutting and bending machines continues to rise worldwide.

Regionally, North America is expected to grow at a healthy CAGR of 7.6% between 2022 and 2032, accounting for around 30% of the volume and value share of the global market for cutting and bending machines. The rapid growth of the automotive and aerospace industries, increasing penetration of automation, and availability of advanced cutting and bending machinery are driving growth in the region.

Attribute Key Insights
Cutting and Bending Machine Market Base Value (2021A) US$ 7,751.7 Million
Estimated Market Value (2022E) US$ 8,238.3 Million
Projected Market Value (2032F) US$ 16,383.6 Million
Value-based CAGR (2022 to 2032) 7.1%
Collective Value Share: Top 3 Countries (2022E) 44.4%

Don't pay for what you don't need

Customize your report by selecting specific countries or regions and save 30%!

Cutting and Bending Machine Market Outlook 2017 to 2021 Compared to Demand Forecast 2022 to 2032

Demand for cutting and bending machines increased at a CAGR of about 2.6% during the historical period from 2017 to 2021. However, with the rapid growth of end-use industries such as automotive and aerospace, and increasing penetration of automation, the overall sales of cutting and bending machines are poised to accelerate at 7.1% CAGR through 2032.

Increasing urbanization and infrastructural development in emerging economies have led to an increase in total spending in industries such as metalworking, automotive, and aerospace. This is expected to create demand for cutting and bending machines.

Cutting and bending machines are undergoing digital transformation, which entails the use of cutting and bending machines equipped with the latest technologies to overcome all business challenges and reshape existing operations. Thus, the development of new and advanced cutting and bending machines will further boost the market during the next ten years.

Some of the countries are expected to emerge as new manufacturing hubs and see potential growth in the export manufacturing sector. In addition to this, there is a shift in global economic power that is boosting urbanization in most of these countries. Overall economic growth, coupled with prompt urbanization and changing global demographics, is expected to elevate the demand for cutting and bending machines through 2032.

Cutting and Bending Machine Market

Comparative Analysis of Cutting and Bending Machine Markets

Cutting and Bending Machine Market:

Differentiating Aspects Cutting and Bending Machine Market
CAGR in 2022 to 2032 7.1%
Current Valuation in 2022 US$ 8,238.3 Million
Projected Valuation in 2032 US$ 16,383.6 Million
Demand Drivers
  • Increasing adoption of cutting and bending machines across automotive, aerospace, electronics, and other end-use industries is driving the global market forward.
  • The development of new and advanced cutting and bending machines will further boost sales over the next decade.

Laser Cutting Machine Market:

Differentiating Aspects Laser Cutting Machine Market
CAGR in 2022 to 2032 5.8%
Current Valuation in 2022 US$ 3,386.4 Million
Projected Valuation in 2032 US$ 5,974.1 Million
Demand Drivers
  • Growing demand for metal processing and fabrication in automotive and heavy machinery industries is driving the global laser cutting machine market.
  • Increasing awareness about various advantages of laser cutting machines over their counterparts will further boost sales during the forecast period.

Automated Bending Machine Market:

Differentiating Aspects Automated Bending Machine Market
CAGR in 2022 to 2032 4.5%
Current Valuation in 2022 US$ 2.17 Billion
Projected Valuation in 2032 US$ 3.37 Billion
Demand Drivers
  • Rising usage of automated bending machines across various end-use industries including oil & gas, automotive, and aerospace is a key factor stimulating growth in the global automated bending machines market.
  • The growing need for increasing overall efficiency, reducing labor costs, and improving worker safety across industries is expected to bolster sales of automated machines over the next ten years.
Nikhil Kaitwade
Nikhil Kaitwade

Principal Consultant

Talk to Analyst

Find your sweet spots for generating winning opportunities in this market.

What are the Key Trends Driving the Global Market for Cutting and Bending Machines?

Growing Trend of Industry 4.0 to Boost Cutting and Bending Machine Sales

Industry revolution 4.0 is rapidly expanding and is changing the way companies manufacture and perform. Because of a scarcity of skilled workers, every manufacturing sector is embracing automation. End users are giving preference to machines with automation and efficiency. Energy consumption accounts for a significant portion of industrial operating costs, fuelling the trend toward low-energy machines.

Trends are changing across the region, such as in developed nations, where trends include machine connectivity to the internet and robots to reduce machine cycle time. Investment in associated sectors such as cloud computing, artificial intelligence, the internet of things, automation, and their integration into metal processing machines will enhance the competitiveness of market participants. The development of additive technologies is a major area for the market manufacturers and helps them to continuously adopt technological developments in their product portfolio.

Thus, the growing penetration of industry 4.0 across the world will continue to generate demand for advanced machinery like cutting and bending machines during the projected period.
Country-wise Insights

What Makes the USA Prominent Market for Cutting and Bending Machines?

Flourishing Automotive Industry Pushing Demand for Cutting and Bending Machines in the USA

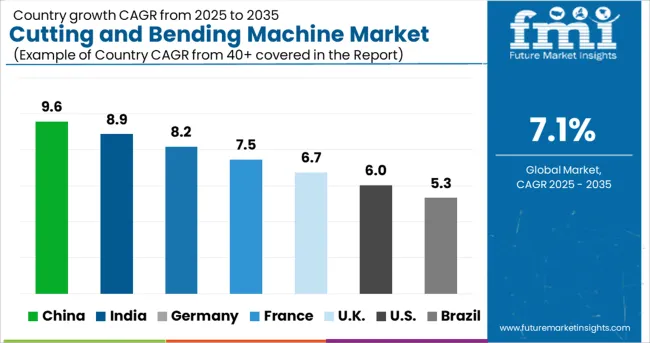
As per FMI, the USA cutting and bending machine market holds around 70% share of the North American market and it is predicted to expand by 1.9x through 2032. The rapid expansion of the automotive industry, increasing penetration of automation, and the strong presence of leading manufacturers are some of the key factors driving the USA market.
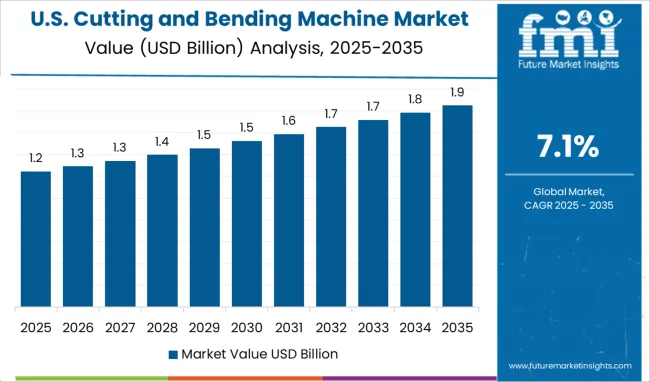
The automobile industry in the USA is the 12th-ranked industry and is a very dynamic industry with advanced technological developments and innovation. Rapid growth in the automobile sector across the USA is expected to generate high demand for cutting and bending machines during the forecast period.

The industry requires precision cutting and strict cutting tolerance, which are well served by the new product innovations in these machines. The market is expected to be further driven by evolving automobile designs coupled with the multiple bending and cutting operations performed by these machines, which greatly facilitate the operation process and ensure the efficiency of the operation and the uniformity of the product. Hence, the USA market is expected to increase steadily over the forecast period, making it one of the prominent markets worldwide.

How is the Market for Cutting and Bending Machines Shaping in Germany?

Growing Penetration of Industry 4.0 Boosting Market in Germany

Germany’s cutting and bending machine market is anticipated to expand at a robust CAGR of 6.8% over the forecast period. Sales in the country are projected to increase by two times by the end of 2032.

Growth in Germany’s market is attributed to the rising adoption of Industry 4.0 across traditional manufacturing and industrial practices. The ongoing factory automation trend is fuelling demand for and the deployment of more innovative and advanced technologies in manufacturing processes to enhance productivity, improve product quality, and manage the workforce better. This is the primary driving force behind the expansion of the cutting and bending machine industry in majority of the European countries, including the United Kingdom.

Why is the Demand for Cutting and Bending Machines Increasing in China?

Growing Demand for Consumer Electronics Propelling Sales in China

According to FMI, the overall market for cutting and bending machines across China is expected to reach a valuation of US$ 1,317.0 Mn by the end of 2032. The rapid growth of the consumer electronics industry, availability of high-tech cutting and bending machinery at affordable prices, and favorable government support are some of the factors driving the China market.

In global consumer electronics manufacturing, China’s production accounts for more than 30% of the market. Similarly, in electronic circuit component production, China accounts for around 33% worldwide, which is higher than that of other electronics manufacturing hubs.

China's information technology sector claims that by boosting value-added output by 13.9% annually, the country's electronic industry aids in China's industrial upgrade. China is a prominent country that has heavily invested in smart robotics, cloud data, and automated factory technologies to optimise its manufacturing prowess, in which advanced or innovative cutting and bending machines play an important role as the foundation for industrial upgrades. Hence, China remains the go-to destination for the market growth of cutting and bending machines to meet the large-scale production of consumer electronics.

Get the data you need at a Fraction of the cost

Personalize your report by choosing insights you need
and save 40%!

Category-wise Insights

Which is the Most Sought-After Product Type in the Market?

Cutting Machines to Remain the Top Selling Product Type Through 2032

As per FMI, the cutting machine segment is expected to generate an absolute incremental opportunity of US$ 7,062.9 Million during the forecast period (2022 to 2032). This growth can be attributed to the rising usage of various cutting machines across several industries.

In the cutting machine segment, laser cutting machines are estimated to account for the highest share of the overall market owing to their wide machining range. Right from fabrication to the medical industry, laser-cutting machines have gained immense traction during the last few years and the trend is expected to continue during the forecast period.

Laser-cutting technology has a broad range of applications and is emerging as a technology that will continue to grow consistently. For instance, it plays a vital role in the medical industry, where tight dimensional tolerances and accuracy are a must in devices such as cardiovascular and orthopedic devices so that components for surgical implants can be made with the required rapidity and extreme precision. Hence, this segment is expected to create an absolute $ opportunity of US$ 3,956.7 Million between 2022 and 2032.

Which is the Leading End-Use Industry for Cutting and Bending Machines?

The majority of Sales Remain Concentrated in Automotive Industry

According to Future Market Insights, the automotive industry holds around 30% of the global market for cutting and bending machines and it is expected to generate an absolute $ opportunity of more than US$ 2,578.7 Million between 2022 and 2032. This can be attributed to the increasing demand for automotive vehicles along with the rising usage of cutting and bending machines across the thriving automotive industry.

The automotive sector covers everything from the designing, developing, producing, and manufacturing of automotive vehicles and their parts and components in which cutting and bending machines have a wide range of applications. The laser cutting machine is one of the most frequently used machines during various stages of automotive manufacturing that ensures the reliability and safety of the end product.
Competitive Landscape

Key manufacturers of cutting and bending machines are highly focused on introducing new products integrated with advanced technologies to strengthen their product portfolios. Besides this, they are adopting strategies such as mergers, acquisitions, facility expansions, and collaborations to gain a competitive edge in the market. For instance,

  • In June 2022, with the TruFiber 2000 P, TRUMPF presented a new 2kW fiber laser at the LASYS exhibition in Stuttgart. This laser is a driving force, utilizing TRUMPF’s latest generation of optical engines, and is the basis for quite a few processing solutions.
  • In 2021, Bodor launched its newly upgraded Bodor A 2.0 laser cutting machine with new features and the new high-quality BodorGenius 12000W laser head machine.

Scope of Report

Attribute Details
Estimated Market Size (2022) US$ 8,238.3 Million
Projected Market Size (2032) US$ 16,383.6 Million
Anticipated Growth Rate (2022 to 2032) 7.1% CAGR
Forecast Period 2022 to 2032
Historical Data Available for 2017 to 2021
Market Analysis US$ Million for Value and Mn Units for Volume
Key Regions Covered North America, Latin America, Europe, East Asia, South Asia Pacific, and The Middle East and Africa
Key Countries Covered USA, Canada, Mexico, Brazil, Germany, Italy, France, United Kingdom, Spain, Netherlands, RUSSIA, Sweden, Hungary, Czechia, Poland, Portugal, Rest of Europe China, Japan, South Korea, India, ASEAN, Australia, and New Zealand, Turkey, South Africa, GCC Countries, Northern Africa.
Key Segments Covered Product Type, Operation, End Use, and Region
Key Companies Profiled
  • Amada Co. Ltd.
  • TRUMPF Group
  • Bystronic Group
  • Han's Laser Technology Industry Group Co., Ltd.
  • Coherent Inc.
  • Prima Industrie S.p.A.
  • Durmazlar Machinery Inc
  • Ermaksan
  • Nissan Tanaka Corporation
  • Others
Report Coverage Market Forecast, Company Share Analysis, Competition Intelligence, Drivers, Restraints, Opportunities and Threats Analysis, Market Dynamics and Challenges, and Strategic Growth Initiatives

Global Cutting and Bending Machine Industry by Category

By Product Type:

  • Cutting Machine
    • Laser Cutting Machine
    • Waterjet Cutting Machine
    • Plasma Cutting Machine
    • Flame Cutting Machine
  • Bending Machine
    • Electric
    • Hydraulic
    • Pneumatic
    • Others

By Operation:

  • Automatic
  • Semi-automatic
  • Manual

By End Use:

  • Automotive
  • Aerospace
  • Electrical and Electronics
  • Marine & Construction
  • Others

By Region:

  • North America
  • Latin America
  • Europe
  • East Asia
  • South Asia Pacific
  • Middle East and Africa

Frequently Asked Questions

What is the current size of the global cutting and bending machine market?

The global cutting and bending machine market size is expected to reach US$ 8,238.3 Million in 2022.

At what CAGR, will the demand for cutting and bending machines rise during the forecast period?

The demand for cutting and bending machines is projected to grow at 7.1% CAGR during the forecasted period from 2022 to 2032.

What is the projected valuation for the global cutting and bending machine industry?

As per FMI, the worldwide cutting and bending machine industry are likely to reach a valuation of US$ 16,383.6 Million by 2032.

Who are the top players in the global market and what is their total share?

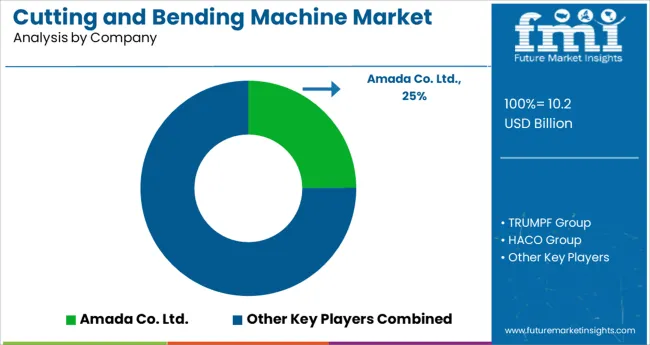
Amada Co. Ltd., TRUMPF Group, Bystronic Group, Han's Laser Technology Industry Group Co., Ltd., Coherent Inc, and others are the leading market players, collectively accounting for 25% to 35% of the global market share.

How will growth unfold in German market?

Demand for cutting and bending machines in Germany is expected to increase by 5.6% CAGR from 2022 to 2032 on a value basis.

Which end use segment is creating lucrative opportunities for market players?

The automotive industry holds around 30% of the total market share, making it the most lucrative end-use segment for market players.

Table of Content

1. Executive Summary | Cutting and Bending Machine Market

    1.1. Global Market Outlook

    1.2. Demand Side Trends

    1.3. Supply Side Trends

    1.4. Technology Roadmap

    1.5. Analysis and Recommendations

2. Market Overview

    2.1. Market Coverage / Taxonomy

    2.2. Market Definition / Scope / Limitations

3. Key Market Trends

    3.1. Key Trends Impacting the Market

    3.2. Product Innovation / Development Trends

4. Key Success Factors

    4.1. Product Adoption / Usage Analysis

    4.2. Product USPs / Features

    4.3. Strategic Promotional Strategies

5. Global Market Demand Analysis 2017 to 2021 and Forecast, 2022 to 2032

    5.1. Historical Market Volume (Units) Analysis, 2017 to 2021

    5.2. Current and Future Market Volume (Units) Projections, 2022 to 2032

    5.3. Y-o-Y Growth Trend Analysis

6. Global Market - Pricing Analysis

    6.1. Regional Pricing Analysis By Product Type

    6.2. Global Average Pricing Analysis Benchmark

7. Global Market Demand (in Value or Size in US$ Million) Analysis 2017 to 2021 and Forecast, 2022 to 2032

    7.1. Historical Market Value (US$ Million) Analysis, 2017 to 2021

    7.2. Current and Future Market Value (US$ Million) Projections, 2022 to 2032

        7.2.1. Y-o-Y Growth Trend Analysis

        7.2.2. Absolute $ Opportunity Analysis

8. Market Background

    8.1. Macro-Economic Factors

        8.1.1. Global GDP Growth Outlook

        8.1.2. Global Manufacturing Industry Outlook

        8.1.3. Global Industrial Automation Outlook

        8.1.4. Other Macro-economic Factors

    8.2. Forecast Factors - Relevance and Impact

        8.2.1. Top Companies Historical Growth

        8.2.2. Global Urban Population Growth Outlook

        8.2.3. Global Machine Tools Growth Outlook

        8.2.4. End-Use Industry Growth Outlook

        8.2.5. Business Climate

    8.3. Value Chain

        8.3.1. Raw Material Suppliers

        8.3.2. Product Manufacturers

        8.3.3. End Users

    8.4. COVID-19 Crisis – Impact Assessment

        8.4.1. Current Statistics

        8.4.2. Short-Mid-Long Term Outlook

        8.4.3. Likely Rebound

    8.5. Market Dynamics

        8.5.1. Drivers

        8.5.2. Restraints

        8.5.3. Opportunity Analysis

9. Global Market Analysis 2017 to 2021 and Forecast 2022 to 2032, by Product Type

    9.1. Introduction / Key Findings

    9.2. Historical Market Size (US$ Million) and Volume Analysis By Product Type, 2017 to 2021

    9.3. Current and Future Market Size (US$ Million) and Volume Analysis and Forecast By Product Type, 2022 to 2032

        9.3.1. Cutting Machine

            9.3.1.1. Laser Cutting Machine

            9.3.1.2. Waterjet Cutting Machine

            9.3.1.3. Plasma Cutting Machine

            9.3.1.4. Flame Cutting Machine

        9.3.2. Bending Machine

            9.3.2.1. Electric

            9.3.2.2. Hydraulic

            9.3.2.3. Pneumatic

            9.3.2.4. Others

    9.4. Market Attractiveness Analysis By Product Type

10. Global Market Analysis 2017 to 2021 and Forecast 2022 to 2032, by Operation

    10.1. Introduction / Key Findings

    10.2. Historical Market Size (US$ Million) and Volume Analysis By Operation, 2017 to 2021

    10.3. Current and Future Market Size (US$ Million) and Volume Analysis and Forecast By Operation, 2022 to 2032

        10.3.1. Automatic

        10.3.2. Semi-Automatic

        10.3.3. Manual

    10.4. Market Attractiveness Analysis By Operation

11. Global Market Analysis 2017 to 2021 and Forecast 2022 to 2032, by End Use

    11.1. Introduction / Key Findings

    11.2. Historical Market Size (US$ Million) and Volume Analysis By End Use, 2017 to 2021

    11.3. Current and Future Market Size (US$ Million) and Volume Analysis and Forecast By End Use, 2022 to 2032

        11.3.1. Automotive

        11.3.2. Aerospace

        11.3.3. Electrical and Electronics

        11.3.4. Marine and Construction

        11.3.5. Others

    11.4. Market Attractiveness Analysis By End Use

12. Global Market Analysis 2017 to 2021 and Forecast 2022 to 2032, by Region

    12.1. Introduction

    12.2. Historical Market Size (US$ Million) and Volume Analysis By Region, 2017 to 2021

    12.3. Current Market Size (US$ Million) and Volume Analysis and Forecast By Region, 2022 to 2032

        12.3.1. North America

        12.3.2. Latin America

        12.3.3. Europe

        12.3.4. Middle East and Africa (MEA)

        12.3.5. East Asia

        12.3.6. South Asia and Pacific

    12.4. Market Attractiveness Analysis By Region

13. North America Market Analysis 2017 to 2021 and Forecast 2022 to 2032

    13.1. Introduction

    13.2. Pricing Analysis

    13.3. Historical Market Size (US$ Million) and Volume Trend Analysis By Market Taxonomy, 2017 to 2021

    13.4. Market Size (US$ Million) and Volume Forecast By Market Taxonomy, 2022 to 2032

        13.4.1. By Country

            13.4.1.1. USA

                13.4.1.1.1. North East USA

                13.4.1.1.2. Mid-West USA

                13.4.1.1.3. West USA

                13.4.1.1.4. South USA

            13.4.1.2. Canada

        13.4.2. By Product Type

        13.4.3. By Operation

        13.4.4. By End Use

    13.5. Market Attractiveness Analysis

        13.5.1. By Country

        13.5.2. By Product Type

        13.5.3. By Operation

        13.5.4. By End Use

14. Latin America Market Analysis 2017 to 2021 and Forecast 2022 to 2032

    14.1. Introduction

    14.2. Pricing Analysis

    14.3. Historical Market Size (US$ Million) and Volume Trend Analysis By Market Taxonomy, 2017 to 2021

    14.4. Market Size (US$ Million) and Volume Forecast By Market Taxonomy, 2022 to 2032

        14.4.1. By Country

            14.4.1.1. Brazil

            14.4.1.2. Mexico

            14.4.1.3. Rest of Latin America

        14.4.2. By Product Type

        14.4.3. By Operation

        14.4.4. By End Use

    14.5. Market Attractiveness Analysis

        14.5.1. By Country

        14.5.2. By Product Type

        14.5.3. By Operation

        14.5.4. By End Use

15. Europe Market Analysis 2017 to 2021 and Forecast 2022 to 2032

    15.1. Introduction

    15.2. Pricing Analysis

    15.3. Historical Market Size (US$ Million) and Volume Trend Analysis By Market Taxonomy, 2017 to 2021

    15.4. Market Size (US$ Million) and Volume Forecast By Market Taxonomy, 2022 to 2032

        15.4.1. By Country

            15.4.1.1. GERMANY

            15.4.1.2. ITALY

            15.4.1.3. FRANCE

            15.4.1.4. United Kingdom

            15.4.1.5. SPAIN

            15.4.1.6. Netherlands

            15.4.1.7. RUSSIA

            15.4.1.8. Sweden

            15.4.1.9. Hungary

            15.4.1.10. Czechia

            15.4.1.11. Poland

            15.4.1.12. Portugal

            15.4.1.13. Rest of Europe

        15.4.2. By Product Type

        15.4.3. By Operation

        15.4.4. By End Use

    15.5. Market Attractiveness Analysis

        15.5.1. By Country

        15.5.2. By Product Type

        15.5.3. By Operation

        15.5.4. By End Use

16. South Asia and Pacific Market Analysis 2017 to 2021 and Forecast 2022 to 2032

    16.1. Introduction

    16.2. Pricing Analysis

    16.3. Historical Market Size (US$ Million) and Volume Trend Analysis By Market Taxonomy, 2017 to 2021

    16.4. Market Size (US$ Million) and Volume Forecast By Market Taxonomy, 2022 to 2032

        16.4.1. By Country

            16.4.1.1. India

            16.4.1.2. ASEAN

            16.4.1.3. Australia and New Zealand

            16.4.1.4. Rest of South Asia and Pacific

        16.4.2. By Product Type

        16.4.3. By Operation

        16.4.4. By End Use

    16.5. Market Attractiveness Analysis

        16.5.1. By Country

        16.5.2. By Product Type

        16.5.3. By Operation

        16.5.4. By End Use

17. East Asia Market Analysis 2017 to 2021 and Forecast 2022 to 2032

    17.1. Introduction

    17.2. Pricing Analysis

    17.3. Historical Market Size (US$ Million) and Volume Trend Analysis By Market Taxonomy, 2017 to 2021

    17.4. Market Size (US$ Million) and Volume Forecast By Market Taxonomy, 2022 to 2032

        17.4.1. By Country

            17.4.1.1. China

            17.4.1.2. Japan

            17.4.1.3. South Korea

        17.4.2. By Product Type

        17.4.3. By Operation

        17.4.4. By End Use

    17.5. Market Attractiveness Analysis

        17.5.1. By Country

        17.5.2. By Product Type

        17.5.3. By Operation

        17.5.4. By End Use

18. Middle East and Africa Market Analysis 2017 to 2021 and Forecast 2022 to 2032

    18.1. Introduction

    18.2. Pricing Analysis

    18.3. Historical Market Size (US$ Million) and Volume Trend Analysis By Market Taxonomy, 2017 to 2021

    18.4. Market Size (US$ Million) and Volume Forecast By Market Taxonomy, 2022 to 2032

        18.4.1. By Country

            18.4.1.1. GCC Countries

            18.4.1.2. Turkey

            18.4.1.3. Northern Africa

            18.4.1.4. South Africa

            18.4.1.5. Rest of Middle East and Africa

        18.4.2. By Product Type

        18.4.3. By Operation

        18.4.4. By End Use

    18.5. Market Attractiveness Analysis

        18.5.1. By Country

        18.5.2. By Product Type

        18.5.3. By Operation

        18.5.4. By End Use

19. Country-Wise Market Analysis 2022

    19.1. Introduction

        19.1.1. Market Value Proportion Analysis, By Key Countries

        19.1.2. Global Vs. Country Growth Comparison

    19.2. USA Market Analysis

        19.2.1. By Product Type

        19.2.2. By Operation

        19.2.3. By End Use

    19.3. Canada Market Analysis

        19.3.1. By Product Type

        19.3.2. By Operation

        19.3.3. By End Use

    19.4. Mexico Market Analysis

        19.4.1. By Product Type

        19.4.2. By Operation

        19.4.3. By End Use

    19.5. Brazil Market Analysis

        19.5.1. By Product Type

        19.5.2. By Operation

        19.5.3. By End Use

    19.6. Germany Market Analysis

        19.6.1. By Product Type

        19.6.2. By Operation

        19.6.3. By End Use

    19.7. Italy Market Analysis

        19.7.1. By Product Type

        19.7.2. By Operation

        19.7.3. By End Use

    19.8. France Market Analysis

        19.8.1. By Product Type

        19.8.2. By Operation

        19.8.3. By End Use

    19.9. United Kingdom Market Analysis

        19.9.1. By Product Type

        19.9.2. By Operation

        19.9.3. By End Use

    19.10. Spain Market Analysis

        19.10.1. By Product Type

        19.10.2. By Operation

        19.10.3. By End Use

    19.11. Russia Market Analysis

        19.11.1. By Product Type

        19.11.2. By Operation

        19.11.3. By End Use

    19.12. China Market Analysis

        19.12.1. By Product Type

        19.12.2. By Operation

        19.12.3. By End Use

    19.13. Japan Market Analysis

        19.13.1. By Product Type

        19.13.2. By Operation

        19.13.3. By End Use

    19.14. S. Korea Market Analysis

        19.14.1. By Product Type

        19.14.2. By Operation

        19.14.3. By End Use

    19.15. India Market Analysis

        19.15.1. By Product Type

        19.15.2. By Operation

        19.15.3. By End Use

    19.16. ASEAN Market Analysis

        19.16.1. By Product Type

        19.16.2. By Operation

        19.16.3. By End Use

    19.17. Australia and New Zealand Market Analysis

        19.17.1. By Product Type

        19.17.2. By Operation

        19.17.3. By End Use

    19.18. Turkey Market Analysis

        19.18.1. By Product Type

        19.18.2. By Operation

        19.18.3. By End Use

    19.19. South Africa Market Analysis

        19.19.1. By Product Type

        19.19.2. By Operation

        19.19.3. By End Use

20. Market Structure Analysis

    20.1. Market Analysis by Tier of Companies

    20.2. Market Share Analysis of Top Players

    20.3. Market Presence Analysis

21. Competition Analysis

    21.1. Competition Dashboard

    21.2. Competition Benchmarking

    21.3. Competition Deep Dive

        21.3.1. Amada Co. Ltd.

            21.3.1.1. Overview

            21.3.1.2. Product Portfolio

            21.3.1.3. Profitability by Market Segments (Product Type/Operation/EndUse/Region)

            21.3.1.4. Sales Footprint

            21.3.1.5. Strategy Overview

        21.3.2. TRUMPF Group

            21.3.2.1. Overview

            21.3.2.2. Product Portfolio

            21.3.2.3. Profitability by Market Segments (Product Type/Operation/EndUse/Region)

            21.3.2.4. Sales Footprint

            21.3.2.5. Strategy Overview

        21.3.3. HACO Group

            21.3.3.1. Overview

            21.3.3.2. Product Portfolio

            21.3.3.3. Profitability by Market Segments (Product Type/Operation/EndUse/Region)

            21.3.3.4. Sales Footprint

            21.3.3.5. Strategy Overview

        21.3.4. Bystronic Group

            21.3.4.1. Overview

            21.3.4.2. Product Portfolio

            21.3.4.3. Profitability by Market Segments (Product Type/Operation/EndUse/Region)

            21.3.4.4. Sales Footprint

            21.3.4.5. Strategy Overview

        21.3.5. Prima Industrie S.p.A.

            21.3.5.1. Overview

            21.3.5.2. Product Portfolio

            21.3.5.3. Profitability by Market Segments (Product Type/Operation/EndUse/Region)

            21.3.5.4. Sales Footprint

            21.3.5.5. Strategy Overview

        21.3.6. Durmazlar Machinery Inc.

            21.3.6.1. Overview

            21.3.6.2. Product Portfolio

            21.3.6.3. Profitability by Market Segments (Product Type/Operation/EndUse/Region)

            21.3.6.4. Sales Footprint

            21.3.6.5. Strategy Overview

        21.3.7. Koike Sanso Kogyo Co., Ltd.

            21.3.7.1. Overview

            21.3.7.2. Product Portfolio

            21.3.7.3. Profitability by Market Segments (Product Type/Operation/EndUse/Region)

            21.3.7.4. Sales Footprint

            21.3.7.5. Strategy Overview

        21.3.8. Ermaksan

            21.3.8.1. Overview

            21.3.8.2. Product Portfolio

            21.3.8.3. Profitability by Market Segments (Product Type/Operation/EndUse/Region)

            21.3.8.4. Sales Footprint

            21.3.8.5. Strategy Overview

        21.3.9. LVD Group

            21.3.9.1. Overview

            21.3.9.2. Product Portfolio

            21.3.9.3. Profitability by Market Segments (Product Type/Operation/EndUse/Region)

            21.3.9.4. Sales Footprint

            21.3.9.5. Strategy Overview

        21.3.10. SafanDarley B.V.

            21.3.10.1. Overview

            21.3.10.2. Product Portfolio

            21.3.10.3. Profitability by Market Segments (Product Type/Operation/EndUse/Region)

            21.3.10.4. Sales Footprint

            21.3.10.5. Strategy Overview

        21.3.11. Salvagnini Group

            21.3.11.1. Overview

            21.3.11.2. Product Portfolio

            21.3.11.3. Profitability by Market Segments (Product Type/Operation/EndUse/Region)

            21.3.11.4. Sales Footprint

            21.3.11.5. Strategy Overview

        21.3.12. Nissan Tanaka Corporation

            21.3.12.1. Overview

            21.3.12.2. Product Portfolio

            21.3.12.3. Profitability by Market Segments (Product Type/Operation/EndUse/Region)

            21.3.12.4. Sales Footprint

            21.3.12.5. Strategy Overview

        21.3.13. Boschert GmbH and Co. KG

            21.3.13.1. Overview

            21.3.13.2. Product Portfolio

            21.3.13.3. Profitability by Market Segments (Product Type/Operation/EndUse/Region)

            21.3.13.4. Sales Footprint

            21.3.13.5. Strategy Overview

        21.3.14. SOCO Machinery Co., Ltd.

            21.3.14.1. Overview

            21.3.14.2. Product Portfolio

            21.3.14.3. Profitability by Market Segments (Product Type/Operation/EndUse/Region)

            21.3.14.4. Sales Footprint

            21.3.14.5. Strategy Overview

        21.3.15. Other Prominent Players

            21.3.15.1. Overview

            21.3.15.2. Product Portfolio

            21.3.15.3. Profitability by Market Segments (Product Type/Operation/EndUse/Region)

            21.3.15.4. Sales Footprint

            21.3.15.5. Strategy Overview

22. Assumptions and Acronyms Used

23. Research Methodology

List of Tables

Table 01: Global Market Volume (Units) Historical Data 2017 to 2021 and Forecast 2022 to 2032 by Product Type

Table 02: Global Market Value (US$ Million) Historical Data 2017 to 2021 and Forecast 2022 to 2032 by Product Type

Table 03: Global Market Value (US$ Million) and Volume (Units) Historical Data 2017 to 2021 and Forecast 2022 to 2032 by Operation

Table 04: Global Market Value (US$ Million) and Volume (Units) Historical Data 2017 to 2021 and Forecast 2022 to 2032 By End Use

Table 05: Global Market Value (US$ Million) and Volume (Units) Historical Data 2017 to 2021 and Forecast 2022 to 2032 By Region

Table 06: North America Market Value (US$ Million) and Volume (Units) Historical Data 2017 to 2021 and Forecast 2022 to 2032 By Country

Table 07: North America Market Volume (Units) Historical Data 2017 to 2021 and Forecast 2022 to 2032 by Product Type

Table 08: North America Market Value (US$ Million) Historical Data 2017 to 2021 and Forecast 2022 to 2032 by Product Type

Table 09: North America Market Value (US$ Million) and Volume (Units) Historical Data 2017 to 2021 and Forecast 2022 to 2032 by Operation

Table 10: North America Market Value (US$ Million) and Volume (Units) Historical Data 2017 to 2021 and Forecast 2022 to 2032 By End Use

Table 11: Latin America Market Volume (Units) and Value (US$ Million) Historical Data 2017 to 2021 and Forecast 2022 to 2032 By Country

Table 12: Latin America Market Volume (Units) Historical Data 2017 to 2021 and Forecast 2022 to 2032 by Product Type

Table 13: Latin America Market Value (US$ Million) Historical Data 2017 to 2021 and Forecast 2022 to 2032 by Product Type

Table 14: Latin America Market Value (US$ Million) and Volume (Units) Historical Data 2017 to 2021 and Forecast 2022 to 2032 by Operation

Table 15: Latin America Market Value (US$ Million) and Volume (Units) Historical Data 2017 to 2021 and Forecast 2022 to 2032 By End Use

Table 16: Europe Market Volume (Units) Historical Data 2017 to 2021 and Forecast 2022 to 2032 By Country

Table 17: Europe Market Value (US$ Million) Historical Data 2017 to 2021 and Forecast 2022 to 2032 By Country

Table 18: Europe Market Volume (Units) Historical Data 2017 to 2021 and Forecast 2022 to 2032 by Product Type

Table 19: Europe Market Value (US$ Million) Historical Data 2017 to 2021 and Forecast 2022 to 2032 by Product Type

Table 20: Europe Market Value (US$ Million) and Volume (Units) Historical Data 2017 to 2021 and Forecast 2022 to 2032 by Operation

Table 21: Europe Market Value (US$ Million) and Volume (Units) Historical Data 2017 to 2021 and Forecast 2022 to 2032 By End Use

Table 22: East Asia Market Value (US$ Million) and Volume (Units) Historical Data 2017 to 2021 and Forecast 2022 to 2032 By Country

Table 23: East Asia Market Volume (Units) Historical Data 2017 to 2021 and Forecast 2022 to 2032 by Product Type

Table 24: East Asia Market Value (US$ Million) Historical Data 2017 to 2021 and Forecast 2022 to 2032 by Product Type

Table 25: East Asia Market Value (US$ Million) and Volume (Units) Historical Data 2017 to 2021 and Forecast 2022 to 2032 by Operation

Table 26: East Asia Market Value (US$ Million) and Volume (Units) Historical Data 2017 to 2021 and Forecast 2022 to 2032 By End Use

Table 27: South Asia and Pacific Market Value (US$ Million) and Volume (Units) Historical Data 2017 to 2021 and Forecast 2022 to 2032 By Country

Table 28: South Asia and Pacific Market Volume (Units) Historical Data 2017 to 2021 and Forecast 2022 to 2032 by Product Type

Table 29: South Asia and Pacific Market Value (US$ Million) Historical Data 2017 to 2021 and Forecast 2022 to 2032 by Product Type

Table 30: South Asia and Pacific Market Value (US$ Million) and Volume (Units) Historical Data 2017 to 2021 and Forecast 2022 to 2032 by Operation

Table 31: South Asia and Pacific Market Value (US$ Million) and Volume (Units) Historical Data 2017 to 2021 and Forecast 2022 to 2032 By End Use

Table 32: Middle East and Africa Market Value (US$ Million) and Volume (Units) Historical Data 2017 to 2021 and Forecast 2022 to 2032 By Country

Table 33: Middle East and Africa Market Volume (Units) Historical Data 2017 to 2021 and Forecast 2022 to 2032 by Product Type

Table 34: Middle East and Africa Market Value (US$ Million) Historical Data 2017 to 2021 and Forecast 2022 to 2032 by Product Type

Table 35: Middle East and Africa Market Value (US$ Million) and Volume (Units) Historical Data 2017 to 2021 and Forecast 2022 to 2032 by Operation

Table 36: Middle East and Africa Market Value (US$ Million) and Volume (Units) Historical Data 2017 to 2021 and Forecast 2022 to 2032 By End Use

List of Charts

Figure 01: Market Historical Demand, 2017 to 2021

Figure 02: Market Demand Forecast, 2022 to 2032

Figure 03: Market Historical Value (US$ Million), 2017 to 2021

Figure 04: Market Value (US$ Million) Forecast, 2022 to 2032

Figure 05: Market Absolute $ Opportunity, 2022 to 2032

Figure 06: Global Market Share and BPS Analysis by Product Type – 2022 and 2032

Figure 07: Global Market Y-o-Y Growth Projections by Product Type, 2021 to 2032

Figure 08: Global Market Attractiveness by Product Type, 2022 to 2032

Figure 09: Global Market Share and BPS Analysis By Product Type – 2022 and 2032

Figure 10: Global Market Y-o-Y Growth Projections By Product Type, 2021 to 2032

Figure 11: Global Market Attractiveness By Product Type, 2022 to 2032

Figure 12: Global Market Share and BPS Analysis by Product Type – 2022 and 2032

Figure 13: Global Market Y-o-Y Growth Projections by Product Type, 2021 to 2032

Figure 14: Global Market Attractiveness by Product Type, 2022 to 2032

Figure 15: Global Market Absolute $ Opportunity 2021 to 2032, by Cutting Machine segment

Figure 16: Global Market Absolute $ Opportunity 2021 to 2032, by Bending Machine segment

Figure 17: Global Market Share and BPS Analysis by Operation – 2022 and 2032

Figure 18: Global Market Y-o-Y Growth Projections by Operation, 2021 to 2032

Figure 19: Global Market Attractiveness by Operation, 2022 to 2032

Figure 20: Global Market Absolute $ Opportunity, 2021 to 2032, by Automatic segment

Figure 21: Global Market Absolute $ Opportunity, 2021 to 2032, by Semi-Automatic segment

Figure 22: Global Market Absolute $ Opportunity, 2021 to 2032, by Manual segment

Figure 23: Global Market Share and BPS Analysis by End Use – 2022 and 2032

Figure 24: Global Market Y-o-Y Growth Projections by End Use, 2021 to 2032

Figure 25: Global Market Attractiveness by End Use, 2022 to 2032

Figure 26: Global Market Absolute $ Opportunity, 2021 to 2032, by Automotive segment

Figure 27: Global Market Absolute $ Opportunity, 2021 to 2032, by Aerospace segment

Figure 28: Global Market Absolute $ Opportunity, 2021 to 2032, by Electrical and Electronics segment

Figure 29: Global Market Absolute $ Opportunity, 2021 to 2032, by Marine and Construction equip segment

Figure 30: Global Market Absolute $ Opportunity, 2021 to 2032, by Other segments

Figure 31: Global Market Share and BPS Analysis By Region – 2022 and 2032

Figure 32: Global Market Y-o-Y Growth Projections By Region, 2021 to 2032

Figure 33: Global Market Attractiveness By Region, 2022 to 2032

Figure 34: North America Market Absolute $ Opportunity, 2021 to 2032

Figure 35: Global Market Absolute $ Opportunity, 2021 to 2032

Figure 36: Europe Market Absolute $ Opportunity, 2021 to 2032

Figure 37: East Asia Market Absolute $ Opportunity, 2021 to 2032

Figure 38: South Asia and Pacific Market Absolute $ Opportunity, 2021 to 2032

Figure 39: Middle East and Africa Market Absolute $ Opportunity, 2021 to 2032

Figure 40: North America Market Share and BPS Analysis by Country – 2022 and 2032

Figure 41: North America Market Y-o-Y Growth Projections by Country, 2021 to 2032

Figure 42: North America Market Attractiveness by Country, 2022 to 2032

Figure 43: North America Market Share and BPS Analysis by USA – 2022 and 2032

Figure 44: North America Market Y-o-Y Growth Projections by USA, 2021 to 2032

Figure 45: North America Market Attractiveness by USA, 2022 to 2032

Figure 46: USA Market Absolute $ Opportunity, 2021 to 2032

Figure 47: Canada Market Absolute $ Opportunity, 2021 to 2032

Figure 48: North America Market Share and BPS Analysis by Product Type to 2022 and 2032

Figure 49: North America Market Y-o-Y Growth Projections by Product Type, 2021 to 2032

Figure 50: North America Market Attractiveness by Product Type, 2022 to 2032

Figure 51: North America Market Share and BPS Analysis by Operation to 2022 and 2032

Figure 52: North America Market Y-o-Y Growth Projections by Operation, 2021 to 2032

Figure 53: North America Market Attractiveness by Operation, 2022 to 2032

Figure 54: North America Market Share and BPS Analysis by End Use – 2022 and 2032

Figure 55: North America Market Y-o-Y Growth Projections by End Use, 2021 to 2032

Figure 56: North America Market Attractiveness by End Use, 2022 to 2032

Figure 57: Latin America Market Share and BPS Analysis by Country – 2022 and 2032

Figure 58: Latin America Market Y-o-Y Growth Projections by Country, 2021 to 2032

Figure 59: Latin America Market Attractiveness by Country, 2022 to 2032

Figure 60: Brazil Market Absolute $ Opportunity, 2021 to 2032

Figure 61: Mexico Market Absolute $ Opportunity, 2021 to 2032

Figure 62: Rest of Latin America Market Absolute $ Opportunity, 2021 to 2032

Figure 63: Latin America Market Share and BPS Analysis by Product Type – 2022 and 2032

Figure 64: Latin America Market Y-o-Y Growth Projections by Product Type, 2021 to 2032

Figure 65: Latin America Market Attractiveness by Product Type, 2022 to 2032

Figure 66: Latin America Market Share and BPS Analysis by Operation – 2022 and 2032

Figure 67: Latin America Market Y-o-Y Growth Projections by Operation, 2021 to 2032

Figure 68: Latin America Market Attractiveness by Operation, 2022 to 2032

Figure 69: Latin America Market Share and BPS Analysis by End Use – 2022 and 2032

Figure 70: Latin America Market Y-o-Y Growth Projections by End Use, 2021 to 2032

Figure 71: Latin America Market Attractiveness by End Use, 2022 to 2032

Figure 72: Europe Market Share and BPS Analysis by Country – 2022 and 2032

Figure 73: Europe Market Y-o-Y Growth Projections by Country, 2021 to 2032

Figure 74: Europe Market Attractiveness by Country, 2022 to 2032

Figure 75: Germany Market Absolute $ Opportunity, 2021 to 2032

Figure 76: Italy Market Absolute $ Opportunity, 2021 to 2032

Figure 77: France Market Absolute $ Opportunity, 2021 to 2032

Figure 78: U.K. Market Absolute $ Opportunity, 2021 to 2032

Figure 79: Spain Market Absolute $ Opportunity, 2021 to 2032

Figure 80: BENELUX Market Absolute $ Opportunity, 2021 to 2032

Figure 81: Russia Market Absolute $ Opportunity, 2021 to 2032

Figure 82: Sweden Market Absolute $ Opportunity, 2021 to 2032

Figure 83: Hungary Market Absolute $ Opportunity, 2021 to 2032

Figure 84: Czechia Market Absolute $ Opportunity, 2021 to 2032

Figure 85: Poland Market Absolute $ Opportunity, 2021 to 2032

Figure 86: Portugal Market Absolute $ Opportunity, 2021 to 2032

Figure 87: Rest of Europe Market Absolute $ Opportunity, 2021 to 2032

Figure 88: Europe Market Share and BPS Analysis by Product Type – 2022 and 2032

Figure 89: Europe Market Y-o-Y Growth Projections by Product Type, 2021 to 2032

Figure 90: Europe Market Attractiveness by Product Type, 2022 to 2032

Figure 91: Europe Market Share and BPS Analysis by Operation – 2022 and 2032

Figure 92: Europe Market Y-o-Y Growth Projections by Operation, 2021 to 2032

Figure 93: Europe Market Attractiveness by Operation, 2022 to 2032

Figure 94: Europe Market Share and BPS Analysis by End Use – 2022 and 2032

Figure 95: Europe Market Y-o-Y Growth Projections by End Use, 2021 to 2032

Figure 96: Europe Market Attractiveness by End Use, 2022 to 2032

Figure 97: East Asia Market Share and BPS Analysis by Country – 2022 and 2032

Figure 98: East Asia Market Y-o-Y Growth Projections by Country, 2021 to 2032

Figure 99: East Asia Market Attractiveness by Country, 2022 to 2032

Figure 100: China Market Absolute $ Opportunity, 2021 to 2032

Figure 101: Japan Market Absolute $ Opportunity, 2021 to 2032

Figure 102: South Korea Market Absolute $ Opportunity, 2021 to 2032

Figure 103: East Asia Market Share and BPS Analysis by Product Type – 2022 and 2032

Figure 104: East Asia Market Y-o-Y Growth Projections by Product Type, 2021 to 2032

Figure 105: East Asia Market Attractiveness by Product Type, 2022 to 2032

Figure 106: East Asia Market Share and BPS Analysis by Operation – 2022 and 2032

Figure 107: East Asia Market Y-o-Y Growth Projections by Operation, 2021 to 2032

Figure 108: East Asia Market Attractiveness by Operation, 2022 to 2032

Figure 109: East Asia Market Share and BPS Analysis by End Use – 2022 and 2032

Figure 110: East Asia Market Y-o-Y Growth Projections by End Use, 2021 to 2032

Figure 111: East Asia Market Attractiveness by End Use, 2022 to 2032

Figure 112: South Asia and Pacific Market Share and BPS Analysis by Country – 2022 and 2032

Figure 113: South Asia and Pacific Market Y-o-Y Growth Projections by Country, 2021 to 2032

Figure 114: South Asia and Pacific Market Attractiveness by Country, 2022 to 2032

Figure 115: India Market Absolute $ Opportunity, 2021 to 2032

Figure 116: ASEAN Market Absolute $ Opportunity, 2021 to 2032

Figure 117: Australia and New Zealand Market Absolute $ Opportunity, 2021 to 2032

Figure 118: Rest of SAP Market Absolute $ Opportunity, 2021 to 2032

Figure 119: South Asia and Pacific Market Share and BPS Analysis by Product Type – 2022 and 2032

Figure 120: South Asia and Pacific Market Y-o-Y Growth Projections by Product Type, 2021 to 2032

Figure 121: South Asia and Pacific Market Attractiveness by Product Type, 2022 to 2032

Figure 122: South Asia and Pacific Market Share and BPS Analysis by Operation – 2022 and 2032

Figure 123: South Asia and Pacific Market Y-o-Y Growth Projections by Operation, 2021 to 2032

Figure 124: South Asia and Pacific Market Attractiveness by Operation, 2022 to 2032

Figure 125: South Asia and Pacific Market Share and BPS Analysis by End Use – 2022 and 2032

Figure 126: South Asia and Pacific Market Y-o-Y Growth Projections by End Use, 2021 to 2032

Figure 127: South Asia and Pacific Market Attractiveness by End Use, 2022 to 2032

Figure 128: Middle East and Africa Market Share and BPS Analysis by Country – 2022 and 2032

Figure 129: Middle East and Africa Market Y-o-Y Growth Projections by Country, 2021 to 2032

Figure 130: Middle East and Africa Market Attractiveness by Country, 2022 to 2032

Figure 131: GCC Countries Market Absolute $ Opportunity, 2021 to 2032

Figure 132: Turkey Market Absolute $ Opportunity, 2021 to 2032

Figure 133: Northern Africa Market Absolute $ Opportunity, 2021 to 2032

Figure 134: South Africa Market Absolute $ Opportunity, 2021 to 2032

Figure 135: Rest of MEA Market Absolute $ Opportunity, 2021 to 2032

Figure 136: Middle East and Africa Market Share and BPS Analysis by Product Type – 2022 and 2032

Figure 137: Middle East and Africa Market Y-o-Y Growth Projections by Product Type, 2021 to 2032

Figure 138: Middle East and Africa Market Attractiveness by Product Type, 2022 to 2032

Figure 139: Middle East and Africa Market Share and BPS Analysis by Operation – 2022 and 2032

Figure 140: Middle East and Africa Market Y-o-Y Growth Projections by Operation, 2021 to 2032

Figure 141: Middle East and Africa Market Attractiveness by Operation, 2022 to 2032

Figure 142: Middle East and Africa Market Share and BPS Analysis by End Use – 2022 and 2032

Figure 143: Middle East and Africa Market Y-o-Y Growth Projections by End Use, 2021 to 2032

Figure 144: Middle East and Africa Market Attractiveness by End Use, 2022 to 2032

Recommendations

Industrial Automation

Laser Cutting Machine Market

Published : April 2024

Industrial Automation

Automatic Bending Machine Market

Published : February 2024

Industrial Automation

Laser Welding Equipment Market

Published : January 2024

Industrial Automation

Edge Bending Machine Market

Published : October 2022

Explore Industrial Automation Insights

View Reports

Cutting and Bending Machine Market