Reports

- Global Locations -

Headquarters

Future Market Insights, Inc.

Christiana Corporate, 200
Continental Drive, Suite 401,
Newark, Delaware - 19713,
United States

T: +1-845-579-5705

Americas

Future Market Insights, Inc.

616 Corporate Way, Suite 2-9018,
Valley Cottage, NY 10989, United States

T: +1-347-918-3531

MEA

Future Market Insights

1602-6 Jumeirah Bay X2 Tower, Plot No: JLT-PH2-X2A,
Jumeirah Lakes Towers, Dubai,
United Arab Emirates

Europe

Future Market Insights

3rd Floor, 207 Regent Street,
W1B 3HH London
United Kingdom

T: + 44 (0) 20 8123 9659
D: +44 (0) 20 3287 4268

Asia Pacific

Future Market Insights

IndiaLand Global Tech Park, Unit UG-1, Behind Grand HighStreet, Phase 1, Hinjawadi, MH, Pune – 411057, India

Fish Cutting Machine Market Outlook (2023 to 2033)

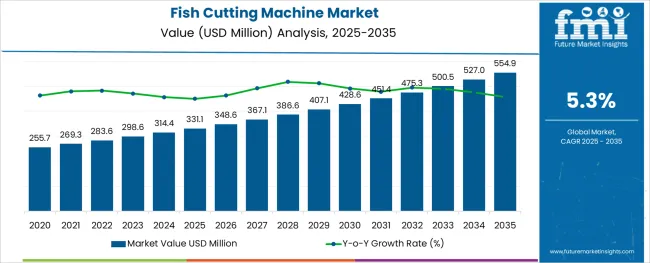
The global fish cutting machine market is projected to have a moderate-paced CAGR of 5.3% during the forecast period. The current valuation of the fish cutting machine market is US$ 298.6 million in 2023. The value of the fish cutting machine market is anticipated to reach a high of US$ 500.5 million by the year 2033. A historical CAGR of 4.2% has been recorded by the experts of Future Market Insights for the market concerned.

Attribute Details
Market Value (2023) US$ 298.6 million
Market Value (2033) US$ 500.5 million
CAGR 5.3%

This growth in the sales of fish cutting machines is supported by the following:

  • Rising demand and consumption of fresh fish products in both developed and emerging nations
  • The FAO reports that the global consumption of fish for human consumption has expanded at a rate far faster than the global population.
  • More people are learning about the health benefits of fresh fish, such as lowering the risk of chronic diseases and restoring hormonal balance.

Don't pay for what you don't need

Customize your report by selecting specific countries or regions and save 30%!

The Growth of Fish Market in India and Indonesia

Developing economies, such as India and Indonesia, are increasing their fish output, which is a major factor propelling the fish cutting machine market. Rising urbanization and personal income have both contributed to greater demand for fresh fish, which is in high demand due to its high protein content. In addition, the fish cutting machine market expansion is anticipated to be boosted throughout the forecast period by the rising demand for premium-grade food products due to the freshness and diversity of the products.

However, in recent years, foreign trade has become increasingly important due to increased government assistance and improved transport infrastructure. To guarantee the traceability and quality control of their exports, the Marine Products Export Development Authority (MPEDA) in India has begun work on a GPS-based database of aquaculture farms with an eye toward export. In May of 2020, the Indian government authorized the Pradhan Mantri Matsya Sampada Yojana (PMMSY) as part of the Aatmanirbhar Bharat COVID-19 Relief Programme, with the goal of developing the fisheries sector in a sustainable and responsible manner. In the same vein, Indonesia has its PROTEKAN (Program to Increase Fisheries Exports) initiative, which also seeks to boost cutting equipment exports. As a result, more fish is likely to be farmed with an eye toward export, which is likely to lead to a rise in both cutting equipment production and consumption.

The tremendous opportunity for international trade is what really moves the Indian fish market. About 6 percent of global output is sold in this market. There is little doubt that the country is currently one of the world's leading seafood suppliers. The Indian fish market has been bolstered by the rapid expansion of both domestic consumption and fish exports in recent years. A rise in recent years has also been seen in the quantity of fish eaten per person.

Many reasons are currently pushing up demand for fish cutting machines in India. Some of these factors are the general trend toward a healthier diet, the ever-increasing price of meat, and the growing recognition that fish is a good source of digestible protein, cholesterol-lowering capabilities, and polyunsaturated fatty acids (PUFA).

Key Drivers for the Fish Cutting Machine Market

Fish's positive effects on human health are increasingly being recognized.

As more people learn about the benefits of fresh fish for their health, such as reducing the risk of chronic diseases and regulating hormone levels, the fish cutting machine market is predicted to show development prospects throughout the forecasted period. Since many people are looking to cut back on calories, diets high in protein are becoming increasingly popular, driving up demand in the market. As a low-fat protein source crucial for muscle growth, as well as a source of iron and vitamins like omega-3 fatty acids, fish food has been a driving force in the fish cutting machine industry's growth.

Market expansion is being driven by rising demand in both developed and developing economies.

In both developed and emerging countries, demand, and consumption of fresh fish products are on the rise, which is expected to drive the fish cutting machine industry. The FAO found that the global rise in fish eaten for sustenance has far outpaced the rise in the world's population. Rising industrial cutting equipment output in emerging economies like India and Indonesia is the main factor propelling the market forward. Rising urbanization and personal income have led to an increase in the demand for protein-rich fish meals, which in turn has led to a surge in the fresh fish market. Market growth in the next years is also expected to be fuelled by the wide range of products available and the rising demand for high-quality meals.

Boosted government investment in fishing has led to a rise in exports, which is fuelling the market.

The rising global output of fish products, enhancements to the cold chain, transportation, and distribution channels, and subsequent increases in demand have all contributed to the current state of the fish product market. Recent years, however, have seen an uptick in the significance of international trade as a result of improved transit infrastructure and expanding government support, and increasing the growth in fish cutting machine market share.
Nandini Roy Choudhury

Principal Consultant

Talk to Analyst

Find your sweet spots for generating winning opportunities in this market.

Comparative Analysis of Adjacent Markets

Fish Cutting Machine Market:

Differentiating Aspects Fish Cutting Machine Market
CAGR 5.3%
Market Valuation in 2023 US$ 298.6 million
Projected Market Value in 2033 US$ 500.5 Million
Drivers
  • Market expansion is being fuelled by rising demand from both developed and developing countries.
  • Production of fish for export is on the rise thanks to government incentives, and this is pushing the fish cutting machine market forward.

Fish Oil Market:

Differentiating Aspects Fish Oil Market
CAGR 5.79%
Market Valuation in 2023 US$ 1905 million
Projected Market Value in 2033 US$ 2844 million
Drivers
  • The rising demand for EPA and DHA in human nutrition has made a notable impact on the global fish oil market.
  • The growing awareness among medical professionals and the public about the importance of omega-3 fatty acids has led to a significant increase in fish oil consumption.

Aquafeed Market:

Differentiating Aspects Aquafeed Market
CAGR 5.6%
Market Valuation in 2023 US$ 78,686.7 million
Projected Market Value in 2033 US$ 131,926.4 million
Drivers
  • The rising global demand for fish and rising consumer awareness of the need of purchasing high-quality seafood have both contributed to the expansion of the aquafeed industry.
  • Increases in disposable income, especially in emerging countries, should help the aquaculture and aquafeed sectors continue expanding.

Category-wise Insights

  • The sales of processed seafood are expected to increase the most in the supermarkets and hypermarkets distribution channels. Expected expansion in the sector can be attributed in large part to the fact that consumers rely heavily on supermarkets and hypermarkets to acquire food staples and processed foods. This is also impacting the fish cutting machine market sales.
  • The online sales channel is anticipated to be the fastest-growing segment during the projected period, regardless of the distribution method. For many people, buying meal supplies and industrial cutting equipment is easiest and most convenient when done online. This is because of the many advantages of shopping online, including convenience, access to detailed product descriptions, and doorstep delivery. In addition, shoppers choose to purchase goods online due to the ease of doing so and the availability of more brands than can be found in a typical brick-and-mortar store. In addition, the online sales channel has expanded customer reach, making it an increasingly important revenue generator for many businesses. As time goes on and more people have access to the internet, shoppers learn to recognize the huge variety of societal buying habits. Younger generations, including millennials and Z, are drawn to technology, and it is anticipated that this is expected to influence their purchasing habits. However, users may opt to purchase adult incontinence products online due to time constraints. The percentage of retail sales attributable to e-commerce is projected to rise from 16% in 2015 to 19% in 2020, as reported by the United Nations Conference on Trade and Development (UNCTAD). The proliferation of smartphones also bodes well for the future of online retail. The expansion of this market is fueled in part by the rising popularity of online shopping, as well as the enhancements to logistical services and the simplification of payment alternatives.

Get the data you need at a Fraction of the cost

Personalize your report by choosing insights you need
and save 40%!

Regional Insights

United States:

Market Value (2033) US$ 125.1 million
CAGR (%) 5.7

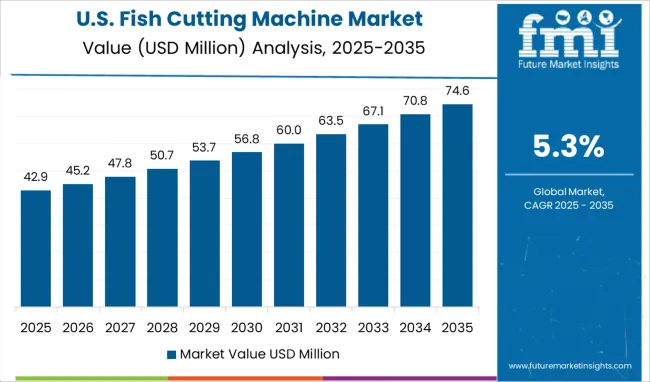
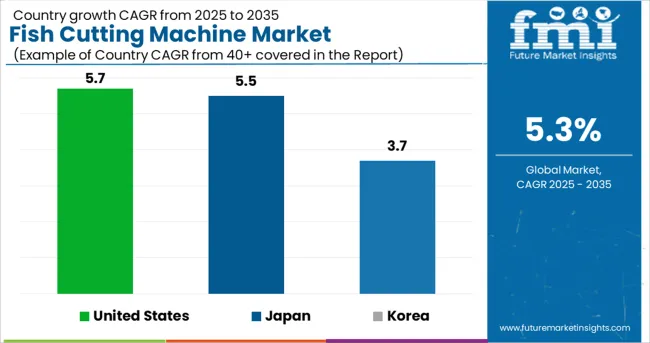
The USA market is expected to rise at a rate of 5.7% to reach a valuation of US$ 125.1 million by 2033.

Canned, frozen, and chilled fish are some of the most popular forms of processed fish consumed in the USA significant growth in the global fish cutting machine market can be attributed to several factors, including rising consumer awareness of the health benefits of seafood, rising demand for organic fish products, many restaurants and cafes, deeper market penetration by packaged food and top food processing companies, and rising demand for convenience food products.

Europe:

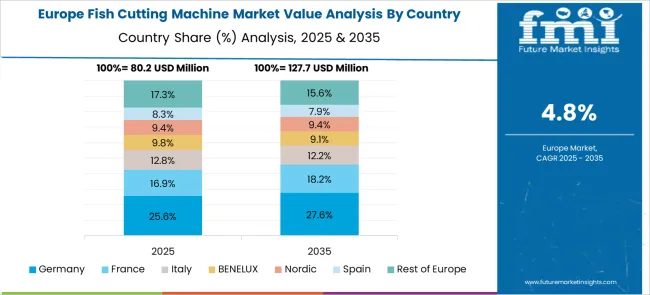
The European fish cutting machine market is growing rapidly because of the region's expanding consciousness of the health benefits and rising appeal because of sustainability. In addition, the growing awareness of the link between poor diet and accelerated aging of the skin and bones, as well as the epidemic of cardiovascular disease, is driving up the demand for industrial cutting equipment across Europe. In addition, the market expansion is anticipated to be boosted throughout the forecast period by the rising demand for premium-grade fish products due to freshness, diversity of the goods, and convenience for food safety.

Japan:

Market Value (2033) US$ 31.5 million
CAGR (%) 5.5

The Japan market is expected to rise at a rate of 5.5% through the forecast period and reach a market valuation of US$ 31.5 million by 2033.

Now, Japan is one of the world's largest marketplaces for fish. The country currently has the second-highest per capita seafood intake in the world. The growing interest in eating more nutritiously is a key aspect of Japan's fish cutting machine market. Because of Japan's rapidly aging population, demand is expected to rise for fish cutting machines and fish products that provide health benefits such as reduced cholesterol levels, increased micronutrient intake, and increased intake of vital fatty acids. The expanding number of single-person homes and women in the workforce is also contributing to the growth of the country's fish cutting machine market. The market is predicted to develop as a result of several factors, including the increasing popularity of ready-to-eat meals, semi-processed items, and seafood products that require minimal preparation time, as well as shifts in consumer preferences and spending on healthcare.

Korea:

Market Value (2033) US$ 12.5 million
CAGR (%) 3.7

The Korean market is expected to rise at a rate of 3.7% through the forecast period and reach a market valuation of US$ 12.5 million by 2033.

Due to domestic and regional limits on local production, South Korea is increasingly reliant on imports to meet its fish and seafood demands. Strong market growth is being seen for imported items that offer value, quality, nutritional benefits, novel flavors, and convenience.

With an increase of 28% over 2015, South Korea spent US$5.7 billion importing fish and shellfish in 2019. Even though over a hundred other countries provided fish and seafood for Korea's imports, the countries of China, Russia, Vietnam, and Norway accounted for most of the country's supply. These four countries accounted for a whopping 78.1% of the republic's total export market share. This is also impacting the fish cutting machine market outlook.

Start-up Ecosystem

New Entrants to Foster Innovation in the Global Market

The startups in the fish cutting machine market are adding a new edge to the properties of excavators by curating innovations beyond the imagination. They are continually upgrading the fish cutting machine with advanced technology and curating innovative types of bags that are gaining consumer attention, like bright and vibrant colors and greater accessibility. Start-up firms are triggering the expansion of the fish cutting machine market with their unique attempts.
Competitive Landscape

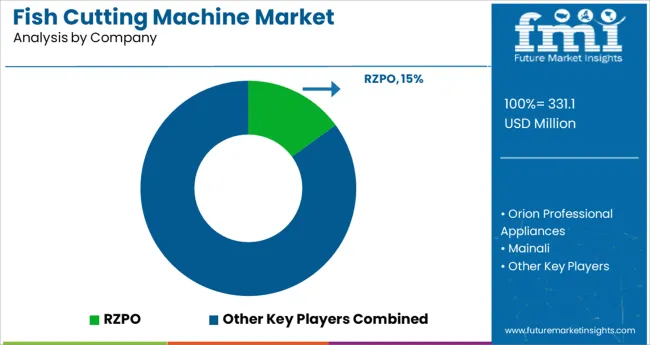
In order to boost profits and solidify their foothold in the fish cutting machine market, major players in the industry have turned to mergers and acquisitions, as well as strategic partnerships.

2 Iconic Companies Having Major Dominance

RZPO Manufacture of Food-Related Processing Machinery (RZPO). The company has 2 factories to make a variety of process equipment, including smoke and defrost climatic and thermal cameras, injectors, hygiene stations, shrink tanks, and more. An extensive assortment of non-standard food processing machinery. The created equipment is of the same caliber as the best in the world. In addition, they provide the highest quality imported processing machinery for a wide variety of foods, including fish, meat, cheese, and vegetables. This includes filleting machines, slicers for slicing, skinning machines, industrial cutting equipment, skinning machine, washing machines for fish or containers, conveyors for industrial cutting equipment, injectors, refrigerated containers, and much more. They have a division devoted to designing and installing industrial refrigeration systems for use in the cooling and climate control of factories and warehouses and can provide estimates for any size of the refrigeration system in Bitzer, Frascold.
Mainali Mainali has been making equipment for the food sector for over 20 years. The company specializes in the production of cutting and pressing machines for a wide variety of products. The company has become an industry standard by pioneering cutting-edge machinery and leading the way in the development of durable technology. The organization has been able to expand internationally because of its history and past successes.

Key Segments in the Fish Cutting Machine Market

Mechanism / Technology:

  • Manual
  • Automatic

Capacity (Kg/h):

  • <50
  • 50-150
  • 150-300
  • >300

Fish Type:

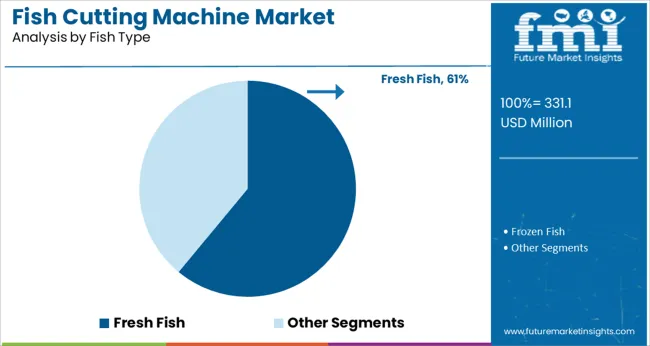
  • Frozen Fish
  • Fresh Fish

End User:

  • Food Service Sector
  • Food Processors

Sales Channel:

  • Offline
  • Online

By Region:

  • North America
  • Latin America
  • Asia Pacific
  • Middle East and Africa (MEA)
  • Europe

Frequently Asked Questions

What is the Growth Outlook for the Fish Cutting Machine Market?

The growth outlook for the fish cutting machine market is predicted to advance at a CAGR of 5.3% from 2023 to 2033.

Which Region Leads the Fish Cutting Machine Market?

The North American region is anticipated to lead the fish cutting machine market during the forecast period.

What is the market valuation of Fish Cutting Machine in 2022?

The market valuation of the fish cutting machine market stands at US$ 298.6 Million in 2023.

How much Growth Potential does Fish Cutting Machine hold?

The fish cutting machine market is likely to hold a valuation of US$ 500.5 Million by 2033.

Which sector is the key driver in the Fish Cutting Machine Market?

The hospitality sector is the key driver in the fish cutting machine market.

Table of Content

1. Market - Executive Summary | Fish Cutting Machine Market

2. Market Overview

    2.1. Market Definition and Introduction

    2.2. Market Taxonomy/ Research Scope

3. Market Background and Foundation Data 

    3.1. Global Fishing Industry Outlook

    3.2. Fish Cutting Machine: Apparent Production & Shipment Analysis

        3.2.1. Production Capacity (Units)

            3.2.1.1. By Key Regions

            3.2.1.2. By Key Companies

        3.2.2. Sales Statistics

        3.2.3. Apparent Trade Analysis

    3.3. Market Opportunity Assessment

        3.3.1. Total Available Market (US$ million)

        3.3.2. Serviceable Addressable Market (US$ million)

        3.3.3. Serviceable Obtainable Market (US$ million)

    3.4. Market White Space Assessment

    3.5. Market Dynamics

        3.5.1. Market Growth Drivers

        3.5.2. Market Restraints

        3.5.3. Market Opportunity

        3.5.4. Market Trends

    3.6. Industry Value and Supply Chain Analysis

        3.6.1. Value Added at Each Node of Supply Chain

        3.6.2. Gross Profitability Margins (at Every Level)

        3.6.3. List of Key Participants

            3.6.3.1. Raw Material Supplier

            3.6.3.2. Manufacturers

            3.6.3.3. Distributors

            3.6.3.4. End Users (Prominent)

    3.7. Forecast and Macro-Economic Factors - Relevance and Impact

    3.8. PESTLE Analysis

    3.9. Porter’s Five Force Analysis

    3.10. Investment Feasibility Analysis

    3.11. Key Success Factors

4. Global Demand (Units) Analysis and Forecast

    4.1. Historical Market Volume (Units) Analysis, 2018 to 2022

    4.2. Current and Future Market Volume (Units) Projections, 2023 to 2033

    4.3. Y-o-Y Volume Growth Trend Analysis

5. Global Market - Pricing Analysis

    5.1. Product Type and Country-Level Pricing Analysis

    5.2. Global Average Pricing Analysis Benchmark

    5.3. Factors Influencing Pricing

6. Global Market Value (US$ million) Analysis and Forecast

    6.1. Historical Market Value (US$ million) Analysis, 2018 to 2022

    6.2. Current and Future Market Value (US$ million) Projections, 2023 to 2033

        6.2.1. Y-o-Y Growth Trend Analysis

        6.2.2. Absolute $ Opportunity Analysis

7. Global Market Analysis and Forecast, By Mechanism / Technology 

    7.1. Introduction / Key Findings

    7.2. Historical Market Size (US$ million) and Volume (Units) Analysis By Mechanism / Technology, 2018 to 2022

    7.3. Current and Future Market Size (US$ million) Analysis and Volume (Units) Forecast By Mechanism / Technology, 2023 to 2033

        7.3.1. Manual

        7.3.2. Automatic

            7.3.2.1. Semi-automatic

            7.3.2.2. Fully-automatic

    7.4. Market Attractiveness Analysis By Mechanism / Technology

8. Global Market Analysis and Forecast, By Capacity (Kg/h) 

    8.1. Introduction / Key Findings

    8.2. Historical Market Size (US$ million) and Volume (Units) Analysis By Capacity (Kg/h), 2018 to 2022

    8.3. Current and Future Market Size (US$ million) Analysis and Volume (Units) Forecast By Capacity (Kg/h), 2023 to 2033

        8.3.1. <50

        8.3.2. 50-150

        8.3.3. 150-300

        8.3.4. >300

    8.4. Market Attractiveness Analysis By Capacity (Kg/h)

9. Global Market Analysis and Forecast, By Fish Type 

    9.1. Introduction / Key Findings

    9.2. Historical Market Size (US$ million) and Volume (Units) Analysis By Fish Type, 2018 to 2022

    9.3. Current and Future Market Size (US$ million) Analysis and Volume (Units) Forecast By Fish Type, 2023 to 2033

        9.3.1. Frozen Fish

            9.3.1.1. Boneless

            9.3.1.2. Boney

        9.3.2. Fresh Fish

    9.4. Market Attractiveness Analysis By Fish Type

10. Global Market Analysis and Forecast, By End User

    10.1. Introduction / Key Findings

    10.2. Historical Market Size (US$ million) and Volume (Units) Analysis By End User, 2018 to 2022

    10.3. Current and Future Market Size (US$ million) Analysis and Volume (Units) Forecast By End User, 2023 to 2033

        10.3.1. Food Service Sector

        10.3.2. Food Processors

    10.4. Market Attractiveness Analysis By End User

11. Global Market Analysis and Forecast, By Sales Channel

    11.1. Introduction / Key Findings

    11.2. Historical Market Size (US$ million) and Volume (Units) Analysis By Sales Channel, 2018 to 2022

    11.3. Current and Future Market Size (US$ million) Analysis and Volume (Units) Forecast By Sales Channel, 2023 to 2033

        11.3.1. Offline

        11.3.2. Online

    11.4. Market Attractiveness Analysis By Sales Channel

12. Global Market Analysis and Forecast, By Region

    12.1. Introduction

    12.2. Historical Market Size (US$ million) and Volume (Units) Analysis By Region, 2018 to 2022

    12.3. Current Market Size (US$ million) Analysis and Volume (Units) Forecast By Region, 2023 to 2033

        12.3.1. North America

        12.3.2. Latin America

        12.3.3. Europe

        12.3.4. East Asia

        12.3.5. South Asia & Oceania

        12.3.6. Middle East & Africa

    12.4. Market Attractiveness Analysis By Region

13. North America Market Analysis and Forecast 

    13.1. Introduction / Key Findings

    13.2. Pricing Analysis

    13.3. Historical Market Size (US$ million) and Volume (Units) Trend Analysis By Market Taxonomy, 2018 to 2022

    13.4. Market Size (US$ million) and Volume (Units) Forecast By Market Taxonomy, 2023 to 2033

        13.4.1. By Country

            13.4.1.1. USA

            13.4.1.2. Canada

        13.4.2. By Mechanism / Technology

        13.4.3. By Capacity (Kg/h)

        13.4.4. By Fish Type

        13.4.5. By End User

        13.4.6. By Sales Channel

    13.5. Market Attractiveness Analysis

        13.5.1. By Country

        13.5.2. By Mechanism / Technology

        13.5.3. By Capacity (Kg/h)

        13.5.4. By Fish Type

        13.5.5. By End User

        13.5.6. By Sales Channel

14. Latin America Market Analysis and Forecast 

    14.1. Introduction / Key Findings

    14.2. Pricing Analysis

    14.3. Historical Market Size (US$ million) and Volume (Units) Trend Analysis By Market Taxonomy, 2018 to 2022

    14.4. Market Size (US$ million) and Volume (Units) Forecast By Market Taxonomy, 2023 to 2033

        14.4.1. By Country

            14.4.1.1. Brazil

            14.4.1.2. Mexico

            14.4.1.3. Argentina

            14.4.1.4. Rest of Latin America

        14.4.2. By Mechanism / Technology

        14.4.3. By Capacity (Kg/h)

        14.4.4. By Fish Type

        14.4.5. By End User

        14.4.6. By Sales Channel

    14.5. Market Attractiveness Analysis

        14.5.1. By Country

        14.5.2. By Mechanism / Technology

        14.5.3. By Capacity (Kg/h)

        14.5.4. By Fish Type

        14.5.5. By End User

        14.5.6. By Sales Channel

15. Europe Market Analysis and Forecast 

    15.1. Introduction / Key Findings

    15.2. Pricing Analysis

    15.3. Historical Market Size (US$ million) and Volume (Units) Trend Analysis By Market Taxonomy, 2018 to 2022

    15.4. Market Size (US$ million) and Volume (Units) Forecast By Market Taxonomy, 2023 to 2033

        15.4.1. By Country

            15.4.1.1. Germany

            15.4.1.2. France

            15.4.1.3. Italy

            15.4.1.4. Spain

            15.4.1.5. U.K.

            15.4.1.6. BENELUX

            15.4.1.7. Russia

            15.4.1.8. Rest of Europe

        15.4.2. By Mechanism / Technology

        15.4.3. By Capacity (Kg/h)

        15.4.4. By Fish Type

        15.4.5. By End User

        15.4.6. By Sales Channel

    15.5. Market Attractiveness Analysis

        15.5.1. By Country

        15.5.2. By Mechanism / Technology

        15.5.3. By Capacity (Kg/h)

        15.5.4. By Fish Type

        15.5.5. By End User

        15.5.6. By Sales Channel

16. East Asia Market Analysis and Forecast 

    16.1. Introduction / Key Findings

    16.2. Pricing Analysis

    16.3. Historical Market Size (US$ million) and Volume (Units) Trend Analysis By Market Taxonomy, 2018 to 2022

    16.4. Market Size (US$ million) and Volume (Units) Forecast By Market Taxonomy, 2023 to 2033

        16.4.1. By Country

            16.4.1.1. China

            16.4.1.2. Japan

            16.4.1.3. South Korea

        16.4.2. By Mechanism / Technology

        16.4.3. By Capacity (Kg/h)

        16.4.4. By Fish Type

        16.4.5. By End User

        16.4.6. By Sales Channel

    16.5. Market Attractiveness Analysis

        16.5.1. By Country

        16.5.2. By Mechanism / Technology

        16.5.3. By Capacity (Kg/h)

        16.5.4. By Fish Type

        16.5.5. By End User

        16.5.6. By Sales Channel

17. South Asia & Oceania Market Analysis and Forecast 

    17.1. Introduction / Key Findings

    17.2. Pricing Analysis

    17.3. Historical Market Size (US$ million) and Volume (Units) Trend Analysis By Market Taxonomy, 2018 to 2022

    17.4. Market Size (US$ million) and Volume (Units) Forecast By Market Taxonomy, 2023 to 2033

        17.4.1. By Country

            17.4.1.1. India

            17.4.1.2. Thailand

            17.4.1.3. Indonesia

            17.4.1.4. Malaysia

            17.4.1.5. Australia & New Zealand

            17.4.1.6. Rest of South Asia & Oceania

        17.4.2. By Mechanism / Technology

        17.4.3. By Capacity (Kg/h)

        17.4.4. By Fish Type

        17.4.5. By End User

        17.4.6. By Sales Channel

    17.5. Market Attractiveness Analysis

        17.5.1. By Country

        17.5.2. By Mechanism / Technology

        17.5.3. By Capacity (Kg/h)

        17.5.4. By Fish Type

        17.5.5. By End User

        17.5.6. By Sales Channel

18. Middle East & Africa Market Analysis and Forecast 

    18.1. Introduction / Key Findings

    18.2. Pricing Analysis

    18.3. Historical Market Size (US$ million) and Volume (Units) Trend Analysis By Market Taxonomy, 2018 to 2022

    18.4. Market Size (US$ million) and Volume (Units) Forecast By Market Taxonomy, 2023 to 2033

        18.4.1. By Country

            18.4.1.1. GCC Countries

            18.4.1.2. South Africa

            18.4.1.3. Northern Africa

            18.4.1.4. Turkey

            18.4.1.5. Rest of Middle East & Africa

        18.4.2. By Mechanism / Technology

        18.4.3. By Capacity (Kg/h)

        18.4.4. By Fish Type

        18.4.5. By End User

        18.4.6. By Sales Channel

    18.5. Market Attractiveness Analysis

        18.5.1. By Country

        18.5.2. By Mechanism / Technology

        18.5.3. By Capacity (Kg/h)

        18.5.4. By Fish Type

        18.5.5. By End User

        18.5.6. By Sales Channel

19. Country-level Market Analysis and Forecast 

    19.1. Introduction / Key Findings

        19.1.1. Market Value Proportion Analysis, By Key Countries

        19.1.2. Global Vs. Country Growth Comparison

    19.2. US Market Analysis

        19.2.1. Value Proportion Analysis by Market Taxonomy

        19.2.2. Volume (Units) and Value (US$ million) Analysis and Forecast by Market Taxonomy, 2018-2033

            19.2.2.1. By Mechanism / Technology

            19.2.2.2. By Capacity (Kg/h)

            19.2.2.3. By Fish Type

            19.2.2.4. By End User

            19.2.2.5. By Sales Channel

    19.3. Canada Market Analysis

        19.3.1. Value Proportion Analysis by Market Taxonomy

        19.3.2. Volume (Units) and Value (US$ million) Analysis and Forecast by Market Taxonomy, 2018-2033

            19.3.2.1. By Mechanism / Technology

            19.3.2.2. By Capacity (Kg/h)

            19.3.2.3. By Fish Type

            19.3.2.4. By End User

            19.3.2.5. By Sales Channel

    19.4. Brazil Market Analysis

        19.4.1. Value Proportion Analysis by Market Taxonomy

        19.4.2. Volume (Units) and Value (US$ million) Analysis and Forecast by Market Taxonomy, 2018-2033

            19.4.2.1. By Mechanism / Technology

            19.4.2.2. By Capacity (Kg/h)

            19.4.2.3. By Fish Type

            19.4.2.4. By End User

            19.4.2.5. By Sales Channel

    19.5. Mexico Market Analysis

        19.5.1. Value Proportion Analysis by Market Taxonomy

        19.5.2. Volume (Units) and Value (US$ million) Analysis and Forecast by Market Taxonomy, 2018-2033

            19.5.2.1. By Mechanism / Technology

            19.5.2.2. By Capacity (Kg/h)

            19.5.2.3. By Fish Type

            19.5.2.4. By End User

            19.5.2.5. By Sales Channel

    19.6. Argentina Market Analysis

        19.6.1. Value Proportion Analysis by Market Taxonomy

        19.6.2. Volume (Units) and Value (US$ million) Analysis and Forecast by Market Taxonomy, 2018-2033

            19.6.2.1. By Mechanism / Technology

            19.6.2.2. By Capacity (Kg/h)

            19.6.2.3. By Fish Type

            19.6.2.4. By End User

            19.6.2.5. By Sales Channel

    19.7. Germany Market Analysis

        19.7.1. Value Proportion Analysis by Market Taxonomy

        19.7.2. Volume (Units) and Value (US$ million) Analysis and Forecast by Market Taxonomy, 2018-2033

            19.7.2.1. By Mechanism / Technology

            19.7.2.2. By Capacity (Kg/h)

            19.7.2.3. By Fish Type

            19.7.2.4. By End User

            19.7.2.5. By Sales Channel

    19.8. France Market Analysis

        19.8.1. Value Proportion Analysis by Market Taxonomy

        19.8.2. Volume (Units) and Value (US$ million) Analysis and Forecast by Market Taxonomy, 2018-2033

            19.8.2.1. By Mechanism / Technology

            19.8.2.2. By Capacity (Kg/h)

            19.8.2.3. By Fish Type

            19.8.2.4. By End User

            19.8.2.5. By Sales Channel

    19.9. Italy Market Analysis

        19.9.1. Value Proportion Analysis by Market Taxonomy

        19.9.2. Volume (Units) and Value (US$ million) Analysis and Forecast by Market Taxonomy, 2018-2033

            19.9.2.1. By Mechanism / Technology

            19.9.2.2. By Capacity (Kg/h)

            19.9.2.3. By Fish Type

            19.9.2.4. By End User

            19.9.2.5. By Sales Channel

    19.10. Spain Market Analysis

        19.10.1. Value Proportion Analysis by Market Taxonomy

        19.10.2. Volume (Units) and Value (US$ million) Analysis and Forecast by Market Taxonomy, 2018-2033

            19.10.2.1. By Mechanism / Technology

            19.10.2.2. By Capacity (Kg/h)

            19.10.2.3. By Fish Type

            19.10.2.4. By End User

            19.10.2.5. By Sales Channel

    19.11. BENELUX Market Analysis

        19.11.1. Value Proportion Analysis by Market Taxonomy

        19.11.2. Volume (Units) and Value (US$ million) Analysis and Forecast by Market Taxonomy, 2018-2033

            19.11.2.1. By Mechanism / Technology

            19.11.2.2. By Capacity (Kg/h)

            19.11.2.3. By Fish Type

            19.11.2.4. By End User

            19.11.2.5. By Sales Channel

    19.12. Russia Market Analysis

        19.12.1. Value Proportion Analysis by Market Taxonomy

        19.12.2. Volume (Units) and Value (US$ million) Analysis and Forecast by Market Taxonomy, 2018-2033

            19.12.2.1. By Mechanism / Technology

            19.12.2.2. By Capacity (Kg/h)

            19.12.2.3. By Fish Type

            19.12.2.4. By End User

            19.12.2.5. By Sales Channel

    19.13. U.K. Market Analysis

        19.13.1. Value Proportion Analysis by Market Taxonomy

        19.13.2. Volume (Units) and Value (US$ million) Analysis and Forecast by Market Taxonomy, 2018-2033

            19.13.2.1. By Mechanism / Technology

            19.13.2.2. By Capacity (Kg/h)

            19.13.2.3. By Fish Type

            19.13.2.4. By End User

            19.13.2.5. By Sales Channel

    19.14. China Market Analysis

        19.14.1. Value Proportion Analysis by Market Taxonomy

        19.14.2. Volume (Units) and Value (US$ million) Analysis and Forecast by Market Taxonomy, 2018-2033

            19.14.2.1. By Mechanism / Technology

            19.14.2.2. By Capacity (Kg/h)

            19.14.2.3. By Fish Type

            19.14.2.4. By End User

            19.14.2.5. By Sales Channel

    19.15. Japan Market Analysis

        19.15.1. Value Proportion Analysis by Market Taxonomy

        19.15.2. Volume (Units) and Value (US$ million) Analysis and Forecast by Market Taxonomy, 2018-2033

            19.15.2.1. By Mechanism / Technology

            19.15.2.2. By Capacity (Kg/h)

            19.15.2.3. By Fish Type

            19.15.2.4. By End User

            19.15.2.5. By Sales Channel

    19.16. South Korea Market Analysis

        19.16.1. Value Proportion Analysis by Market Taxonomy

        19.16.2. Volume (Units) and Value (US$ million) Analysis and Forecast by Market Taxonomy, 2018-2033

            19.16.2.1. By Mechanism / Technology

            19.16.2.2. By Capacity (Kg/h)

            19.16.2.3. By Fish Type

            19.16.2.4. By End User

            19.16.2.5. By Sales Channel

    19.17. India Market Analysis

        19.17.1. Value Proportion Analysis by Market Taxonomy

        19.17.2. Volume (Units) and Value (US$ million) Analysis and Forecast by Market Taxonomy, 2018-2033

            19.17.2.1. By Mechanism / Technology

            19.17.2.2. By Capacity (Kg/h)

            19.17.2.3. By Fish Type

            19.17.2.4. By End User

            19.17.2.5. By Sales Channel

    19.18. ASEAN Countries Market Analysis

        19.18.1. Value Proportion Analysis by Market Taxonomy

        19.18.2. Volume (Units) and Value (US$ million) Analysis and Forecast by Market Taxonomy, 2018-2033

            19.18.2.1. By Mechanism / Technology

            19.18.2.2. By Capacity (Kg/h)

            19.18.2.3. By Fish Type

            19.18.2.4. By End User

            19.18.2.5. By Sales Channel

    19.19. Australia Market Analysis

        19.19.1. Value Proportion Analysis by Market Taxonomy

        19.19.2. Volume (Units) and Value (US$ million) Analysis and Forecast by Market Taxonomy, 2018-2033

            19.19.2.1. By Mechanism / Technology

            19.19.2.2. By Capacity (Kg/h)

            19.19.2.3. By Fish Type

            19.19.2.4. By End User

            19.19.2.5. By Sales Channel

    19.20. GCC Countries Market Analysis

        19.20.1. Value Proportion Analysis by Market Taxonomy

        19.20.2. Volume (Units) and Value (US$ million) Analysis and Forecast by Market Taxonomy, 2018-2033

            19.20.2.1. By Mechanism / Technology

            19.20.2.2. By Capacity (Kg/h)

            19.20.2.3. By Fish Type

            19.20.2.4. By End User

            19.20.2.5. By Sales Channel

    19.21. Turkey Market Analysis

        19.21.1. Value Proportion Analysis by Market Taxonomy

        19.21.2. Volume (Units) and Value (US$ million) Analysis and Forecast by Market Taxonomy, 2018-2033

            19.21.2.1. By Mechanism / Technology

            19.21.2.2. By Capacity (Kg/h)

            19.21.2.3. By Fish Type

            19.21.2.4. By End User

            19.21.2.5. By Sales Channel

    19.22. South Africa Market Analysis

        19.22.1. Value Proportion Analysis by Market Taxonomy

        19.22.2. Volume (Units) and Value (US$ million) Analysis and Forecast by Market Taxonomy, 2018-2033

            19.22.2.1. By Mechanism / Technology

            19.22.2.2. By Capacity (Kg/h)

            19.22.2.3. By Fish Type

            19.22.2.4. By End User

            19.22.2.5. By Sales Channel

20. Market Structure Analysis

    20.1. Market Analysis by Tier of Companies

    20.2. Market Concentration of Players

    20.3. Market Share Analysis of Top Players

    20.4. Market Presence Analysis

21. Competition Analysis

    21.1. Competition Dashboard

    21.2. Competition Benchmarking of Products

    21.3. Competition Deep Dive:

        21.3.1. Bharani Engineering

            21.3.1.1. Overview

            21.3.1.2. Product Portfolio

            21.3.1.3. Key Financials

            21.3.1.4. Sales Footprint

            21.3.1.5. SWOT Analysis

            21.3.1.6. Key Developments

            21.3.1.7. Strategy Overview

        21.3.2. Deccan Automation Technology

            21.3.2.1. Overview

            21.3.2.2. Product Portfolio

            21.3.2.3. Key Financials

            21.3.2.4. Sales Footprint

            21.3.2.5. SWOT Analysis

            21.3.2.6. Key Developments

            21.3.2.7. Strategy Overview

        21.3.3. Mainali

            21.3.3.1. Overview

            21.3.3.2. Product Portfolio

            21.3.3.3. Key Financials

            21.3.3.4. Sales Footprint

            21.3.3.5. SWOT Analysis

            21.3.3.6. Key Developments

            21.3.3.7. Strategy Overview

        21.3.4. Ngyustry International Co. Ltd.

            21.3.4.1. Overview

            21.3.4.2. Product Portfolio

            21.3.4.3. Key Financials

            21.3.4.4. Sales Footprint

            21.3.4.5. SWOT Analysis

            21.3.4.6. Key Developments

            21.3.4.7. Strategy Overview

        21.3.5. Orion Professional Appliances

            21.3.5.1. Overview

            21.3.5.2. Product Portfolio

            21.3.5.3. Key Financials

            21.3.5.4. Sales Footprint

            21.3.5.5. SWOT Analysis

            21.3.5.6. Key Developments

            21.3.5.7. Strategy Overview

        21.3.6. RZPO

            21.3.6.1. Overview

            21.3.6.2. Product Portfolio

            21.3.6.3. Key Financials

            21.3.6.4. Sales Footprint

            21.3.6.5. SWOT Analysis

            21.3.6.6. Key Developments

            21.3.6.7. Strategy Overview

        21.3.7. Yes Square Marketing

            21.3.7.1. Overview

            21.3.7.2. Product Portfolio

            21.3.7.3. Key Financials

            21.3.7.4. Sales Footprint

            21.3.7.5. SWOT Analysis

            21.3.7.6. Key Developments

            21.3.7.7. Strategy Overview

        21.3.8. Zhengzhou Taizy Machinery Co., LTD.

            21.3.8.1. Overview

            21.3.8.2. Product Portfolio

            21.3.8.3. Key Financials

            21.3.8.4. Sales Footprint

            21.3.8.5. SWOT Analysis

            21.3.8.6. Key Developments

            21.3.8.7. Strategy Overview

22. Assumptions & Acronyms Used

23. Research Methodology

List of Tables

Table 1. Global Market Value (US$ million) and Forecast by Region, 2018 to 2022

Table 2. Global Market Value (US$ million) and Forecast by Region, 2023 to 2033

Table 3. Global Market Volume (Units) and Forecast by Region, 2018 to 2022

Table 4. Global Market Volume (Units) and Forecast by Region, 2023 to 2033

Table 5. Global Market Value (US$ million) and Forecast By Mechanism / Technology, 2018 to 2022

Table 6. Global Market Value (US$ million) and Forecast By Mechanism / Technology, 2023 to 2033

Table 7. Global Market Volume (Units) and Forecast By Mechanism / Technology, 2018 to 2022

Table 8. Global Market Volume (Units) and Forecast By Mechanism / Technology, 2023 to 2033

Table 9. Global Market Value (US$ million) and Forecast By Capacity (Kg/h), 2018 to 2022

Table 10. Global Market Value (US$ million) and Forecast By Capacity (Kg/h), 2023 to 2033

Table 11. Global Market Volume (Units) and Forecast By Capacity (Kg/h), 2018 to 2022

Table 12. Global Market Volume (Units) and Forecast By Capacity (Kg/h), 2023 to 2033

Table 13. Global Market Value (US$ million) and Forecast By Fish Type, 2018 to 2022

Table 14. Global Market Value (US$ million) and Forecast By Fish Type, 2023 to 2033

Table 15. Global Market Volume (Units) and Forecast By Fish Type, 2018 to 2022

Table 16. Global Market Volume (Units) and Forecast By Fish Type, 2023 to 2033

Table 17. Global Market Value (US$ million) and Forecast By End User, 2018 to 2022

Table 18. Global Market Value (US$ million) and Forecast By End User, 2023 to 2033

Table 19. Global Market Volume (Units) and Forecast By End User, 2018 to 2022

Table 20. Global Market Volume (Units) and Forecast By End User, 2023 to 2033

Table 21. Global Market Value (US$ million) and Forecast By Sales Channel, 2018 to 2022

Table 22. Global Market Value (US$ million) and Forecast By Sales Channel, 2023 to 2033

Table 23. Global Market Volume (Units) and Forecast By Sales Channel, 2018 to 2022

Table 24. Global Market Volume (Units) and Forecast By Sales Channel, 2023 to 2033

Table 25. North America Market Value (US$ million) and Forecast by Country, 2018 to 2022

Table 26. North America Market Value (US$ million) and Forecast by Country, 2023 to 2033

Table 27. North America Market Volume (Units) and Forecast by Country, 2018 to 2022

Table 28. North America Market Volume (Units) and Forecast by Country, 2023 to 2033

Table 29. North America Market Value (US$ million) and Forecast By Mechanism / Technology, 2018 to 2022

Table 30. North America Market Value (US$ million) and Forecast By Mechanism / Technology, 2023 to 2033

Table 31. North America Market Volume (Units) and Forecast By Mechanism / Technology, 2018 to 2022

Table 32. North America Market Volume (Units) and Forecast By Mechanism / Technology, 2023 to 2033

Table 33. North America Market Value (US$ million) and Forecast By Capacity (Kg/h), 2018 to 2022

Table 34. North America Market Value (US$ million) and Forecast By Capacity (Kg/h), 2023 to 2033

Table 35. North America Market Volume (Units) and Forecast By Capacity (Kg/h), 2018 to 2022

Table 36. North America Market Volume (Units) and Forecast By Capacity (Kg/h), 2023 to 2033

Table 37. North America Market Value (US$ million) and Forecast By Fish Type, 2018 to 2022

Table 38. North America Market Value (US$ million) and Forecast By Fish Type, 2023 to 2033

Table 39. North America Market Volume (Units) and Forecast By Fish Type, 2018 to 2022

Table 40. North America Market Volume (Units) and Forecast By Fish Type, 2023 to 2033

Table 41. North America Market Value (US$ million) and Forecast By End User, 2018 to 2022

Table 42. North America Market Value (US$ million) and Forecast By End User, 2023 to 2033

Table 43. North America Market Volume (Units) and Forecast By End User, 2018 to 2022

Table 44. North America Market Volume (Units) and Forecast By End User, 2023 to 2033

Table 45. North America Market Value (US$ million) and Forecast By Sales Channel, 2018 to 2022

Table 46. North America Market Value (US$ million) and Forecast By Sales Channel, 2023 to 2033

Table 47. North America Market Volume (Units) and Forecast By Sales Channel, 2018 to 2022

Table 48. North America Market Volume (Units) and Forecast By Sales Channel, 2023 to 2033

Table 49. Latin America Market Value (US$ million) and Forecast by Country, 2018 to 2022

Table 50. Latin America Market Value (US$ million) and Forecast by Country, 2023 to 2033

Table 51. Latin America Market Volume (Units) and Forecast by Country, 2018 to 2022

Table 52. Latin America Market Volume (Units) and Forecast by Country, 2023 to 2033

Table 53. Latin America Market Value (US$ million) and Forecast By Mechanism / Technology, 2018 to 2022

Table 54. Latin America Market Value (US$ million) and Forecast By Mechanism / Technology, 2023 to 2033

Table 55. Latin America Market Volume (Units) and Forecast By Mechanism / Technology, 2018 to 2022

Table 56. Latin America Market Volume (Units) and Forecast By Mechanism / Technology, 2023 to 2033

Table 57. Latin America Market Value (US$ million) and Forecast By Capacity (Kg/h), 2018 to 2022

Table 58. Latin America Market Value (US$ million) and Forecast By Capacity (Kg/h), 2023 to 2033

Table 59. Latin America Market Volume (Units) and Forecast By Capacity (Kg/h), 2018 to 2022

Table 60. Latin America Market Volume (Units) and Forecast By Capacity (Kg/h), 2023 to 2033

Table 61. Latin America Market Value (US$ million) and Forecast By Fish Type, 2018 to 2022

Table 62. Latin America Market Value (US$ million) and Forecast By Fish Type, 2023 to 2033

Table 63. Latin America Market Volume (Units) and Forecast By Fish Type, 2018 to 2022

Table 64. Latin America Market Volume (Units) and Forecast By Fish Type, 2023 to 2033

Table 65. Latin America Market Value (US$ million) and Forecast By End User, 2018 to 2022

Table 66. Latin America Market Value (US$ million) and Forecast By End User, 2023 to 2033

Table 67. Latin America Market Volume (Units) and Forecast By End User, 2018 to 2022

Table 68. Latin America Market Volume (Units) and Forecast By End User, 2023 to 2033

Table 69. Latin America Market Value (US$ million) and Forecast By Sales Channel, 2018 to 2022

Table 70. Latin America Market Value (US$ million) and Forecast By Sales Channel, 2023 to 2033

Table 71. Latin America Market Volume (Units) and Forecast By Sales Channel, 2018 to 2022

Table 72. Latin America Market Volume (Units) and Forecast By Sales Channel, 2023 to 2033

Table 73. Europe Market Value (US$ million) and Forecast by Country, 2018 to 2022

Table 74. Europe Market Value (US$ million) and Forecast by Country, 2023 to 2033

Table 75. Europe Market Volume (Units) and Forecast by Country, 2018 to 2022

Table 76. Europe Market Volume (Units) and Forecast by Country, 2023 to 2033

Table 77. Europe Market Value (US$ million) and Forecast By Mechanism / Technology, 2018 to 2022

Table 78. Europe Market Value (US$ million) and Forecast By Mechanism / Technology, 2023 to 2033

Table 79. Europe Market Volume (Units) and Forecast By Mechanism / Technology, 2018 to 2022

Table 80. Europe Market Volume (Units) and Forecast By Mechanism / Technology, 2023 to 2033

Table 81. Europe Market Value (US$ million) and Forecast By Capacity (Kg/h), 2018 to 2022

Table 82. Europe Market Value (US$ million) and Forecast By Capacity (Kg/h), 2023 to 2033

Table 83. Europe Market Volume (Units) and Forecast By Capacity (Kg/h), 2018 to 2022

Table 84. Europe Market Volume (Units) and Forecast By Capacity (Kg/h), 2023 to 2033

Table 85. Europe Market Value (US$ million) and Forecast By Fish Type, 2018 to 2022

Table 86. Europe Market Value (US$ million) and Forecast By Fish Type, 2023 to 2033

Table 87. Europe Market Volume (Units) and Forecast By Fish Type, 2018 to 2022

Table 88. Europe Market Volume (Units) and Forecast By Fish Type, 2023 to 2033

Table 89. Europe Market Value (US$ million) and Forecast By End User, 2018 to 2022

Table 90. Europe Market Value (US$ million) and Forecast By End User, 2023 to 2033

Table 91. Europe Market Volume (Units) and Forecast By End User, 2018 to 2022

Table 92. Europe Market Volume (Units) and Forecast By End User, 2023 to 2033

Table 93. Europe Market Value (US$ million) and Forecast By Sales Channel, 2018 to 2022

Table 94. Europe Market Value (US$ million) and Forecast By Sales Channel, 2023 to 2033

Table 95. Europe Market Volume (Units) and Forecast By Sales Channel, 2018 to 2022

Table 96. Europe Market Volume (Units) and Forecast By Sales Channel, 2023 to 2033

Table 97. East Asia Market Value (US$ million) and Forecast by Country, 2018 to 2022

Table 98. East Asia Market Value (US$ million) and Forecast by Country, 2023 to 2033

Table 99. East Asia Market Volume (Units) and Forecast by Country, 2018 to 2022

Table 100. East Asia Market Volume (Units) and Forecast by Country, 2023 to 2033

Table 101. East Asia Market Value (US$ million) and Forecast By Mechanism / Technology, 2018 to 2022

Table 102. East Asia Market Value (US$ million) and Forecast By Mechanism / Technology, 2023 to 2033

Table 103. East Asia Market Volume (Units) and Forecast By Mechanism / Technology, 2018 to 2022

Table 104. East Asia Market Volume (Units) and Forecast By Mechanism / Technology, 2023 to 2033

Table 105. East Asia Market Value (US$ million) and Forecast By Capacity (Kg/h), 2018 to 2022

Table 106. East Asia Market Value (US$ million) and Forecast By Capacity (Kg/h), 2023 to 2033

Table 107. East Asia Market Volume (Units) and Forecast By Capacity (Kg/h), 2018 to 2022

Table 108. East Asia Market Volume (Units) and Forecast By Capacity (Kg/h), 2023 to 2033

Table 109. East Asia Market Value (US$ million) and Forecast By Fish Type, 2018 to 2022

Table 110. East Asia Market Value (US$ million) and Forecast By Fish Type, 2023 to 2033

Table 111. East Asia Market Volume (Units) and Forecast By Fish Type, 2018 to 2022

Table 112. East Asia Market Volume (Units) and Forecast By Fish Type, 2023 to 2033

Table 113. East Asia Market Value (US$ million) and Forecast By End User, 2018 to 2022

Table 114. East Asia Market Value (US$ million) and Forecast By End User, 2023 to 2033

Table 115. East Asia Market Volume (Units) and Forecast By End User, 2018 to 2022

Table 116. East Asia Market Volume (Units) and Forecast By End User, 2023 to 2033

Table 117. East Asia Market Value (US$ million) and Forecast By Sales Channel, 2018 to 2022

Table 118. East Asia Market Value (US$ million) and Forecast By Sales Channel, 2023 to 2033

Table 119. East Asia Market Volume (Units) and Forecast By Sales Channel, 2018 to 2022

Table 120. East Asia Market Volume (Units) and Forecast By Sales Channel, 2023 to 2033

Table 121. South Asia & Oceania Market Value (US$ million) and Forecast by Country, 2018 to 2022

Table 122. South Asia & Oceania Market Value (US$ million) and Forecast by Country, 2023 to 2033

Table 123. South Asia & Oceania Market Volume (Units) and Forecast by Country, 2018 to 2022

Table 124. South Asia & Oceania Market Volume (Units) and Forecast by Country, 2023 to 2033

Table 125. South Asia & Oceania Market Value (US$ million) and Forecast By Mechanism / Technology, 2018 to 2022

Table 126. South Asia & Oceania Market Value (US$ million) and Forecast By Mechanism / Technology, 2023 to 2033

Table 127. South Asia & Oceania Market Volume (Units) and Forecast By Mechanism / Technology, 2018 to 2022

Table 128. South Asia & Oceania Market Volume (Units) and Forecast By Mechanism / Technology, 2023 to 2033

Table 129. South Asia & Oceania Market Value (US$ million) and Forecast By Capacity (Kg/h), 2018 to 2022

Table 130. South Asia & Oceania Market Value (US$ million) and Forecast By Capacity (Kg/h), 2023 to 2033

Table 131. South Asia & Oceania Market Volume (Units) and Forecast By Capacity (Kg/h), 2018 to 2022

Table 132. South Asia & Oceania Market Volume (Units) and Forecast By Capacity (Kg/h), 2023 to 2033

Table 133. South Asia & Oceania Market Value (US$ million) and Forecast By Fish Type, 2018 to 2022

Table 134. South Asia & Oceania Market Value (US$ million) and Forecast By Fish Type, 2023 to 2033

Table 135. South Asia & Oceania Market Volume (Units) and Forecast By Fish Type, 2018 to 2022

Table 136. South Asia & Oceania Market Volume (Units) and Forecast By Fish Type, 2023 to 2033

Table 137. South Asia & Oceania Market Value (US$ million) and Forecast By End User, 2018 to 2022

Table 138. South Asia & Oceania Market Value (US$ million) and Forecast By End User, 2023 to 2033

Table 139. South Asia & Oceania Market Volume (Units) and Forecast By End User, 2018 to 2022

Table 140. South Asia & Oceania Market Volume (Units) and Forecast By End User, 2023 to 2033

Table 141. South Asia & Oceania Market Value (US$ million) and Forecast By Sales Channel, 2018 to 2022

Table 142. South Asia & Oceania Market Value (US$ million) and Forecast By Sales Channel, 2023 to 2033

Table 143. South Asia & Oceania Market Volume (Units) and Forecast By Sales Channel, 2018 to 2022

Table 144. South Asia & Oceania Market Volume (Units) and Forecast By Sales Channel, 2023 to 2033

Table 145. MEA Market Value (US$ million) and Forecast by Country, 2018 to 2022

Table 146. MEA Market Value (US$ million) and Forecast by Country, 2023 to 2033

Table 147. MEA Market Volume (Units) and Forecast by Country, 2018 to 2022

Table 148. MEA Market Volume (Units) and Forecast by Country, 2023 to 2033

Table 149. MEA Market Value (US$ million) and Forecast By Mechanism / Technology, 2018 to 2022

Table 150. MEA Market Value (US$ million) and Forecast By Mechanism / Technology, 2023 to 2033

Table 151. MEA Market Volume (Units) and Forecast By Mechanism / Technology, 2018 to 2022

Table 152. MEA Market Volume (Units) and Forecast By Mechanism / Technology, 2023 to 2033

Table 153. MEA Market Value (US$ million) and Forecast By Capacity (Kg/h), 2018 to 2022

Table 154. MEA Market Value (US$ million) and Forecast By Capacity (Kg/h), 2023 to 2033

Table 155. MEA Market Volume (Units) and Forecast By Capacity (Kg/h), 2018 to 2022

Table 156. MEA Market Volume (Units) and Forecast By Capacity (Kg/h), 2023 to 2033

Table 157. MEA Market Value (US$ million) and Forecast By Fish Type, 2018 to 2022

Table 158. MEA Market Value (US$ million) and Forecast By Fish Type, 2023 to 2033

Table 159. MEA Market Volume (Units) and Forecast By Fish Type, 2018 to 2022

Table 160. MEA Market Volume (Units) and Forecast By Fish Type, 2023 to 2033

Table 161. MEA Market Value (US$ million) and Forecast By End User, 2018 to 2022

Table 162. MEA Market Value (US$ million) and Forecast By End User, 2023 to 2033

Table 163. MEA Market Volume (Units) and Forecast By End User, 2018 to 2022

Table 164. MEA Market Volume (Units) and Forecast By End User, 2023 to 2033

Table 165. MEA Market Value (US$ million) and Forecast By Sales Channel, 2018 to 2022

Table 166. MEA Market Value (US$ million) and Forecast By Sales Channel, 2023 to 2033

Table 167. MEA Market Volume (Units) and Forecast By Sales Channel, 2018 to 2022

Table 168. MEA Market Volume (Units) and Forecast By Sales Channel, 2023 to 2033

List of Charts

Figure 1. Global Market Value (US$ million) and Volume (Units) Forecast, 2023 to 2033

Figure 2. Global Market Absolute $ Opportunity (US$ million), 2023 to 2033

Figure 3. Global Market Value (US$ million) and Volume (Units) by Region, 2023 to 2033

Figure 4. Global Market Y-o-Y Growth Rate by Region, 2023 to 2033

Figure 5. Global Market Value (US$ million) and Volume (Units) By Mechanism / Technology, 2023 to 2033

Figure 6. Global Market Y-o-Y Growth Rate By Mechanism / Technology, 2023 to 2033

Figure 7. Global Market Value (US$ million) and Volume (Units) By Capacity (Kg/h), 2023 to 2033

Figure 8. Global Market Y-o-Y Growth Rate By Capacity (Kg/h), 2023 to 2033

Figure 9. Global Market Value (US$ million) and Volume (Units) By Fish Type, 2023 to 2033

Figure 10. Global Market Y-o-Y Growth Rate By Fish Type, 2023 to 2033

Figure 11. Global Market Value (US$ million) and Volume (Units) By End User, 2023 to 2033

Figure 12. Global Market Y-o-Y Growth Rate By End User, 2023 to 2033

Figure 13. Global Market Value (US$ million) and Volume (Units) By Sales Channel, 2023 to 2033

Figure 14. Global Market Y-o-Y Growth Rate By Sales Channel, 2023 to 2033

Figure 15. North America Market Value (US$ million) and Volume (Units) Forecast, 2023 to 2033

Figure 16. North America Market Absolute $ Opportunity (US$ million), 2023 to 2033

Figure 17. North America Market Value (US$ million) and Volume (Units) by Country, 2023 to 2033

Figure 18. North America Market Y-o-Y Growth Rate by Country, 2023 to 2033

Figure 19. North America Market Value (US$ million) and Volume (Units) By Mechanism / Technology, 2023 to 2033

Figure 20. North America Market Y-o-Y Growth Rate By Mechanism / Technology, 2023 to 2033

Figure 21. North America Market Value (US$ million) and Volume (Units) By Capacity (Kg/h), 2023 to 2033

Figure 22. North America Market Y-o-Y Growth Rate By Capacity (Kg/h), 2023 to 2033

Figure 23. North America Market Value (US$ million) and Volume (Units) By Fish Type, 2023 to 2033

Figure 24. North America Market Y-o-Y Growth Rate By Fish Type, 2023 to 2033

Figure 25. North America Market Value (US$ million) and Volume (Units) By End User, 2023 to 2033

Figure 26. North America Market Y-o-Y Growth Rate By End User, 2023 to 2033

Figure 27. North America Market Value (US$ million) and Volume (Units) By Sales Channel, 2023 to 2033

Figure 28. North America Market Y-o-Y Growth Rate By Sales Channel, 2023 to 2033

Figure 29. North America Market Attractiveness Analysis by Country, 2023 to 2033

Figure 30. North America Market Attractiveness Analysis By Mechanism / Technology, 2023 to 2033

Figure 31. North America Market Attractiveness Analysis By Capacity (Kg/h), 2023 to 2033

Figure 32. North America Market Attractiveness Analysis By Fish Type, 2023 to 2033

Figure 33. North America Market Attractiveness Analysis By End User, 2023 to 2033

Figure 34. North America Market Attractiveness Analysis By Sales Channel, 2023 to 2033

Figure 35. Latin America Market Value (US$ million) and Volume (Units) Forecast, 2023 to 2033

Figure 36. Latin America Market Absolute $ Opportunity (US$ million), 2023 to 2033

Figure 37. Latin America Market Value (US$ million) and Volume (Units) by Country, 2023 to 2033

Figure 38. Latin America Market Y-o-Y Growth Rate by Country, 2023 to 2033

Figure 39. Latin America Market Value (US$ million) and Volume (Units) By Mechanism / Technology, 2023 to 2033

Figure 40. Latin America Market Y-o-Y Growth Rate By Mechanism / Technology, 2023 to 2033

Figure 41. Latin America Market Value (US$ million) and Volume (Units) By Capacity (Kg/h), 2023 to 2033

Figure 42. Latin America Market Y-o-Y Growth Rate By Capacity (Kg/h), 2023 to 2033

Figure 43. Latin America Market Value (US$ million) and Volume (Units) By Fish Type, 2023 to 2033

Figure 44. Latin America Market Y-o-Y Growth Rate By Fish Type, 2023 to 2033

Figure 45. Latin America Market Value (US$ million) and Volume (Units) By End User, 2023 to 2033

Figure 46. Latin America Market Y-o-Y Growth Rate By End User, 2023 to 2033

Figure 47. Latin America Market Value (US$ million) and Volume (Units) By Sales Channel, 2023 to 2033

Figure 48. Latin America Market Y-o-Y Growth Rate By Sales Channel, 2023 to 2033

Figure 49. Latin America Market Attractiveness Analysis by Country, 2023 to 2033

Figure 50. Latin America Market Attractiveness Analysis By Mechanism / Technology, 2023 to 2033

Figure 51. Latin America Market Attractiveness Analysis By Capacity (Kg/h), 2023 to 2033

Figure 52. Latin America Market Attractiveness Analysis By Fish Type, 2023 to 2033

Figure 53. Latin America Market Attractiveness Analysis By End User, 2023 to 2033

Figure 54. Latin America Market Attractiveness Analysis By Sales Channel, 2023 to 2033

Figure 55. Europe Market Value (US$ million) and Volume (Units) Forecast, 2023 to 2033

Figure 56. Europe Market Absolute $ Opportunity (US$ million), 2023 to 2033

Figure 57. Europe Market Value (US$ million) and Volume (Units) by Country, 2023 to 2033

Figure 58. Europe Market Y-o-Y Growth Rate by Country, 2023 to 2033

Figure 59. Europe Market Value (US$ million) and Volume (Units) By Mechanism / Technology, 2023 to 2033

Figure 60. Europe Market Y-o-Y Growth Rate By Mechanism / Technology, 2023 to 2033

Figure 61. Europe Market Value (US$ million) and Volume (Units) By Capacity (Kg/h), 2023 to 2033

Figure 62. Europe Market Y-o-Y Growth Rate By Capacity (Kg/h), 2023 to 2033

Figure 63. Europe Market Value (US$ million) and Volume (Units) By Fish Type, 2023 to 2033

Figure 64. Europe Market Y-o-Y Growth Rate By Fish Type, 2023 to 2033

Figure 65. Europe Market Value (US$ million) and Volume (Units) By End User, 2023 to 2033

Figure 66. Europe Market Y-o-Y Growth Rate By End User, 2023 to 2033

Figure 67. Europe Market Value (US$ million) and Volume (Units) By Sales Channel, 2023 to 2033

Figure 68. Europe Market Y-o-Y Growth Rate By Sales Channel, 2023 to 2033

Figure 69. Europe Market Attractiveness Analysis by Country, 2023 to 2033

Figure 70. Europe Market Attractiveness Analysis By Mechanism / Technology, 2023 to 2033

Figure 71. Europe Market Attractiveness Analysis By Capacity (Kg/h), 2023 to 2033

Figure 72. Europe Market Attractiveness Analysis By Fish Type, 2023 to 2033

Figure 73. Europe Market Attractiveness Analysis By End User, 2023 to 2033

Figure 74. Europe Market Attractiveness Analysis By Sales Channel, 2023 to 2033

Figure 75. East Asia Market Value (US$ million) and Volume (Units) Forecast, 2023 to 2033

Figure 76. East Asia Market Absolute $ Opportunity (US$ million), 2023 to 2033

Figure 77. East Asia Market Value (US$ million) and Volume (Units) by Country, 2023 to 2033

Figure 78. East Asia Market Y-o-Y Growth Rate by Country, 2023 to 2033

Figure 79. East Asia Market Value (US$ million) and Volume (Units) By Mechanism / Technology, 2023 to 2033

Figure 80. East Asia Market Y-o-Y Growth Rate By Mechanism / Technology, 2023 to 2033

Figure 81. East Asia Market Value (US$ million) and Volume (Units) By Capacity (Kg/h), 2023 to 2033

Figure 82. East Asia Market Y-o-Y Growth Rate By Capacity (Kg/h), 2023 to 2033

Figure 83. East Asia Market Value (US$ million) and Volume (Units) By Fish Type, 2023 to 2033

Figure 84. East Asia Market Y-o-Y Growth Rate By Fish Type, 2023 to 2033

Figure 85. East Asia Market Value (US$ million) and Volume (Units) By End User, 2023 to 2033

Figure 86. East Asia Market Y-o-Y Growth Rate By End User, 2023 to 2033

Figure 87. East Asia Market Value (US$ million) and Volume (Units) By Sales Channel, 2023 to 2033

Figure 88. East Asia Market Y-o-Y Growth Rate By Sales Channel, 2023 to 2033

Figure 89. East Asia Market Attractiveness Analysis by Country, 2023 to 2033

Figure 90. East Asia Market Attractiveness Analysis By Mechanism / Technology, 2023 to 2033

Figure 91. East Asia Market Attractiveness Analysis By Capacity (Kg/h), 2023 to 2033

Figure 92. East Asia Market Attractiveness Analysis By Fish Type, 2023 to 2033

Figure 93. East Asia Market Attractiveness Analysis By End User, 2023 to 2033

Figure 94. East Asia Market Attractiveness Analysis By Sales Channel, 2023 to 2033

Figure 95. South Asia & Oceania Market Value (US$ million) and Volume (Units) Forecast, 2023 to 2033

Figure 96. South Asia & Oceania Market Absolute $ Opportunity (US$ million), 2023 to 2033

Figure 97. South Asia & Oceania Market Value (US$ million) and Volume (Units) by Country, 2023 to 2033

Figure 98. South Asia & Oceania Market Y-o-Y Growth Rate by Country, 2023 to 2033

Figure 99. South Asia & Oceania Market Value (US$ million) and Volume (Units) By Mechanism / Technology, 2023 to 2033

Figure 100. South Asia & Oceania Market Y-o-Y Growth Rate By Mechanism / Technology, 2023 to 2033

Figure 101. South Asia & Oceania Market Value (US$ million) and Volume (Units) By Capacity (Kg/h), 2023 to 2033

Figure 102. South Asia & Oceania Market Y-o-Y Growth Rate By Capacity (Kg/h), 2023 to 2033

Figure 103. South Asia & Oceania Market Value (US$ million) and Volume (Units) By Fish Type, 2023 to 2033

Figure 104. South Asia & Oceania Market Y-o-Y Growth Rate By Fish Type, 2023 to 2033

Figure 105. South Asia & Oceania Market Value (US$ million) and Volume (Units) By End User, 2023 to 2033

Figure 106. South Asia & Oceania Market Y-o-Y Growth Rate By End User, 2023 to 2033

Figure 107. South Asia & Oceania Market Value (US$ million) and Volume (Units) By Sales Channel, 2023 to 2033

Figure 108. South Asia & Oceania Market Y-o-Y Growth Rate By Sales Channel, 2023 to 2033

Figure 109. South Asia & Oceania Market Attractiveness Analysis by Country, 2023 to 2033

Figure 110. South Asia & Oceania Market Attractiveness Analysis By Mechanism / Technology, 2023 to 2033

Figure 111. South Asia & Oceania Market Attractiveness Analysis By Capacity (Kg/h), 2023 to 2033

Figure 112. South Asia & Oceania Market Attractiveness Analysis By Fish Type, 2023 to 2033

Figure 113. South Asia & Oceania Market Attractiveness Analysis By End User, 2023 to 2033

Figure 114. South Asia & Oceania Market Attractiveness Analysis By Sales Channel, 2023 to 2033

Figure 115. MEA Market Value (US$ million) and Volume (Units) Forecast, 2023 to 2033

Figure 116. MEA Market Absolute $ Opportunity (US$ million), 2023 to 2033

Figure 117. MEA Market Value (US$ million) and Volume (Units) by Country, 2023 to 2033

Figure 118. MEA Market Y-o-Y Growth Rate by Country, 2023 to 2033

Figure 119. MEA Market Value (US$ million) and Volume (Units) By Mechanism / Technology, 2023 to 2033

Figure 120. MEA Market Y-o-Y Growth Rate By Mechanism / Technology, 2023 to 2033

Figure 121. MEA Market Value (US$ million) and Volume (Units) By Capacity (Kg/h), 2023 to 2033

Figure 122. MEA Market Y-o-Y Growth Rate By Capacity (Kg/h), 2023 to 2033

Figure 123. MEA Market Value (US$ million) and Volume (Units) By Fish Type, 2023 to 2033

Figure 124. MEA Market Y-o-Y Growth Rate By Fish Type, 2023 to 2033

Figure 125. MEA Market Value (US$ million) and Volume (Units) By End User, 2023 to 2033

Figure 126. MEA Market Y-o-Y Growth Rate By End User, 2023 to 2033

Figure 127. MEA Market Value (US$ million) and Volume (Units) By Sales Channel, 2023 to 2033

Figure 128. MEA Market Y-o-Y Growth Rate By Sales Channel, 2023 to 2033

Figure 129. MEA Market Attractiveness Analysis by Country, 2023 to 2033

Figure 130. MEA Market Attractiveness Analysis By Mechanism / Technology, 2023 to 2033

Figure 131. MEA Market Attractiveness Analysis By Capacity (Kg/h), 2023 to 2033

Figure 132. MEA Market Attractiveness Analysis By Fish Type, 2023 to 2033

Figure 133. MEA Market Attractiveness Analysis By End User, 2023 to 2033

Figure 134. MEA Market Attractiveness Analysis By Sales Channel, 2023 to 2033

Explore Process Automation Insights

View Reports

Fish Cutting Machine Market