Fish Meal Alternative Market Outlook (2023 to 2033)

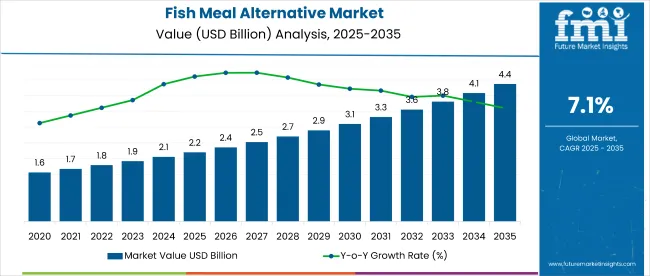
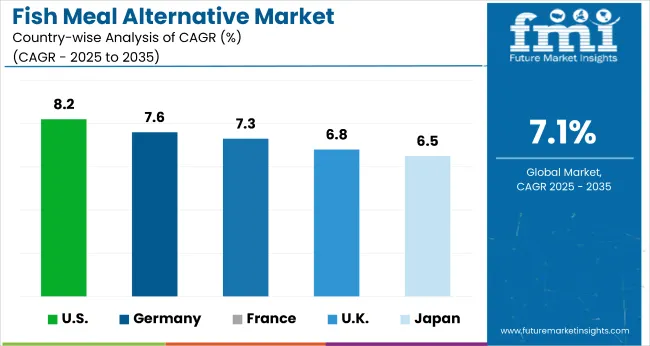
The global fish meal alternative market size reached a valuation of US$ 1,924.2 million in 2023. The expanding nutritional value and wide ranges of applications are projected to be the market's primary growth drivers. The overall sales of fish meal alternative products are projected to grow at a robust CAGR of 7.1% between 2023 and 2033, totaling around US$ 3,674.0 million by the end of 2033.

Attribute Details
Fish Meal Alternative Market Size (2023) US$ 1,924.2 million
Fish Meal Alternative Market Revenue Forecast (2033) US$ 3,674.0 million
Fish Meal Alternative Market Growth Rate (2023 to 2033) 7.1% CAGR
North America Market Share 30.1%

Fish meal alternative solutions are more sustainable and environmentally friendly than traditional fish meals, which are made from small marine fish, cultured fish, and processed fish by-products. The bulk of fish meal alternatives are derived from plant sources, with a smaller proportion derived from non-plant sources such as met industry waste or by-products and microorganisms.

The global preference for sustainable and cost-effective farming is predicted to propel the fish meal alternative industry to an elevated CAGR throughout the forecast period. The Asia Pacific region is expected to dominate the fish meal alternative market since it is the major consumer of all kinds of feeds and preservatives.

Don't pay for what you don't need

Customize your report by selecting specific countries or regions and save 30%!

Which Factors are Driving the Growth of the Fish Meal Alternative Market?

Demands for ethical and substantial food are expected to dominate the fish meal alternative market. With the soaring cost of raw materials required for fish meal production and constricted industrial capacity, manufacturers are looking for alternatives to meet the rising demand for fish meals. Global protein demand is increasing in tandem with population growth, necessitating the use of alternative protein sources; thus, fish meal alternative products are ideal for addressing the mounting concern of food scarcity while also lowering carbon footprint.

The burgeoning population's demand for organic poultry products is stimulating the expansion of the fishmeal substitute market. Plant-based ingredients are regarded as a preferred alternative to fishmeal because they are filled with protein and omega-3 fatty acids and have a high digestibility. Soy products influence the fishmeal substitute market.

Which Factors are Restraining the Growth of the Fish Meal Alternative Market?

Over the forthcoming years, the global fish meal market is anticipated to be restrained by competitive pricing and a lack of awareness.

Nandini Roy Choudhury

Principal Consultant

Talk to Analyst

Find your sweet spots for generating winning opportunities in this market.

Which Factors Pushing the Fish Meal Alternative Devices in Asia Pacific?

The Asia Pacific region accounts for roughly 90% of global aquaculture products, escalating demand for alternative fishmeal feed ingredients. China is the biggest producer of fishmeal, accounting for approximately 30.1% of global supply, as well as the largest importer. Fish meal is primarily used in the aquaculture industry, which is governed by the Asia Pacific region, which is expected to dominate the global fish meal substitute market.

The Asia-Pacific region is predicted to monopolize the Soy Fortified Products market, due to increasing demand for protein-rich foods, notably in emerging economies such as India and China, which is likely to propel the fish meal alternative market.

How Will Growth Unfold in the North America Fish Meal Alternative Market?

North America is expected to capture a significant value share, with Latin America coming in second due to its large agricultural and aquaculture industries. North America is followed by Latin America in terms of value share for the Soy Fortified Products market, with APAC driving the fish meal alternative market.

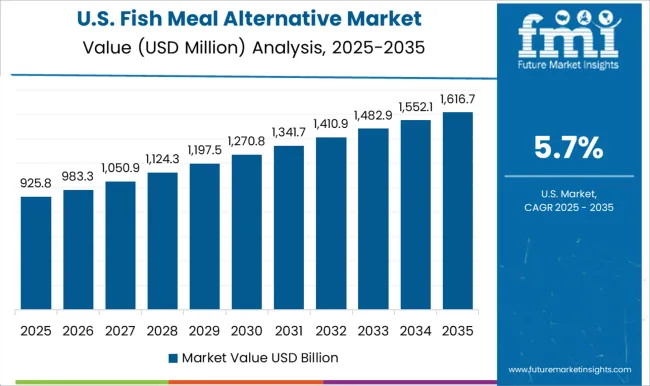
Furthermore, environmental groups, associations, and government agencies across North America have emphasized the importance of lessening the utilization of fishmeal as feed, notably for seafood aquaculture. Consequently, the popularity of aquaponics seafood will outpace fish meal production, and fish meal alternatives are likely to emerge as viable feed formulas in North America. North America accounts for a market share of 26% of the global fish meal alternative market.

Get the data you need at a Fraction of the cost

Personalize your report by choosing insights you need
and save 40%!

How Will Growth Unfold in the European Fish Meal Alternative Market?

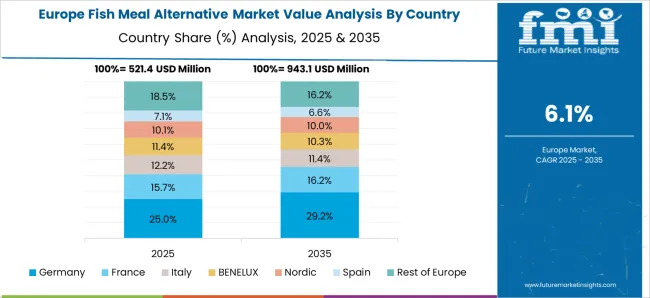
The Europe region is expected to take the lead in terms of market share due to its substantial meat and dairy industries, as well as a rapid increase in sustainable farming in the region to meet strict EU guidelines. Europe is experiencing a protein shortfall for animal feed, which will influence the plant-based protein market.

Europe is forecast to witness robust growth in the overall soybean meal market owing to an increase in product demand among purchasers because of reduced costs and high nutrient levels in countries such as the United Kingdom and Germany. As a result, these factors are predicted to spur market growth. Europe accounts for 30.1% of the global market for fish meal alternatives.

Category-wise Analysis

Which Segments Dominate the Global Fish Meal Alternative Market?

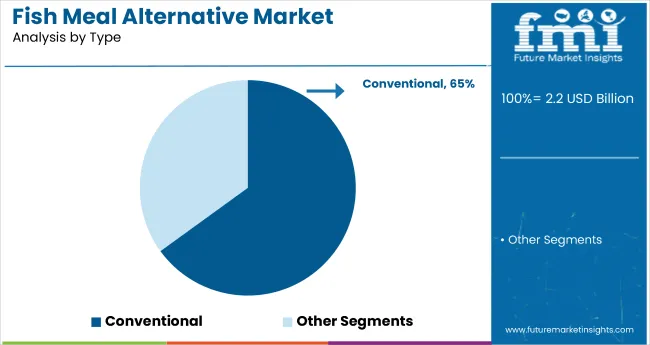
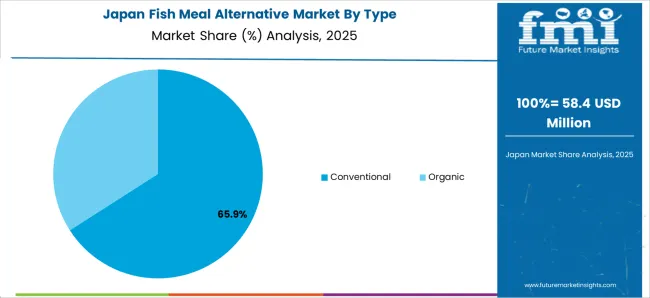
The organic market is anticipated to expand at a faster pace than the conventional segment due to its more sustainable production process. Because of its lower cost and ease of production, the conventional segment is likely to dominate the global fish meal alternative market in terms of volume share.

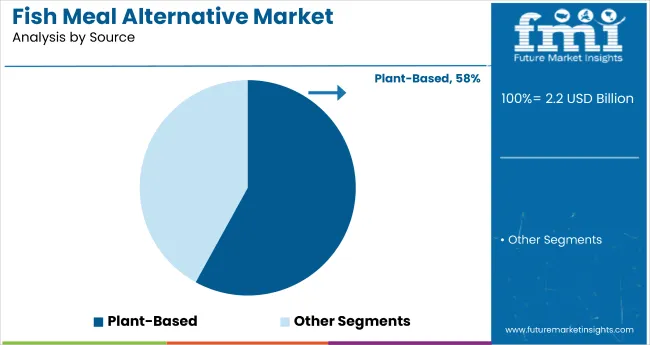
Because of its simplicity of production and lower price point in comparison to traditional fish meals, the plant segment is set to dominate the global fish meal alternative market. Furthermore, plant-based fish meal alternatives have been scientifically demonstrated to produce more than traditional fish meal alternatives, which is expected to prompt producers to shift toward them over the forecast period.

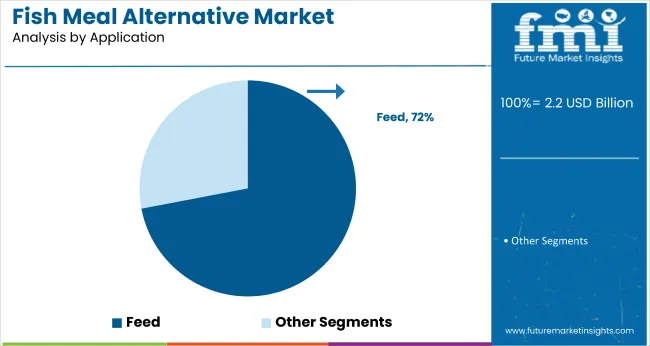
Aquaculture, poultry, livestock, and pet food and continues to treat are all sub-segments of the feed segment. Because of the large intensity of consumption from the aquaculture and poultry industries, the feed segment is anticipated to dominate the global fish alternative market over the forecast period.

The Start-Up Ecosystem: How key Players are opening Frontiers for Future Growth?

Manufacturers are adopting various marketing strategies such as new product launches, geographical expansion, mergers and acquisitions, partnerships, and collaboration to identify the interest of potential buyers and create a larger customer base. For instance,

  • Benson Hill, founded in 2012, is a provider of crop design platforms to develop healthier and more sustainable food and ingredients. Benson Hill announced the launch of TruVailTM in February 2022, a new line of domestically sourced, non-GMO plant-based protein ingredients with exceptional sustainability benefits that can be used as a fish meal substitute.
  • Good Catch, founded in 2016, is a developer of vegan and plant-based seafood substitutes. It recently introduced Good Catch Plant-Based Breaded Fish Fillets, which have a real seafood flavor and a flaky whitefish texture and are GMO-free and a good source of plant-based protein.

Who are the Leading Players in Fish Meal Alternative Market?

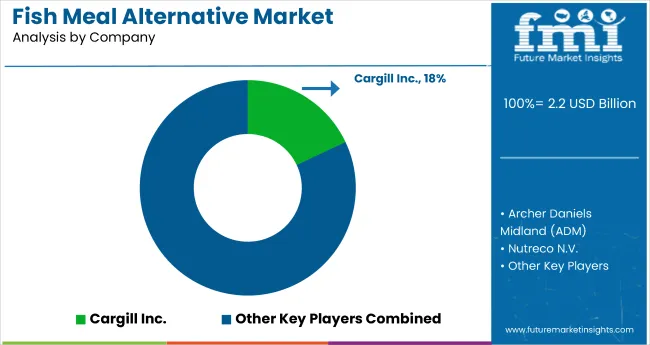
Some of the leading fish meal alternative device manufacturers include Al Dahra ACX, Archer Daniels Midland, Angel Yeast Co. Ltd, Cargill Inc., Calysta, Inc., Lallemand Inc., Nutreco N.V, and Alltech.

These key fish meal alternative providers are adopting various strategies such as new product launches and approvals, partnerships, collaborations, acquisitions, mergers, etc. to increase their sales and gain a competitive edge in the global fish meal alternative market. For instance,

  • Archer-Daniels-Midland Company ADM announced expansion plans in April 2022 to meet the growing demand for alternative proteins. ADM intends to invest approximately $300 million to expand its alternative protein production in Decatur, Illinois.
  • Cargill announced in March 2022 that it will attempt to incorporate algal oil into all feed delivered to the Norwegian market. Algae oil is one of the few alternative ingredients for aquaculture that can replace fishmeal and oil without sacrificing omega-3 levels.
  • In June 2023, Angel Yeast signed a partnership agreement with PhaBuilder to widen the scope of synthetic biology.
  • 2023 Alltech Agri-food Outlook released by Alltech highlighted the global feed production data. It states that despite the challenges faced in 2022, production remained steady in 2022 and feed production in several regions, including Latin America, North America and Oceania increased.

Report of Scope

Attribute Details
Projected Market Size (2033) US$ 3,674.0 million
Estimated Growth Rate (2023 to 2033) 7.1%
Forecast Period 2023 to 2033
Historic Data Available for 2018 to 2022
Market Analysis US$ million for Value
Report Coverage Market forecast, company share analysis, competition intelligence, DROT analysis, market dynamics and challenges, and strategic growth initiatives
Key Segments Covered
  • Type
  • Source
  • Application
  • Region
Key regions covered
  • North America
    • United States
    • Canada
    • Rest of North America
  • Latin America
    • Brazil
    • Argentina
    • Mexico
    • Rest of Latin America
  • Western Europe
    • Germany
    • United Kingdom
    • France
    • Rest of Western Europe
  • Eastern Europe
    • Russia
    • Spain
    • Rest of Eastern Europe
  • South Asia Pacific
    • China
    • India
    • Japan
    • Malaysia
    • Thailand
    • Indonesia
    • South Korea
    • Rest of South Asia & Pacific
  • Middle East & Africa GCC Countries
    • Turkey
    • Israel
    • Rest of MEA
  • Rest of the World
    • Oceania
    • Africa
    • South America
Key companies profiled Al Dahra ACX, Archer Daniels Midland, Angel Yeast Co. Ltd, Cargill Inc., Calysta, Inc., Lallemand Inc., Nutreco N.V and Alltech
Customization & pricing Available upon request

Key Segments of Fish Meal Alternative Industry Survey

Type:

  • Organic
  • Conventional

Source:

  • Plant
  • Peas
  • Lupins
  • Corn
  • Rice
  • Canola
  • Rapeseed
  • Barley
  • Wheat
  • Animal
  • Micro-organism

By Application:

  • Feed
  • poultry
  • livestock
  • pet food
  • Treats
  • Fertilizers
  • Pharmaceuticals
  • Dietary

By Region:

  • North America
  • Latin America
  • Europe
  • East Asia

Frequently Asked Questions

What is the Projected Size of the Market by 2033?

The global market size to reach US$ 1,924.2 million by 2033.

Top Key Players in the Fish Meal Alternative Market?

Angel Yeast and Cargill are the top key players.

What is the Growth Potential of the Fish Meal Alternative Market?

The growth potential of the global market is 7.1% through 2033

What Limits the Growth Potential of the Market?

The adoption of alternative products are likely to limit market growth.

Which Type is Highly Preferred?

The organic segment is highly preferred in the global market.

Table of Content
1. Executive Summary

    1.1. Global Market Outlook

    1.2. Demand-side Trends

    1.3. Supply-side Trends

    1.4. Technology Roadmap Analysis

    1.5. Analysis and Recommendations

2. Market Overview

    2.1. Market Coverage / Taxonomy

    2.2. Market Definition / Scope / Limitations

3. Market Background

    3.1. Market Dynamics

        3.1.1. Drivers

        3.1.2. Restraints

        3.1.3. Opportunity

        3.1.4. Trends

    3.2. Scenario Forecast

        3.2.1. Demand in Optimistic Scenario

        3.2.2. Demand in Likely Scenario

        3.2.3. Demand in Conservative Scenario

    3.3. Opportunity Map Analysis

    3.4. Investment Feasibility Matrix

    3.5. PESTLE and Porter’s Analysis

    3.6. Regulatory Landscape

        3.6.1. By Key Regions

        3.6.2. By Key Countries

    3.7. Regional Parent Market Outlook

4. Global Market Analysis 2018 to 2022 and Forecast, 2023 to 2033

    4.1. Historical Market Size Value (US$ Million) Analysis, 2018 to 2022

    4.2. Current and Future Market Size Value (US$ Million) Projections, 2023 to 2033

        4.2.1. Y-o-Y Growth Trend Analysis

        4.2.2. Absolute $ Opportunity Analysis

5. Global Market Analysis 2018 to 2022 and Forecast 2023 to 2033, By Type

    5.1. Introduction / Key Findings

    5.2. Historical Market Size Value (US$ Million) Analysis By Type, 2018 to 2022

    5.3. Current and Future Market Size Value (US$ Million) Analysis and Forecast By Type, 2023 to 2033

        5.3.1. Organic

        5.3.2. Conventional

    5.4. Y-o-Y Growth Trend Analysis By Type, 2018 to 2022

    5.5. Absolute $ Opportunity Analysis By Type, 2023 to 2033

6. Global Market Analysis 2018 to 2022 and Forecast 2023 to 2033, By Source

    6.1. Introduction / Key Findings

    6.2. Historical Market Size Value (US$ Million) Analysis By Source, 2018 to 2022

    6.3. Current and Future Market Size Value (US$ Million) Analysis and Forecast By Source, 2023 to 2033

        6.3.1. Plant

            6.3.1.1. Peas

            6.3.1.2. Lupins

            6.3.1.3. Corn

            6.3.1.4. Rice

            6.3.1.5. Canola

            6.3.1.6. Rapeseed

            6.3.1.7. Barley

            6.3.1.8. Wheat

        6.3.2. Animal

        6.3.3. Micro-organism

    6.4. Y-o-Y Growth Trend Analysis By Source, 2018 to 2022

    6.5. Absolute $ Opportunity Analysis By Source, 2023 to 2033

7. Global Market Analysis 2018 to 2022 and Forecast 2023 to 2033, By Application

    7.1. Introduction / Key Findings

    7.2. Historical Market Size Value (US$ Million) Analysis by Application, 2018 to 2022

    7.3. Current and Future Market Size Value (US$ Million) Analysis and Forecast by Application, 2023 to 2033

        7.3.1. Feed

            7.3.1.1. Poultry

            7.3.1.2. Livestock

            7.3.1.3. Pet Food

            7.3.1.4. Treats

        7.3.2. Fertilizers

        7.3.3. Pharmaceuticals

        7.3.4. Dietary

    7.4. Y-o-Y Growth Trend Analysis by Application, 2018 to 2022

    7.5. Absolute $ Opportunity Analysis by Application, 2023 to 2033

8. Global Market Analysis 2018 to 2022 and Forecast 2023 to 2033, By Region

    8.1. Introduction

    8.2. Historical Market Size Value (US$ Million) Analysis By Region, 2018 to 2022

    8.3. Current Market Size Value (US$ Million) Analysis and Forecast By Region, 2023 to 2033

        8.3.1. North America

        8.3.2. Latin America

        8.3.3. Western Europe

        8.3.4. Eastern Europe

        8.3.5. South Asia and Pacific

        8.3.6. East Asia

        8.3.7. Middle East and Africa

    8.4. Market Attractiveness Analysis By Region

9. North America Market Analysis 2018 to 2022 and Forecast 2023 to 2033, By Country

    9.1. Historical Market Size Value (US$ Million) Trend Analysis By Market Taxonomy, 2018 to 2022

    9.2. Market Size Value (US$ Million) Forecast By Market Taxonomy, 2023 to 2033

        9.2.1. By Country

            9.2.1.1. The USA

            9.2.1.2. Canada

        9.2.2. By Type

        9.2.3. By Source

        9.2.4. By Application

    9.3. Market Attractiveness Analysis

        9.3.1. By Country

        9.3.2. By Type

        9.3.3. By Source

        9.3.4. By Application

    9.4. Key Takeaways

10. Latin America Market Analysis 2018 to 2022 and Forecast 2023 to 2033, By Country

    10.1. Historical Market Size Value (US$ Million) Trend Analysis By Market Taxonomy, 2018 to 2022

    10.2. Market Size Value (US$ Million) Forecast By Market Taxonomy, 2023 to 2033

        10.2.1. By Country

            10.2.1.1. Brazil

            10.2.1.2. Mexico

            10.2.1.3. Rest of Latin America

        10.2.2. By Type

        10.2.3. By Source

        10.2.4. By Application

    10.3. Market Attractiveness Analysis

        10.3.1. By Country

        10.3.2. By Type

        10.3.3. By Source

        10.3.4. By Application

    10.4. Key Takeaways

11. Western Europe Market Analysis 2018 to 2022 and Forecast 2023 to 2033, By Country

    11.1. Historical Market Size Value (US$ Million) Trend Analysis By Market Taxonomy, 2018 to 2022

    11.2. Market Size Value (US$ Million) Forecast By Market Taxonomy, 2023 to 2033

        11.2.1. By Country

            11.2.1.1. Germany

            11.2.1.2. United Kingdom

            11.2.1.3. France

            11.2.1.4. Spain

            11.2.1.5. Italy

            11.2.1.6. Rest of Western Europe

        11.2.2. By Type

        11.2.3. By Source

        11.2.4. By Application

    11.3. Market Attractiveness Analysis

        11.3.1. By Country

        11.3.2. By Type

        11.3.3. By Source

        11.3.4. By Application

    11.4. Key Takeaways

12. Eastern Europe Market Analysis 2018 to 2022 and Forecast 2023 to 2033, By Country

    12.1. Historical Market Size Value (US$ Million) Trend Analysis By Market Taxonomy, 2018 to 2022

    12.2. Market Size Value (US$ Million) Forecast By Market Taxonomy, 2023 to 2033

        12.2.1. By Country

            12.2.1.1. Poland

            12.2.1.2. Russia

            12.2.1.3. Czech Republic

            12.2.1.4. Romania

            12.2.1.5. Rest of Eastern Europe

        12.2.2. By Type

        12.2.3. By Source

        12.2.4. By Application

    12.3. Market Attractiveness Analysis

        12.3.1. By Country

        12.3.2. By Type

        12.3.3. By Source

        12.3.4. By Application

    12.4. Key Takeaways

13. South Asia and Pacific Market Analysis 2018 to 2022 and Forecast 2023 to 2033, By Country

    13.1. Historical Market Size Value (US$ Million) Trend Analysis By Market Taxonomy, 2018 to 2022

    13.2. Market Size Value (US$ Million) Forecast By Market Taxonomy, 2023 to 2033

        13.2.1. By Country

            13.2.1.1. India

            13.2.1.2. Bangladesh

            13.2.1.3. Australia

            13.2.1.4. New Zealand

            13.2.1.5. Rest of South Asia and Pacific

        13.2.2. By Type

        13.2.3. By Source

        13.2.4. By Application

    13.3. Market Attractiveness Analysis

        13.3.1. By Country

        13.3.2. By Type

        13.3.3. By Source

        13.3.4. By Application

    13.4. Key Takeaways

14. East Asia Market Analysis 2018 to 2022 and Forecast 2023 to 2033, By Country

    14.1. Historical Market Size Value (US$ Million) Trend Analysis By Market Taxonomy, 2018 to 2022

    14.2. Market Size Value (US$ Million) Forecast By Market Taxonomy, 2023 to 2033

        14.2.1. By Country

            14.2.1.1. China

            14.2.1.2. Japan

            14.2.1.3. South Korea

        14.2.2. By Type

        14.2.3. By Source

        14.2.4. By Application

    14.3. Market Attractiveness Analysis

        14.3.1. By Country

        14.3.2. By Type

        14.3.3. By Source

        14.3.4. By Application

    14.4. Key Takeaways

15. Middle East and Africa Market Analysis 2018 to 2022 and Forecast 2023 to 2033, By Country

    15.1. Historical Market Size Value (US$ Million) Trend Analysis By Market Taxonomy, 2018 to 2022

    15.2. Market Size Value (US$ Million) Forecast By Market Taxonomy, 2023 to 2033

        15.2.1. By Country

            15.2.1.1. GCC Countries

            15.2.1.2. South Africa

            15.2.1.3. Israel

            15.2.1.4. Rest of MEA

        15.2.2. By Type

        15.2.3. By Source

        15.2.4. By Application

    15.3. Market Attractiveness Analysis

        15.3.1. By Country

        15.3.2. By Type

        15.3.3. By Source

        15.3.4. By Application

    15.4. Key Takeaways

16. Key Countries Market Analysis

    16.1. USA

        16.1.1. Pricing Analysis

        16.1.2. Market Share Analysis, 2022

            16.1.2.1. By Type

            16.1.2.2. By Source

            16.1.2.3. By Application

    16.2. Canada

        16.2.1. Pricing Analysis

        16.2.2. Market Share Analysis, 2022

            16.2.2.1. By Type

            16.2.2.2. By Source

            16.2.2.3. By Application

    16.3. Brazil

        16.3.1. Pricing Analysis

        16.3.2. Market Share Analysis, 2022

            16.3.2.1. By Type

            16.3.2.2. By Source

            16.3.2.3. By Application

    16.4. Mexico

        16.4.1. Pricing Analysis

        16.4.2. Market Share Analysis, 2022

            16.4.2.1. By Type

            16.4.2.2. By Source

            16.4.2.3. By Application

    16.5. Germany

        16.5.1. Pricing Analysis

        16.5.2. Market Share Analysis, 2022

            16.5.2.1. By Type

            16.5.2.2. By Source

            16.5.2.3. By Application

    16.6. United Kingdom

        16.6.1. Pricing Analysis

        16.6.2. Market Share Analysis, 2022

            16.6.2.1. By Type

            16.6.2.2. By Source

            16.6.2.3. By Application

    16.7. France

        16.7.1. Pricing Analysis

        16.7.2. Market Share Analysis, 2022

            16.7.2.1. By Type

            16.7.2.2. By Source

            16.7.2.3. By Application

    16.8. Spain

        16.8.1. Pricing Analysis

        16.8.2. Market Share Analysis, 2022

            16.8.2.1. By Type

            16.8.2.2. By Source

            16.8.2.3. By Application

    16.9. Italy

        16.9.1. Pricing Analysis

        16.9.2. Market Share Analysis, 2022

            16.9.2.1. By Type

            16.9.2.2. By Source

            16.9.2.3. By Application

    16.10. Poland

        16.10.1. Pricing Analysis

        16.10.2. Market Share Analysis, 2022

            16.10.2.1. By Type

            16.10.2.2. By Source

            16.10.2.3. By Application

    16.11. Russia

        16.11.1. Pricing Analysis

        16.11.2. Market Share Analysis, 2022

            16.11.2.1. By Type

            16.11.2.2. By Source

            16.11.2.3. By Application

    16.12. Czech Republic

        16.12.1. Pricing Analysis

        16.12.2. Market Share Analysis, 2022

            16.12.2.1. By Type

            16.12.2.2. By Source

            16.12.2.3. By Application

    16.13. Romania

        16.13.1. Pricing Analysis

        16.13.2. Market Share Analysis, 2022

            16.13.2.1. By Type

            16.13.2.2. By Source

            16.13.2.3. By Application

    16.14. India

        16.14.1. Pricing Analysis

        16.14.2. Market Share Analysis, 2022

            16.14.2.1. By Type

            16.14.2.2. By Source

            16.14.2.3. By Application

    16.15. Bangladesh

        16.15.1. Pricing Analysis

        16.15.2. Market Share Analysis, 2022

            16.15.2.1. By Type

            16.15.2.2. By Source

            16.15.2.3. By Application

    16.16. Australia

        16.16.1. Pricing Analysis

        16.16.2. Market Share Analysis, 2022

            16.16.2.1. By Type

            16.16.2.2. By Source

            16.16.2.3. By Application

    16.17. New Zealand

        16.17.1. Pricing Analysis

        16.17.2. Market Share Analysis, 2022

            16.17.2.1. By Type

            16.17.2.2. By Source

            16.17.2.3. By Application

    16.18. China

        16.18.1. Pricing Analysis

        16.18.2. Market Share Analysis, 2022

            16.18.2.1. By Type

            16.18.2.2. By Source

            16.18.2.3. By Application

    16.19. Japan

        16.19.1. Pricing Analysis

        16.19.2. Market Share Analysis, 2022

            16.19.2.1. By Type

            16.19.2.2. By Source

            16.19.2.3. By Application

    16.20. South Korea

        16.20.1. Pricing Analysis

        16.20.2. Market Share Analysis, 2022

            16.20.2.1. By Type

            16.20.2.2. By Source

            16.20.2.3. By Application

    16.21. GCC Countries

        16.21.1. Pricing Analysis

        16.21.2. Market Share Analysis, 2022

            16.21.2.1. By Type

            16.21.2.2. By Source

            16.21.2.3. By Application

    16.22. South Africa

        16.22.1. Pricing Analysis

        16.22.2. Market Share Analysis, 2022

            16.22.2.1. By Type

            16.22.2.2. By Source

            16.22.2.3. By Application

    16.23. Israel

        16.23.1. Pricing Analysis

        16.23.2. Market Share Analysis, 2022

            16.23.2.1. By Type

            16.23.2.2. By Source

            16.23.2.3. By Application

17. Market Structure Analysis

    17.1. Competition Dashboard

    17.2. Competition Benchmarking

    17.3. Market Share Analysis of Top Players

        17.3.1. By Regional

        17.3.2. By Type

        17.3.3. By Source

        17.3.4. By Application

18. Competition Analysis

    18.1. Competition Deep Dive

        18.1.1. Al Dahra ACX

            18.1.1.1. Overview

            18.1.1.2. Product Portfolio

            18.1.1.3. Profitability by Market Segments

            18.1.1.4. Sales Footprint

            18.1.1.5. Strategy Overview

                18.1.1.5.1. Marketing Strategy

        18.1.2. Archer Daniels Midland

            18.1.2.1. Overview

            18.1.2.2. Product Portfolio

            18.1.2.3. Profitability by Market Segments

            18.1.2.4. Sales Footprint

            18.1.2.5. Strategy Overview

                18.1.2.5.1. Marketing Strategy

        18.1.3. Angel Yeast Co. Ltd

            18.1.3.1. Overview

            18.1.3.2. Product Portfolio

            18.1.3.3. Profitability by Market Segments

            18.1.3.4. Sales Footprint

            18.1.3.5. Strategy Overview

                18.1.3.5.1. Marketing Strategy

        18.1.4. Cargill Inc.

            18.1.4.1. Overview

            18.1.4.2. Product Portfolio

            18.1.4.3. Profitability by Market Segments

            18.1.4.4. Sales Footprint

            18.1.4.5. Strategy Overview

                18.1.4.5.1. Marketing Strategy

        18.1.5. Calysta, Inc

            18.1.5.1. Overview

            18.1.5.2. Product Portfolio

            18.1.5.3. Profitability by Market Segments

            18.1.5.4. Sales Footprint

            18.1.5.5. Strategy Overview

                18.1.5.5.1. Marketing Strategy

        18.1.6. Lallemand Inc.

            18.1.6.1. Overview

            18.1.6.2. Product Portfolio

            18.1.6.3. Profitability by Market Segments

            18.1.6.4. Sales Footprint

            18.1.6.5. Strategy Overview

                18.1.6.5.1. Marketing Strategy

        18.1.7. Nutreco N.V

            18.1.7.1. Overview

            18.1.7.2. Product Portfolio

            18.1.7.3. Profitability by Market Segments

            18.1.7.4. Sales Footprint

            18.1.7.5. Strategy Overview

                18.1.7.5.1. Marketing Strategy

        18.1.8. Alltech

            18.1.8.1. Overview

            18.1.8.2. Product Portfolio

            18.1.8.3. Profitability by Market Segments

            18.1.8.4. Sales Footprint

            18.1.8.5. Strategy Overview

                18.1.8.5.1. Marketing Strategy

        18.1.9. Entofood

            18.1.9.1. Overview

            18.1.9.2. Product Portfolio

            18.1.9.3. Profitability by Market Segments

            18.1.9.4. Sales Footprint

            18.1.9.5. Strategy Overview

                18.1.9.5.1. Marketing Strategy

        18.1.10. Midwest Ag Enterprises

            18.1.10.1. Overview

            18.1.10.2. Product Portfolio

            18.1.10.3. Profitability by Market Segments

            18.1.10.4. Sales Footprint

            18.1.10.5. Strategy Overview

                18.1.10.5.1. Marketing Strategy

19. Assumptions & Acronyms Used

20. Research Methodology
Recommendations

Food and Beverage

Fishmeal & Fish Oil Market

January 2022

REP-GB-11281

January 2023

316 pages

Food and Beverage

Fish Gelatin Market

September 2024

REP-GB-11770

Upcoming

Explore Food and Beverage Insights

View Reports
Future Market Insights

Fish Meal Alternative Market