Fish Collagen Market Size Share, and Forecast Outlook 2025 to 2035

The fish collagen market is expected to grow from USD 1.61 billion in 2025 to USD 2.89 billion by 2035, growing at a CAGR of 6.1%.
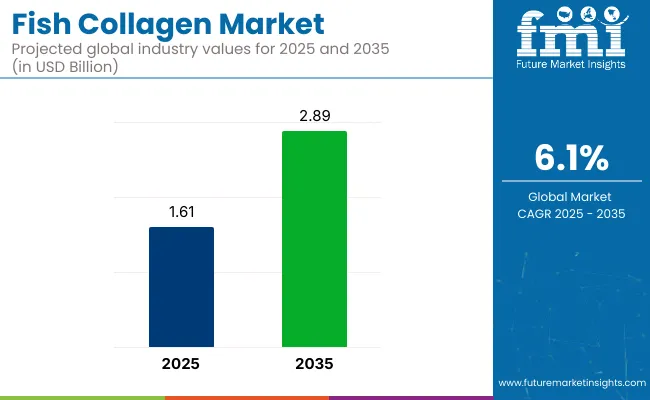
Quick Stats of the Fish Collagen Market

  • Industry Value (2025): USD 1.61 billion
  • Industry Forecast Value (2035): USD 2.89 billion
  • Global CAGR: 6.1%
  • Leading Segment in 2025: Nutraceuticals (~52.4% share
  • Key Growth Region: South Asia & Pacific (India with CAGR of 7.0%)
  • Key Players: Gelita AG, Ashland, Nitta Gelatin, Titan Biotech Limited, Darling Ingredients

Fish Collagen Market

Metric Value
Industry Value (2025) USD 1.61 billion
Industry Forecast Value (2035) USD 2.89 billion
Global CAGR (2025 to 2035) 6.1%

Extra capacity is being added with Rousselot’s South-American network now covering 46,000 t of gelatine and collagen a year, while Nitta Gelatin India will lift peptide output to 1,150 t by July 2025, easing supply gaps in ASEAN and BRICS regions.

NIQ flags collagen among the fastest-spreading functional beverage ingredients, with 258 new items launched last year, and notes collagen-infused pet treats rising in premium channels. Long-term contracts for cold-water skins and bones are advised to be secured to protect margins.

On May 12, 2025, Darling Ingredients announced a non-binding agreement with Tessenderlo Group to combine their collagen and gelatin segments into a new company called Nextida™. This joint venture aims to create a top-tier, collagen-based health, wellness, and nutrition products company, positioned to capitalize on global collagen growth. Pending regulatory approvals, Nextida will operate as a joint venture, with Darling Ingredients holding an 85% ownership stake and Tessenderlo Group holding the remaining 15%.

Fish collagen industry share has been distributed across its broader parent industries as follows. Within the global nutraceutical ingredients industry, marine collagen accounts for approximately 1.8-2.2%, owing to its inclusion in joint, bone, and skin health supplements. In the marine-based protein ingredients industry, its share stands at 6-8%, driven by rising demand for hydrolyzed peptides.

Across the functional food and beverage additives industry, it contributes about 1.5-2%, commonly found in fortified snacks, beverages, and protein blends. Within the cosmeceuticals and beauty-from-within ingredients industry, its presence is more pronounced at 8-10%, supported by ingestible skincare trends. In the pharmaceutical-grade bioactive compounds industry, marine collagen holds a modest 0.5-1% share due to regulatory hurdles and clinical evidence requirements.

Analyzing Fish Collagen Market by Top Investment Segments

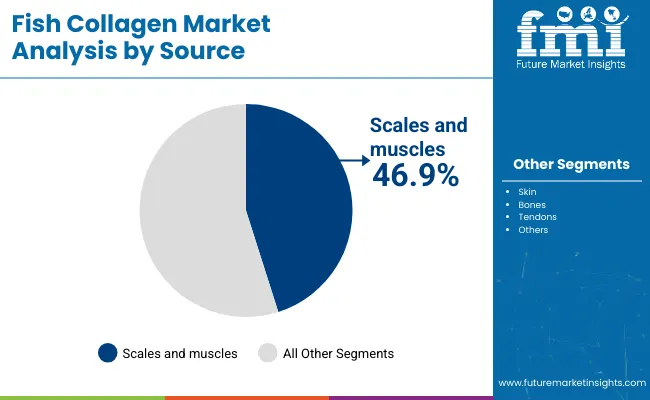
In the industry, scales and muscles lead the source segment with a 46.9% share. The nutraceuticals sector dominates the application segment at 52.4%, driven by demand for dietary supplements. The offline sales channel holds a 65% share, led by retail stores. The industry is expanding across North America, Latin America, Europe, Asia, and the Middle East & Africa.
Scales and Muscles Lead the Source Segment

Fish Collagen Market By Source

In 2025, scales and muscles are projected to account for 46.9% of the market. These parts are rich in type I collagen, making them ideal for extraction in various applications such as skincare, joint health, and functional foods.

Their high bioavailability and effectiveness in promoting skin elasticity and joint health are driving increased adoption. As demand for high-quality collagen rises, the extraction process is being refined to improve product quality. This growth is supporting their widespread use in both beauty products and health supplements, contributing to the expansion of the industry.

  • Type I collagen is extracted primarily from scales and muscles.
  • Advanced extraction techniques are being used to improve collagen quality.
  • This segment is pivotal in the growth of health, beauty, and wellness products.

Offline Sales Channel Dominates Market Distribution

The offline sales channel is expected to lead the market with a 65% share in 2025. Retail stores, pharmacies, and health food outlets are the primary distribution channels for collagen products, with consumers preferring to buy in person for product validation and expert advice.

Despite the growth of online shopping, physical retail locations continue to drive the majority of collagen sales in key industries such as North America, Europe, and Asia. The offline channel’s prominence remains strong due to consumer trust and the ability to interact directly with knowledgeable sales representatives.
  • The majority of collagen products are sold through retail outlets and pharmacies.
  • Consumers value the ability to inspect products in-store before purchasing.
  • Offline channels maintain dominance, particularly in regions like North America and Europe.

Nutraceuticals Drive the Application Segment

Fish Collagen Market By Application

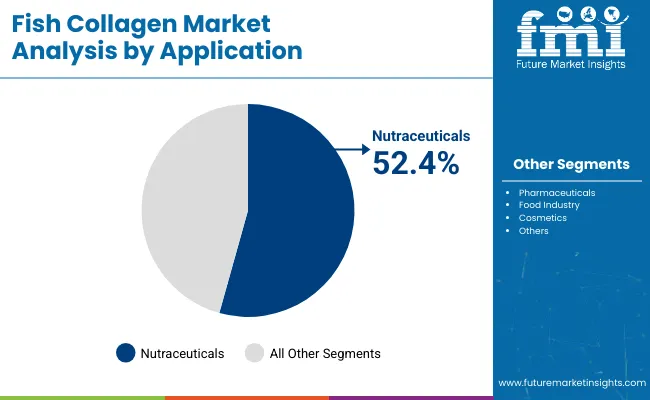
Nutraceuticals are expected to capture a 52.4% share in 2025. Fish collagen’s superior bioavailability makes it highly effective in supplements targeting joint, skin, and bone health. As consumers increasingly seek natural, bioavailable ingredients, marine collagen is becoming a key component in functional foods.

The rising demand for health-focused, all-natural products is propelling the nutraceutical sector's expansion, as collagen is increasingly used to support overall wellness. The segment’s growth is further bolstered by the trend towards natural ingredients in supplements and fortified foods.

  • Marine collagen is being incorporated into supplements for joint and skin health.
  • Rising consumer interest in bioavailable ingredients is driving industry growth.
  • Functional food formulations increasingly include marine collagen for added health benefits.

Top Fish Collagen Market Dynamics

The industry is expanding due to enhanced sourcing efficiency and supply chain improvements, reducing spoilage and boosting turnover. Clinical studies validating its benefits in skincare and functional foods are driving growth. Retailers have increased shelf space for collagen products, while premium pricing and demand rise in sports-nutrition sectors.

Enhanced Sourcing and Efficient Supply Chain Practices

Fish collagen supply chains have been streamlined by retailers and manufacturers to reduce spoilage and improve efficiency. Storage times have been reduced by 25% in key industry in 2025 due to advanced preservation and cold-chain monitoring. Faster turnover rates in North America and Europe have led to a 15% increase in shelf space for premium collagen products. Traceability technologies have reduced rejection rates by 8%, while foreign material contamination has decreased by 10%.

  • A 15% increase in shelf space for collagen-based products has been observed.
  • Rejection rates have been reduced by 8% with enhanced traceability and cold-chain management.
  • Production runs have been optimized, leading to a 10% reduction in buffer stocks.

Cosmetic and Functional Food Segments Gain Industry Validation

Fish collagen peptides have been shown to significantly improve skin elasticity, hydration, and reduce wrinkle depth, as demonstrated by clinical studies in 2024. The EU allocated EUR 12 million for research, promoting its use in cosmetics and functional foods.

Retailers in Europe and North America have reported a 20% increase in sales of collagen-based beauty products, while sports-nutrition distributors have introduced marine collagen peptides into protein shakes, driving premium pricing and higher consumer demand.
  • A 20% sales increase in collagen-based skincare products has been recorded in Europe.
  • Collagen peptides have been incorporated into premium protein shakes and functional foods.
  • A 12% price premium for fish collagen-based products has been reported in the gym-nutrition segment.

Top Countries Formulating, Blending, Commercializing, and Expanding Fish Collagen Demand

Country Wise Analysis Of Fish Collagen Market

The report covers detailed analysis of 40+ countries and the top five countries have been shared as a reference.

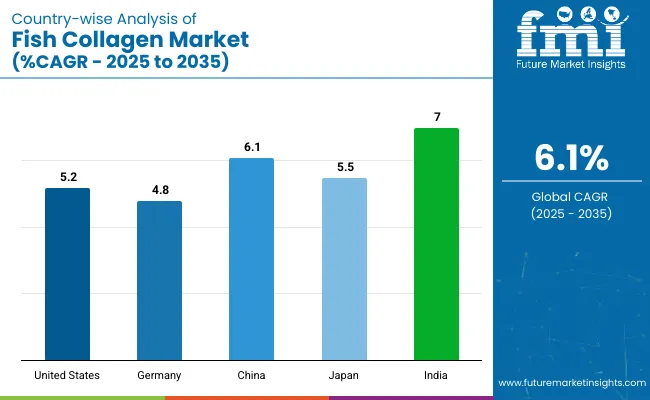
Countries CAGR (2025 to 2035)
United States 5.2%
Germany 4.8%
China 6.1%
Japan 5.5%
India 7.0%

Global fish collagen demand is projected to grow at a 6.1% CAGR from 2025 to 2035. India, a BRICS nation, outpaces the global average with a 7.0% CAGR, driven by rising health awareness and growing demand for functional foods and supplements. China, also in BRICS, follows with a 6.1% growth rate, fueled by increasing popularity of collagen-based beauty and wellness products in urban areas.

Both countries are expanding local production to meet rising demand. The United States, part of the OECD, shows a 5.2% CAGR, with steady demand primarily from the beauty and nutraceutical sectors. Germany, another OECD country, records a 4.8% growth rate, limited by regulatory constraints and a developed industry. Japan, with a 5.5% CAGR, is benefiting from its aging population, leading to increased demand for collagen in health and skincare.

Growth Outlook of the Fish Collagen Market in the United States

The requirement for fish collagen in the United Statesis growing at a CAGR of 5.2% from 2025 to 2035. Rising consumer awareness about the health benefits of collagen, particularly for skin, joints, and bones, is driving the demand for collagen-based products.

Despite slower growth compared to other regions, the industry remains strong, with sustained demand for fish collagen-based supplements and functional foods. Retailers are expanding their offerings, focusing on bioavailable and natural ingredients to meet growing consumer expectations. Collagen is being incorporated into a variety of products aimed at improving health and beauty.

  • Demand for collagen-based supplements is growing steadily.
  • Bioavailability and natural ingredients are driving industry expansion.
  • The industry continues to be a key player in USA wellness products.

Growth Analysis of the Fish Collagen Market in Germany

Demand for fish collagen in Germany is expected to grow at a CAGR of 4.8% through 2035. Increasing demand for collagen in the beauty and nutraceutical sectors is driving industry growth. Consumers in Germany are becoming more focused on natural, bioavailable products, and marine collagen is being increasingly preferred in skincare and dietary supplements.

The growth of the German industry is being supported by the rising consumer interest in natural health products, with collagen being incorporated into a variety of formulations aimed at enhancing beauty, health, and wellness.

  • Beauty and health supplements are driving the demand.
  • Regulatory constraints are impacting growth, but expansion continues.
  • Bioavailable, natural products are attracting German consumers.

In-depth Analysis of the Fish Collagen Market in China

Sales of fish collagen in Chinaare projected to experience a CAGR of 6.1% from 2025 to 2035. The rising middle class and increased health awareness are contributing to a growing demand for collagen supplements, particularly in urban areas. collagen is increasingly used in beauty and skincare products due to its high bioavailability and effectiveness.

Despite facing local sourcing challenges and a preference for domestic collagen sources, the demand for collagen continues to grow. This growth is being driven by an expanding consumer base that is becoming more health-conscious. The expansion is supported by the increased focus on beauty and wellness products enriched with fish collagen.

  • The growing middle class and health awareness are driving collagen demand.
  • The use of marine collagen in beauty products supports industry growth.
  • Local sourcing challenges impact market expansion but do not hinder demand.

Growth Trajectory of the Fish Collagen Market in Japan

The adoption rate of fish collagen in Japan is set to grow at a CAGR of 5.5% through 2035. The aging population is a major factor driving demand for collagen-based products, particularly for joint and skin health. Marine collagen is increasingly incorporated into beauty products and functional foods, contributing to industry growth.

Despite the developed industry in Japan, collagen-based products continue to see rising demand due to innovations in product formulations and growing interest in natural health supplements. The aging demographic is expected to continue fueling demand for collagen, with consumers seeking products to improve skin elasticity and support joint health.

  • Aging population increases demand for joint and skin health products.
  • Marine collagen is expanding in beauty and functional foods.
  • Product innovation continues to drive demand in developed market.

Market Outlook for Fish Collagen in India

India is projected to grow at a CAGR of 7.0% from 2025 to 2035, leading the market growth among the analyzed countries. The expanding middle class and increasing health awareness are major drivers of the rising demand for marine collagen in supplements and functional foods. Additionally, growing interest in natural, plant-based products and skincare solutions is boosting the consumption of marine collagen.

The wellness trend is positioning collagen as a key ingredient in the health and beauty sectors, further accelerating its adoption. As consumer awareness around the benefits of collagen continues to rise, the demand for collagen-based products is expected to see significant growth in the coming years.

  • Expanding middle class and rising health awareness drive growth.
  • Demand for natural health supplements boosts collagen consumption.
  • The wellness trend is contributing to higher adoption of collagen in India.

Leading Fish Collagen Market Suppliers

Leading Company - Gelita AGMarket Share - 11.4%

The industry is segmented into dominant, key, and emerging suppliers, where competitive advantage has been determined by hydrolysis precision, peptide absorption rates, and global formulation partnerships. Gelita AG has been recognized as the leading company, with its market share driven by pharmaceutical-grade peptide chains and broad application in nutraceuticals and cosmeceuticals. Ashland and Nitta Gelatin have been positioned as dominant suppliers, enabled by strong bioavailability research and regional distribution contracts.

Key players such as Hangzhou Nutrition Biotechnology, Titan Biotech Limited, and Tai Ai Peptide Group have built scale through OEM-based collagen solutions and clean-label ingredient certifications. Emerging firms like Certified Nutraceuticals, ETChem, and BHN have been growing through innovation in functional beverage formats and customized skin-health blends.

Recent Fish Collagen Industry News

  • On April 2025 Ashland has completed a USD 10 million expansion of its pharmaceutical manufacturing plant in Cabreúva, Brazil. This facility is expected to enhance the company's capabilities in producing biofunctional ingredients, including marine collagen peptides.
  • On April 24, 2025,Rousselot, Darling Ingredients' health brand, earned Upcycled Certified® status for its Peptan® collagen peptides. This certification emphasizes the company's commitment to sustainability by supporting a circular and responsible supply chain.

Leading Manufacturers in Fish Collagen Market

  • Ashland
  • Gelita
  • Hangzhou Nutrition Biotechnology
  • Titan Biotech Limited
  • Certified Nutraceuticals
  • Darling Ingredients
  • Tai Ai Peptide Group
  • ETChem
  • BHN
  • Nitta Gelatin

Report Scope

Report Attributes Details
Industry Size (2025) USD 1.61 billion
Projected Industry Size (2035) USD 2.89 billion
CAGR (2025 to 2035) 6.1%
Base Year for Estimation 2024
Historical Period 2020 to 2024
Projections Period 2025 to 2035
Quantitative Units USD billion for value and thousand metric tons for volume
Sources Analyzed (Segment 1) Scales and Muscles, Skin, Bones and Tendons, Others
Sales Channels Analyzed (Segment 2) Online, Offline
Applications Analyzed (Segment 3) Nutraceuticals, Pharmaceuticals, Food Industry, Cosmetics
Countries Covered United States, Canada, Germany, United Kingdom, France, Italy, Spain, China, India, Japan, South Korea, Australia, Brazil, Mexico, Argentina, Saudi Arabia, UAE, South Africa
Regions Covered North America, Latin America, Western Europe, Eastern Europe, South Asia & Pacific, East Asia, Central Asia, Balkan and Baltic countries, Russia and Belarus, Middle East & Africa
Key Players Ashland, Gelita, Hangzhou Nutrition Biotechnology, Titan Biotech Limited, Certified Nutraceuticals, Darling Ingredients, Tai Ai Peptide Group, ETChem, BHN, Nitta Gelatin
Additional Attributes Dollar sales, share by source and application, collagen peptide integration in dietary supplements, rising cosmetic and pharmaceutical formulations, supply diversification across marine raw material types

Key Segments

By Source:

The industry is categorized into Scales and Muscles, Skin, Bones and Tendons, and Others.

By Sales Channel:

The industry is categorized into Online and Offline.

By Application:

The industry is categorized into Nutraceuticals, Pharmaceuticals, Food Industry, and Cosmetics.

By Region:

The industry is analyzed across North America, Latin America, Western Europe, Eastern Europe, South Asia & Pacific, East Asia, Central Asia, Balkan and Baltic countries, Russia and Belarus, and the Middle East & Africa.

Table of Content

  1. Executive Summary
    • Global Market Outlook
    • Demand-side Trends
    • Supply-side Trends
    • Technology Roadmap Analysis
    • Analysis and Recommendations
  2. Market Overview
    • Market Coverage/Taxonomy
    • Market Definition/Scope/Limitations
  3. Market Background
    • Market Dynamics
      • Drivers
      • Restraints
      • Opportunity
      • Trends
    • Scenario Forecast
      • Demand in Optimistic Scenario
      • Demand in Likely Scenario
      • Demand in Conservative Scenario
    • Opportunity Map Analysis
    • Product Life Cycle Analysis
    • Supply Chain Analysis
      • Supply Side Participants and their Roles
        • Producers
        • Mid-Level Participants (Traders/ Agents/ Brokers)
        • Wholesalers and Distributors
      • Value Added and Value Created at Node in the Supply Chain
      • List of Raw Material Suppliers
      • List of Existing and Potential Buyer’s
    • Investment Feasibility Matrix
    • Value Chain Analysis
      • Profit Margin Analysis
      • Wholesalers and Distributors
      • Retailers
    • PESTLE and Porter’s Analysis
    • Regulatory Landscape
      • By Key Regions
      • By Key Countries
    • Regional Parent Market Outlook
    • Production and Consumption Statistics
    • Import and Export Statistics
  4. Global Market Analysis 2020 to 2024 and Forecast, 2025 to 2035
    • Historical Market Size Value (USD Billion) & Volume (Thosaand MT) Analysis, 2020 to 2024
    • Current and Future Market Size Value (USD Billion) & Volume (Thosaand MT) Projections, 2025 to 2035
      • Y-o-Y Growth Trend Analysis
      • Absolute $ Opportunity Analysis
  5. Global Market Pricing Analysis 2020 to 2024 and Forecast 2025 to 2035
  6. Global Market Analysis 2020 to 2024 and Forecast 2025 to 2035, By Source
    • Introduction/Key Findings
    • Historical Market Size Value (USD Billion) & Volume (Thosaand MT) Analysis By Source, 2020 to 2024
    • Current and Future Market Size Value (USD Billion) & Volume (Thosaand MT) Analysis and Forecast By Source, 2025 to 2035
      • Scales and Muscles
      • Skin
      • Bones and Tendons
      • Others
    • Y-o-Y Growth Trend Analysis By Source, 2020 to 2024
    • Absolute $ Opportunity Analysis By Source, 2025 to 2035
  7. Global Market Analysis 2020 to 2024 and Forecast 2025 to 2035, By Sales Channel
    • Introduction/Key Findings
    • Historical Market Size Value (USD Billion) & Volume (Thosaand MT) Analysis By Sales Channel, 2020 to 2024
    • Current and Future Market Size Value (USD Billion) & Volume (Thosaand MT) Analysis and Forecast By Sales Channel, 2025 to 2035
      • Online
      • Offline
    • Y-o-Y Growth Trend Analysis By Sales Channel, 2020 to 2024
    • Absolute $ Opportunity Analysis By Sales Channel, 2025 to 2035
  8. Global Market Analysis 2020 to 2024 and Forecast 2025 to 2035, By Application
    • Introduction/Key Findings
    • Historical Market Size Value (USD Billion) & Volume (Thosaand MT) Analysis By Application, 2020 to 2024
    • Current and Future Market Size Value (USD Billion) & Volume (Thosaand MT) Analysis and Forecast By Application, 2025 to 2035
      • Nutraceuticals
      • Pharmaceuticals
      • Food Industry
      • Cosmetics
    • Y-o-Y Growth Trend Analysis By Application, 2020 to 2024
    • Absolute $ Opportunity Analysis By Application, 2025 to 2035
  9. Global Market Analysis 2020 to 2024 and Forecast 2025 to 2035, By Region
    • Introduction
    • Historical Market Size Value (USD Billion) & Volume (Thosaand MT) Analysis By Region, 2020 to 2024
    • Current Market Size Value (USD Billion) & Volume (Thosaand MT) Analysis and Forecast By Region, 2025 to 2035
      • North America
      • Latin America
      • Western Europe
      • Eastern Europe
      • East Asia
      • South Asia & Pacific
      • Middle East and Africa
    • Market Attractiveness Analysis By Region
  10. North America Market Analysis 2020 to 2024 and Forecast 2025 to 2035, By Country
    • Historical Market Size Value (USD Billion) & Volume (Thosaand MT) Trend Analysis By Market Taxonomy, 2020 to 2024
    • Market Size Value (USD Billion) & Volume (Thosaand MT) Forecast By Market Taxonomy, 2025 to 2035
      • By Country
        • USA
        • Canada
        • Mexico
      • By Source
      • By Sales Channel
      • By Application
    • Market Attractiveness Analysis
      • By Country
      • By Source
      • By Sales Channel
      • By Application
    • Key Takeaways
  11. Latin America Market Analysis 2020 to 2024 and Forecast 2025 to 2035, By Country
    • Historical Market Size Value (USD Billion) & Volume (Thosaand MT) Trend Analysis By Market Taxonomy, 2020 to 2024
    • Market Size Value (USD Billion) & Volume (Thosaand MT) Forecast By Market Taxonomy, 2025 to 2035
      • By Country
        • Brazil
        • Argentina
        • Rest of LATAM
      • By Source
      • By Sales Channel
      • By Application
    • Market Attractiveness Analysis
      • By Country
      • By Source
      • By Sales Channel
      • By Application
    • Key Takeaways
  12. Western Europe Market Analysis 2020 to 2024 and Forecast 2025 to 2035, By Country
    • Historical Market Size Value (USD Billion) & Volume (Thosaand MT) Trend Analysis By Market Taxonomy, 2020 to 2024
    • Market Size Value (USD Billion) & Volume (Thosaand MT) Forecast By Market Taxonomy, 2025 to 2035
      • By Country
        • Germany
        • Italy
        • France
        • UK
        • Spain
        • BENELUX
        • Nordic
        • Rest of W.Europe
      • By Source
      • By Sales Channel
      • By Application
    • Market Attractiveness Analysis
      • By Country
      • By Source
      • By Sales Channel
      • By Application
    • Key Takeaways
  13. Eastern Europe Market Analysis 2020 to 2024 and Forecast 2025 to 2035, By Country
    • Historical Market Size Value (USD Billion) & Volume (Thosaand MT) Trend Analysis By Market Taxonomy, 2020 to 2024
    • Market Size Value (USD Billion) & Volume (Thosaand MT) Forecast By Market Taxonomy, 2025 to 2035
      • By Country
        • Russia
        • Hungary
        • Poland
        • Balkan & Baltics
        • Rest of E. Europe
      • By Source
      • By Sales Channel
      • By Application
    • Market Attractiveness Analysis
      • By Country
      • By Source
      • By Sales Channel
      • By Application
    • Key Takeaways
  14. East Asia Market Analysis 2020 to 2024 and Forecast 2025 to 2035, By Country
    • Historical Market Size Value (USD Billion) & Volume (Thosaand MT) Trend Analysis By Market Taxonomy, 2020 to 2024
    • Market Size Value (USD Billion) & Volume (Thosaand MT) Forecast By Market Taxonomy, 2025 to 2035
      • By Country
        • China
        • Japan
        • South Korea
      • By Source
      • By Sales Channel
      • By Application
    • Market Attractiveness Analysis
      • By Country
      • By Source
      • By Sales Channel
      • By Application
    • Key Takeaways
  15. South Asia & Pacific Market Analysis 2020 to 2024 and Forecast 2025 to 2035, By Country
    • Historical Market Size Value (USD Billion) & Volume (Thosaand MT) Trend Analysis By Market Taxonomy, 2020 to 2024
    • Market Size Value (USD Billion) & Volume (Thosaand MT) Forecast By Market Taxonomy, 2025 to 2035
      • By Country
        • India
        • Australia & New Zealand
        • ASEAN
        • Rest of SAP
      • By Source
      • By Sales Channel
      • By Application
    • Market Attractiveness Analysis
      • By Country
      • By Source
      • By Sales Channel
      • By Application
    • Key Takeaways
  16. Middle East and Africa Market Analysis 2020 to 2024 and Forecast 2025 to 2035, By Country
    • Historical Market Size Value (USD Billion) & Volume (Thosaand MT) Trend Analysis By Market Taxonomy, 2020 to 2024
    • Market Size Value (USD Billion) & Volume (Thosaand MT) Forecast By Market Taxonomy, 2025 to 2035
      • By Country
        • GCC Countries
        • Northern Africa
        • South Africa
        • Turkiye
        • Rest of MEA
      • By Source
      • By Sales Channel
      • By Application
    • Market Attractiveness Analysis
      • By Country
      • By Source
      • By Sales Channel
      • By Application
    • Key Takeaways
  17. Key Countries Market Analysis
    • USA
      • Pricing Analysis
      • Market Share Analysis, 2024
        • By Source
        • By Sales Channel
        • By Application
    • Canada
      • Pricing Analysis
      • Market Share Analysis, 2024
        • By Source
        • By Sales Channel
        • By Application
    • Brazil
      • Pricing Analysis
      • Market Share Analysis, 2024
        • By Source
        • By Sales Channel
        • By Application
    • Mexico
      • Pricing Analysis
      • Market Share Analysis, 2024
        • By Source
        • By Sales Channel
        • By Application
    • Argentina
      • Pricing Analysis
      • Market Share Analysis, 2024
        • By Source
        • By Sales Channel
        • By Application
  18. Market Structure Analysis
    • Competition Dashboard
    • Competition Benchmarking
    • Market Share Analysis of Top Players
      • By Regional
      • By Source
      • By Sales Channel
      • By Application
  19. Competition Analysis
    • Competition Deep Dive
      • Ashland
        • Overview
        • Product Portfolio
        • Profitability by Market Segments (Product/Age /Sales Channel/Region)
        • Sales Footprint
        • Strategy Overview
          • Marketing Strategy
          • Product Strategy
          • Channel Strategy
      • Gelita
        • Overview
        • Product Portfolio
        • Profitability by Market Segments (Product/Age /Sales Channel/Region)
        • Sales Footprint
        • Strategy Overview
          • Marketing Strategy
          • Product Strategy
          • Channel Strategy
      • Hangzhou Nutrition Biotechnology
        • Overview
        • Product Portfolio
        • Profitability by Market Segments (Product/Age /Sales Channel/Region)
        • Sales Footprint
        • Strategy Overview
          • Marketing Strategy
          • Product Strategy
          • Channel Strategy
      • Titan Biotech Limited
        • Overview
        • Product Portfolio
        • Profitability by Market Segments (Product/Age /Sales Channel/Region)
        • Sales Footprint
        • Strategy Overview
          • Marketing Strategy
          • Product Strategy
          • Channel Strategy
      • Certified Nutraceuticals
        • Overview
        • Product Portfolio
        • Profitability by Market Segments (Product/Age /Sales Channel/Region)
        • Sales Footprint
        • Strategy Overview
          • Marketing Strategy
          • Product Strategy
          • Channel Strategy
      • Darling Ingredients
        • Overview
        • Product Portfolio
        • Profitability by Market Segments (Product/Age /Sales Channel/Region)
        • Sales Footprint
        • Strategy Overview
          • Marketing Strategy
          • Product Strategy
          • Channel Strategy
      • Tai Ai Peptide Group
        • Overview
        • Product Portfolio
        • Profitability by Market Segments (Product/Age /Sales Channel/Region)
        • Sales Footprint
        • Strategy Overview
          • Marketing Strategy
          • Product Strategy
          • Channel Strategy
      • ETChem
        • Overview
        • Product Portfolio
        • Profitability by Market Segments (Product/Age /Sales Channel/Region)
        • Sales Footprint
        • Strategy Overview
          • Marketing Strategy
          • Product Strategy
          • Channel Strategy
      • BHN
        • Overview
        • Product Portfolio
        • Profitability by Market Segments (Product/Age /Sales Channel/Region)
        • Sales Footprint
        • Strategy Overview
          • Marketing Strategy
          • Product Strategy
          • Channel Strategy
      • Nitta Gelatin
        • Overview
        • Product Portfolio
        • Profitability by Market Segments (Product/Age /Sales Channel/Region)
        • Sales Footprint
        • Strategy Overview
          • Marketing Strategy
          • Product Strategy
          • Channel Strategy
  20. Assumptions & Acronyms Used
  21. Research Methodology

List of Tables

  • Table 1: Global Market Value (USD Billion) Forecast by Region, 2020-2035
  • Table 2: Global Market Volume (Thosaand MT) Forecast by Region, 2020-2035
  • Table 3: Global Market Value (USD Billion) Forecast by Source, 2020-2035
  • Table 4: Global Market Volume (Thosaand MT) Forecast by Source, 2020-2035
  • Table 5: Global Market Value (USD Billion) Forecast by Sales Channel, 2020-2035
  • Table 6: Global Market Volume (Thosaand MT) Forecast by Sales Channel, 2020-2035
  • Table 7: Global Market Value (USD Billion) Forecast by Application, 2020-2035
  • Table 8: Global Market Volume (Thosaand MT) Forecast by Application, 2020-2035
  • Table 9: North America Market Value (USD Billion) Forecast by Country, 2020-2035
  • Table 10: North America Market Volume (Thosaand MT) Forecast by Country, 2020-2035
  • Table 11: North America Market Value (USD Billion) Forecast by Source, 2020-2035
  • Table 12: North America Market Volume (Thosaand MT) Forecast by Source, 2020-2035
  • Table 13: North America Market Value (USD Billion) Forecast by Sales Channel, 2020-2035
  • Table 14: North America Market Volume (Thosaand MT) Forecast by Sales Channel, 2020-2035
  • Table 15: North America Market Value (USD Billion) Forecast by Application, 2020-2035
  • Table 16: North America Market Volume (Thosaand MT) Forecast by Application, 2020-2035
  • Table 17: Latin America Market Value (USD Billion) Forecast by Country, 2020-2035
  • Table 18: Latin America Market Volume (Thosaand MT) Forecast by Country, 2020-2035
  • Table 19: Latin America Market Value (USD Billion) Forecast by Source, 2020-2035
  • Table 20: Latin America Market Volume (Thosaand MT) Forecast by Source, 2020-2035
  • Table 21: Latin America Market Value (USD Billion) Forecast by Sales Channel, 2020-2035
  • Table 22: Latin America Market Volume (Thosaand MT) Forecast by Sales Channel, 2020-2035
  • Table 23: Latin America Market Value (USD Billion) Forecast by Application, 2020-2035
  • Table 24: Latin America Market Volume (Thosaand MT) Forecast by Application, 2020-2035
  • Table 25: Western Europe Market Value (USD Billion) Forecast by Country, 2020-2035
  • Table 26: Western Europe Market Volume (Thosaand MT) Forecast by Country, 2020-2035
  • Table 27: Western Europe Market Value (USD Billion) Forecast by Source, 2020-2035
  • Table 28: Western Europe Market Volume (Thosaand MT) Forecast by Source, 2020-2035
  • Table 29: Western Europe Market Value (USD Billion) Forecast by Sales Channel, 2020-2035
  • Table 30: Western Europe Market Volume (Thosaand MT) Forecast by Sales Channel, 2020-2035
  • Table 31: Western Europe Market Value (USD Billion) Forecast by Application, 2020-2035
  • Table 32: Western Europe Market Volume (Thosaand MT) Forecast by Application, 2020-2035
  • Table 33: Eastern Europe Market Value (USD Billion) Forecast by Country, 2020-2035
  • Table 34: Eastern Europe Market Volume (Thosaand MT) Forecast by Country, 2020-2035
  • Table 35: Eastern Europe Market Value (USD Billion) Forecast by Source, 2020-2035
  • Table 36: Eastern Europe Market Volume (Thosaand MT) Forecast by Source, 2020-2035
  • Table 37: Eastern Europe Market Value (USD Billion) Forecast by Sales Channel, 2020-2035
  • Table 38: Eastern Europe Market Volume (Thosaand MT) Forecast by Sales Channel, 2020-2035
  • Table 39: Eastern Europe Market Value (USD Billion) Forecast by Application, 2020-2035
  • Table 40: Eastern Europe Market Volume (Thosaand MT) Forecast by Application, 2020-2035
  • Table 41: East Asia Market Value (USD Billion) Forecast by Country, 2020-2035
  • Table 42: East Asia Market Volume (Thosaand MT) Forecast by Country, 2020-2035
  • Table 43: East Asia Market Value (USD Billion) Forecast by Source, 2020-2035
  • Table 44: East Asia Market Volume (Thosaand MT) Forecast by Source, 2020-2035
  • Table 45: East Asia Market Value (USD Billion) Forecast by Sales Channel, 2020-2035
  • Table 46: East Asia Market Volume (Thosaand MT) Forecast by Sales Channel, 2020-2035
  • Table 47: East Asia Market Value (USD Billion) Forecast by Application, 2020-2035
  • Table 48: East Asia Market Volume (Thosaand MT) Forecast by Application, 2020-2035
  • Table 49: South Asia & Pacific Market Value (USD Billion) Forecast by Country, 2020-2035
  • Table 50: South Asia & Pacific Market Volume (Thosaand MT) Forecast by Country, 2020-2035
  • Table 51: South Asia & Pacific Market Value (USD Billion) Forecast by Source, 2020-2035
  • Table 52: South Asia & Pacific Market Volume (Thosaand MT) Forecast by Source, 2020-2035
  • Table 53: South Asia & Pacific Market Value (USD Billion) Forecast by Sales Channel, 2020-2035
  • Table 54: South Asia & Pacific Market Volume (Thosaand MT) Forecast by Sales Channel, 2020-2035
  • Table 55: South Asia & Pacific Market Value (USD Billion) Forecast by Application, 2020-2035
  • Table 56: South Asia & Pacific Market Volume (Thosaand MT) Forecast by Application, 2020-2035
  • Table 57: Middle East and Africa Market Value (USD Billion) Forecast by Country, 2020-2035
  • Table 58: Middle East and Africa Market Volume (Thosaand MT) Forecast by Country, 2020-2035
  • Table 59: Middle East and Africa Market Value (USD Billion) Forecast by Source, 2020-2035
  • Table 60: Middle East and Africa Market Volume (Thosaand MT) Forecast by Source, 2020-2035
  • Table 61: Middle East and Africa Market Value (USD Billion) Forecast by Sales Channel, 2020-2035
  • Table 62: Middle East and Africa Market Volume (Thosaand MT) Forecast by Sales Channel, 2020-2035
  • Table 63: Middle East and Africa Market Value (USD Billion) Forecast by Application, 2020-2035
  • Table 64: Middle East and Africa Market Volume (Thosaand MT) Forecast by Application, 2020-2035

List of Figures

  • Figure 1: Global Market Volume (Thosaand MT) Forecast 2020-2035
  • Figure 2: Global Market Pricing Analysis
  • Figure 3: Global Market Value (USD Billion) Forecast 2020-2035
  • Figure 4: Global Market Value Share and BPS Analysis by Source, 2025 and 2035
  • Figure 5: Global Market Y-o-Y Growth Comparison by Source, 2025-2035
  • Figure 6: Global Market Attractiveness Analysis by Source
  • Figure 7: Global Market Value Share and BPS Analysis by Sales Channel, 2025 and 2035
  • Figure 8: Global Market Y-o-Y Growth Comparison by Sales Channel, 2025-2035
  • Figure 9: Global Market Attractiveness Analysis by Sales Channel
  • Figure 10: Global Market Value Share and BPS Analysis by Application, 2025 and 2035
  • Figure 11: Global Market Y-o-Y Growth Comparison by Application, 2025-2035
  • Figure 12: Global Market Attractiveness Analysis by Application
  • Figure 13: Global Market Value (USD Billion) Share and BPS Analysis by Region, 2025 and 2035
  • Figure 14: Global Market Y-o-Y Growth Comparison by Region, 2025-2035
  • Figure 15: Global Market Attractiveness Analysis by Region
  • Figure 16: North America Market Incremental $ Opportunity, 2025-2035
  • Figure 17: Latin America Market Incremental $ Opportunity, 2025-2035
  • Figure 18: Western Europe Market Incremental $ Opportunity, 2025-2035
  • Figure 19: Eastern Europe Market Incremental $ Opportunity, 2025-2035
  • Figure 20: East Asia Market Incremental $ Opportunity, 2025-2035
  • Figure 21: South Asia & Pacific Market Incremental $ Opportunity, 2025-2035
  • Figure 22: Middle East and Africa Market Incremental $ Opportunity, 2025-2035
  • Figure 23: North America Market Value Share and BPS Analysis by Country, 2025 and 2035
  • Figure 24: North America Market Value Share and BPS Analysis by Source, 2025 and 2035
  • Figure 25: North America Market Y-o-Y Growth Comparison by Source, 2025-2035
  • Figure 26: North America Market Attractiveness Analysis by Source
  • Figure 27: North America Market Value Share and BPS Analysis by Sales Channel, 2025 and 2035
  • Figure 28: North America Market Y-o-Y Growth Comparison by Sales Channel, 2025-2035
  • Figure 29: North America Market Attractiveness Analysis by Sales Channel
  • Figure 30: North America Market Value Share and BPS Analysis by Application, 2025 and 2035
  • Figure 31: North America Market Y-o-Y Growth Comparison by Application, 2025-2035
  • Figure 32: North America Market Attractiveness Analysis by Application
  • Figure 33: Latin America Market Value Share and BPS Analysis by Country, 2025 and 2035
  • Figure 34: Latin America Market Value Share and BPS Analysis by Source, 2025 and 2035
  • Figure 35: Latin America Market Y-o-Y Growth Comparison by Source, 2025-2035
  • Figure 36: Latin America Market Attractiveness Analysis by Source
  • Figure 37: Latin America Market Value Share and BPS Analysis by Sales Channel, 2025 and 2035
  • Figure 38: Latin America Market Y-o-Y Growth Comparison by Sales Channel, 2025-2035
  • Figure 39: Latin America Market Attractiveness Analysis by Sales Channel
  • Figure 40: Latin America Market Value Share and BPS Analysis by Application, 2025 and 2035
  • Figure 41: Latin America Market Y-o-Y Growth Comparison by Application, 2025-2035
  • Figure 42: Latin America Market Attractiveness Analysis by Application
  • Figure 43: Western Europe Market Value Share and BPS Analysis by Country, 2025 and 2035
  • Figure 44: Western Europe Market Value Share and BPS Analysis by Source, 2025 and 2035
  • Figure 45: Western Europe Market Y-o-Y Growth Comparison by Source, 2025-2035
  • Figure 46: Western Europe Market Attractiveness Analysis by Source
  • Figure 47: Western Europe Market Value Share and BPS Analysis by Sales Channel, 2025 and 2035
  • Figure 48: Western Europe Market Y-o-Y Growth Comparison by Sales Channel, 2025-2035
  • Figure 49: Western Europe Market Attractiveness Analysis by Sales Channel
  • Figure 50: Western Europe Market Value Share and BPS Analysis by Application, 2025 and 2035
  • Figure 51: Western Europe Market Y-o-Y Growth Comparison by Application, 2025-2035
  • Figure 52: Western Europe Market Attractiveness Analysis by Application
  • Figure 53: Eastern Europe Market Value Share and BPS Analysis by Country, 2025 and 2035
  • Figure 54: Eastern Europe Market Value Share and BPS Analysis by Source, 2025 and 2035
  • Figure 55: Eastern Europe Market Y-o-Y Growth Comparison by Source, 2025-2035
  • Figure 56: Eastern Europe Market Attractiveness Analysis by Source
  • Figure 57: Eastern Europe Market Value Share and BPS Analysis by Sales Channel, 2025 and 2035
  • Figure 58: Eastern Europe Market Y-o-Y Growth Comparison by Sales Channel, 2025-2035
  • Figure 59: Eastern Europe Market Attractiveness Analysis by Sales Channel
  • Figure 60: Eastern Europe Market Value Share and BPS Analysis by Application, 2025 and 2035
  • Figure 61: Eastern Europe Market Y-o-Y Growth Comparison by Application, 2025-2035
  • Figure 62: Eastern Europe Market Attractiveness Analysis by Application
  • Figure 63: East Asia Market Value Share and BPS Analysis by Country, 2025 and 2035
  • Figure 64: East Asia Market Value Share and BPS Analysis by Source, 2025 and 2035
  • Figure 65: East Asia Market Y-o-Y Growth Comparison by Source, 2025-2035
  • Figure 66: East Asia Market Attractiveness Analysis by Source
  • Figure 67: East Asia Market Value Share and BPS Analysis by Sales Channel, 2025 and 2035
  • Figure 68: East Asia Market Y-o-Y Growth Comparison by Sales Channel, 2025-2035
  • Figure 69: East Asia Market Attractiveness Analysis by Sales Channel
  • Figure 70: East Asia Market Value Share and BPS Analysis by Application, 2025 and 2035
  • Figure 71: East Asia Market Y-o-Y Growth Comparison by Application, 2025-2035
  • Figure 72: East Asia Market Attractiveness Analysis by Application
  • Figure 73: South Asia & Pacific Market Value Share and BPS Analysis by Country, 2025 and 2035
  • Figure 74: South Asia & Pacific Market Value Share and BPS Analysis by Source, 2025 and 2035
  • Figure 75: South Asia & Pacific Market Y-o-Y Growth Comparison by Source, 2025-2035
  • Figure 76: South Asia & Pacific Market Attractiveness Analysis by Source
  • Figure 77: South Asia & Pacific Market Value Share and BPS Analysis by Sales Channel, 2025 and 2035
  • Figure 78: South Asia & Pacific Market Y-o-Y Growth Comparison by Sales Channel, 2025-2035
  • Figure 79: South Asia & Pacific Market Attractiveness Analysis by Sales Channel
  • Figure 80: South Asia & Pacific Market Value Share and BPS Analysis by Application, 2025 and 2035
  • Figure 81: South Asia & Pacific Market Y-o-Y Growth Comparison by Application, 2025-2035
  • Figure 82: South Asia & Pacific Market Attractiveness Analysis by Application
  • Figure 83: Middle East and Africa Market Value Share and BPS Analysis by Country, 2025 and 2035
  • Figure 84: Middle East and Africa Market Value Share and BPS Analysis by Source, 2025 and 2035
  • Figure 85: Middle East and Africa Market Y-o-Y Growth Comparison by Source, 2025-2035
  • Figure 86: Middle East and Africa Market Attractiveness Analysis by Source
  • Figure 87: Middle East and Africa Market Value Share and BPS Analysis by Sales Channel, 2025 and 2035
  • Figure 88: Middle East and Africa Market Y-o-Y Growth Comparison by Sales Channel, 2025-2035
  • Figure 89: Middle East and Africa Market Attractiveness Analysis by Sales Channel
  • Figure 90: Middle East and Africa Market Value Share and BPS Analysis by Application, 2025 and 2035
  • Figure 91: Middle East and Africa Market Y-o-Y Growth Comparison by Application, 2025-2035
  • Figure 92: Middle East and Africa Market Attractiveness Analysis by Application
  • Figure 93: Global Market - Tier Structure Analysis
  • Figure 94: Global Market - Company Share Analysis

Frequently Asked Questions

What is the projected industry value of the fish collagen market in 2025?

The industry is projected to reach USD 1.61 billion in 2025.

What is the expected global CAGR for the fish collagen market from 2025 to 2035?

The industry is expected to grow at a CAGR of 6.1% from 2025 to 2035.

Which segment is expected to dominate the fish collagen market in 2025?

Nutraceuticals are expected to capture 52.4% in 2025.

Which region is forecasted to show significant growth in the fish collagen market by 2035?

South Asia & Pacific, led by India, is projected at 7.0% CAGR.

What is the forecasted industry value of the fish collagen market by 2035?

The industry is projected to reach USD 2.89 billion by 2035.

Explore Similar Insights

Future Market Insights

Fish Collagen Market

Chat With

MaRIA

Hi There, I am MaRIA, Your Market Research Intelligence Assistant. How may I help you?