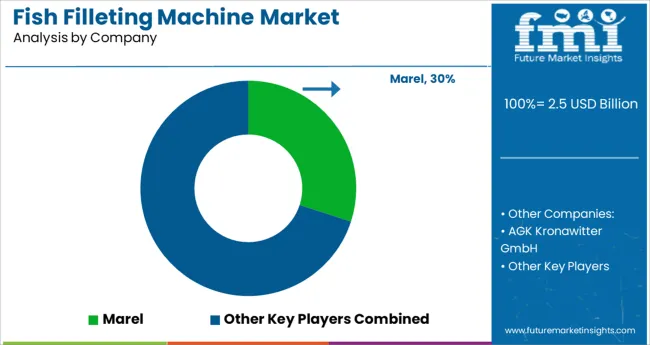
The Fish Filleting Machine Market is estimated to be valued at USD 2.5 billion in 2025 and is projected to reach USD 3.8 billion by 2035, registering a compound annual growth rate (CAGR) of 4.1% over the forecast period.
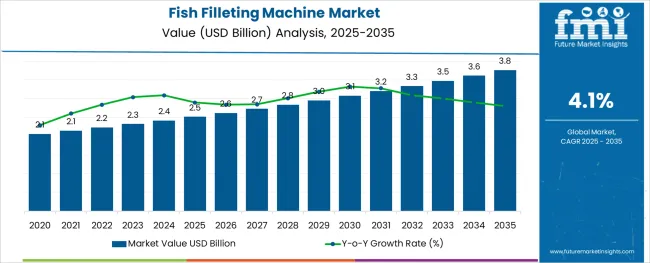
The fish filleting machine market is undergoing notable growth as seafood processing companies prioritize efficiency, hygiene, and yield optimization. Rising global demand for processed fish products combined with stricter food safety regulations has compelled manufacturers to adopt advanced filleting machinery.
Companies are increasingly moving away from manual operations toward mechanized solutions to improve productivity, reduce labor dependency, and maintain uniform product quality. Technological innovations focusing on precision cutting, minimal wastage, and easy-to-clean designs are paving the way for greater adoption across varying scales of operation.
The outlook remains positive as investments in automation and modernization within fisheries and seafood processing facilities are expected to create further opportunities for growth. Enhanced focus on worker safety, higher throughput needs, and consistent product standards continue to drive the transition toward more sophisticated filleting equipment.
The market is segmented by Machine Type, Operation, and Sales Channel and region. By Machine Type, the market is divided into Stand-alone System and Integrated System. In terms of Operation, the market is classified into Automatic and Semi-Automatic. Based on Sales Channel, the market is segmented into Direct Procurement, eCommerce Platforms, and Other Channels. Regionally, the market is classified into North America, Latin America, Western Europe, Eastern Europe, Balkan & Baltic Countries, Russia & Belarus, Central Asia, East Asia, South Asia & Pacific, and the Middle East & Africa.
The market is segmented by Machine Type, Operation, and Sales Channel and region. By Machine Type, the market is divided into Stand-alone System and Integrated System. In terms of Operation, the market is classified into Automatic and Semi-Automatic. Based on Sales Channel, the market is segmented into Direct Procurement, eCommerce Platforms, and Other Channels. Regionally, the market is classified into North America, Latin America, Western Europe, Eastern Europe, Balkan & Baltic Countries, Russia & Belarus, Central Asia, East Asia, South Asia & Pacific, and the Middle East & Africa.
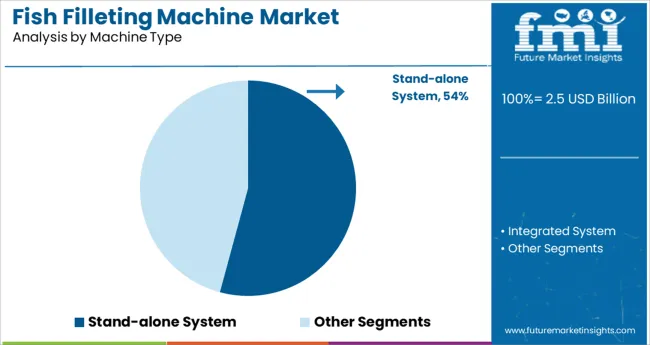
When segmented by machine type, the stand-alone system is estimated to hold 54.2% of the market revenue in 2025, marking it as the leading machine type segment. This leadership is attributed to its adaptability and ease of integration into existing processing lines without requiring extensive infrastructure changes.
The compact design and operational independence of stand-alone systems have made them particularly attractive to mid-sized processors seeking cost-effective modernization. Their ability to deliver precise cuts with minimal maintenance requirements has enhanced their appeal in facilities with limited space or mixed production lines.
The combination of lower capital investment and flexible deployment has solidified the preference for stand-alone systems among processors aiming for higher efficiency without large-scale overhauls. Such systems have effectively balanced affordability, reliability, and performance, reinforcing their dominance in the market.
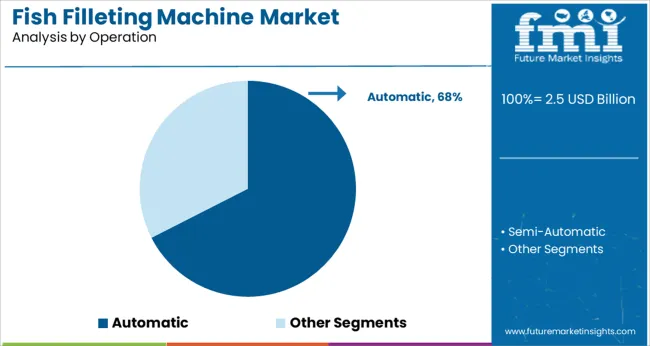
Segmented by operation, the automatic segment is projected to capture 67.5% of the market revenue in 2025, establishing itself as the top-performing segment. This strong position has been driven by the growing emphasis on reducing manual labor and ensuring consistent output quality.
Automatic machines have been adopted widely to mitigate labor shortages, enhance worker safety, and meet stringent hygiene standards in processing environments. Their capability to deliver high throughput with minimal human intervention has improved operational efficiency, reduced errors, and lowered contamination risks.
The ability to program specific cutting parameters and adapt to different fish species has further expanded their utility. Such advantages have positioned automatic machines as the preferred choice for processors looking to scale operations while maintaining stringent quality and safety benchmarks.
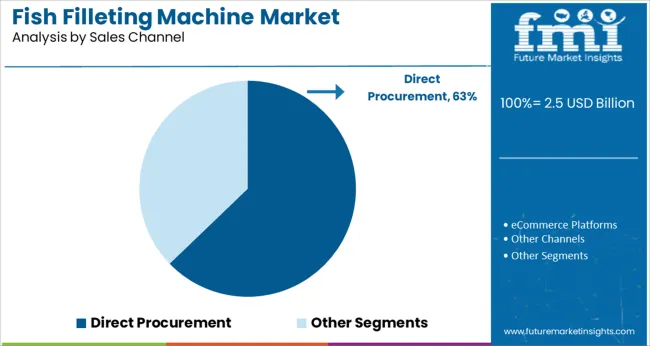
When analyzed by sales channel, direct procurement is forecast to account for 62.8% of the market revenue in 2025, securing its leadership among sales channels. This dominance has been supported by processors’ preference to engage directly with manufacturers for customized solutions, better after-sales support, and transparent negotiations.
Direct procurement has enabled buyers to specify technical requirements, receive tailored installation services, and ensure compatibility with their existing infrastructure. The close collaboration between end users and manufacturers has also facilitated better training, maintenance, and long-term support, which are critical for minimizing downtime in processing operations.
These benefits have reinforced direct procurement as the favored channel, particularly for large and mid-sized enterprises aiming to secure high-performance, reliable filleting solutions with ongoing technical assistance.
As per the analysis of FMI, the market has witnessed significant growth in the demand for filleting machines owing to several factors. There are technological advancements, rising consumer preference for processed fish products, and improved logistics.
The usage of fish filleting machines fillets the fish in a manner that maintains proper hygiene that is untouched by a human hand and is largely impacting the sale of the filleted fish product amongst consumers.
Furthermore, machine work imposes a lot of differences in the quality and physical aspects of the filleted fish, thereby the machines are expected to ensure better performance and earn substantial adoption in the food and beverage industry through the projection period.
| Report Attribute | Details |
|---|---|
| Fish Filleting Machine Market Value (2025) | USD 2,325 million |
| Fish Filleting Machine Market Anticipated Value (2035) | USD 3,470 million |
| Fish Filleting Machine Projected Growth Rate (2025 to 2035) | 4.1% |
After analyzing the market in-depth, the experts of FMI have unveiled that the fish filleting machine market has been witnessing an unprecedented surge in the past few years.
There is an approximate rise of USD 1,145 million surge in the total market value from 2025 to 2025. The market during the period 2020 to 2025 registered a CAGR of 2.9%.
The spike in sales of the industrial fish filleting machine can be attributed to factors like high performance, impeccable quality, and hygiene. It is witnessed that the fish filleting machine process offers great savings potential as there is a reduction of individual errors and material losses that are inevitable during handwork.
Furthermore, the expansion of the seafood processing plants in recent years has also created lucrative opportunities for the vendors to increase the sales of new units of dish filleting machines.
Besides this aspect, data analysts at FMI have identified an expansion of the aquaculture industry, where fishes are raised, nourished, and harvested in a controlled environment that has resulted in the reassurance of price solidity and higher farmed fish production, thereby impacting the market dynamics for multi-species fish filleting machines, owing to rise in consumption.
Stand-alone Fish Filleting Machine - By Machine Type
While analyzing the market in-depth, it has been identified that the stand-alone segment in the machine type category is likely to dominate the global forum of fish filleting machines. At present this segment is advancing at a moderate pace, registering a CAGR of 4.2% in 2025.
The segment accounted for a historical CAGR of 3.2% during the period of 2020 to 2025. The major aspects fueling the adoption of the stand-alone machine type are as follows:
Semi-automatic Filleting Machine - By Operation Type
FMI has analyzed that the semi-automatic filleting machine segment accounts for a major share in the global fish filleting machine market, based on the operation type category.
At present, this segment is advancing at a steady pace and is anticipated to record a CAGR of 3.8% during the projection period. The segment accounted for a sluggish growth rate of 2.6% in the past few years ranging from 2020 to 2025. The reasons contributing to the favorable adoption of these machines can be identified as follows:
| Country | United States |
|---|---|
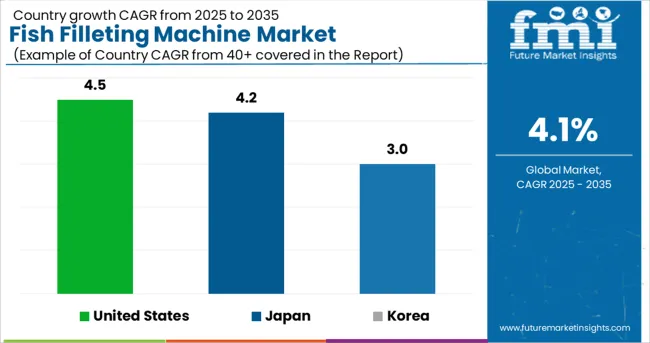
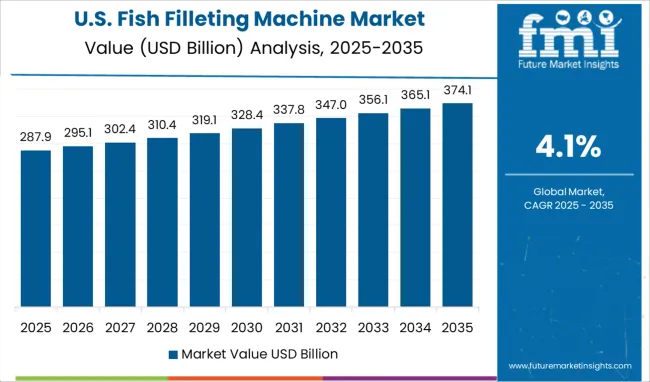
| Statistics | The USA is projected to dominate the fish filleting machine market in the North American region. The country is currently accountable for a market valuation of USD 2.5 Million in 2025. FMI predicts market valuation to surpass USD 3.8 Million by the end of 2035. The USA is progressing at a moderate pace, accruing a CAGR of 4.5% during the forecast period. Historical CAGR: 3.6% |
| Growth Propellants | Key elements fueling the market size of fish filleting machines in the USA are:
|
| Country | Japan |
|---|---|
| Statistics | The fish filleting market in Japan is estimated to have substantial growth during the period 2025 to 2035. The forum is currently accountable for a market valuation of USD 85.91 Million in 2025 and is anticipated to surpass a value of USD 253.31 Million by the end of 2035, registering a CAGR of 4.2% through the projection period. Historical CAGR: 2.9% |
| Growth Propellants | The aspects underlying the growth of the fish filleting machine market in Japan can be identified as the following:
|
| Country | Korea |
|---|---|
| Statistics | The Korean fish filleting machine market is anticipated to witness significant growth throughout the estimated study period. At present, the market is advancing at a CAGR of 3.0%, with a total market value of USD 30.775 Million in 2025. The market is projected to reach a high of USD 121.45 Million by the end of the projection period. Historical CAGR: 2.4% |
| Growth Propellants | The factors attributing to the growth of the market in Korea are:
|
New Entrants Transforming the Traditional Market-o-nomics
The new entrants in the fish filleting machine market are leveraging advancements in technology to launch new products and gain a competitive advantage.
These firms are continually investing in research and development activities to keep themselves in tandem with the changing consumer preferences and end-use industry demands. Efforts are being made to strengthen their foothold in the forum and aid the further progression of the rice processing machines market.
Top Start-Ups to Watch for
Mainali - European Start-up
This new entrant has introduced the RB-1 Smart Saw, which has been developed taking into account the needs of the market that demanded a solution to cut frozen products by weight in a precise and versatile way and with optimal performance.
The use of the equipment through the characteristic intuitive interface of Mainali’s equipment makes its use quick and easy for the operators, who only have to load the product and press a button.
The laser technology provides a precise reading of the piece, which will be cut into multiple portions with the weight previously indicated in the recipe.
The RB-1 Smart Saw stands out for being a mixed machine that allows, in addition to cutting by fixed weight, other options such as cutting by variable or fixed thickness in which the loading table can be loaded with multiple pieces in order to obtain maximum production, cutting both with the patented double cut system as with the simple one.
ABM Company S.r.l. - Italy-based Start-up
This start-up firm are specializing in semi-automatic fish filleting machines, with circular blades for high-precision cuttings. Their products have improved guide ridges for better running products and intuitive control panels. The company is identified to gain momentum in the global market.
Attempts of Key Market Players to Cede a Silver Lining to the Global Market
The market players from the filleting machines market are anticipated to have significant growth prospects in the forecast period owing to the rising demand for filleting fish products.
Various companies are focusing on their product line and the innovations in the product which will significantly boost the demand for filleting machines over the future period.
The market players are also substantially leveraging external market drivers such as increasing focus on preventing fish products from deteriorating to achieve growth opportunities.
Biggies Ease Fish Filleting and Jig Up the Trends
In recent years, FOODLOGISTIK Fleischereimaschinen GmbH, based out of Germany modified their slicing and portioning machine, which are custom designed for the particular needs of the end-user industries.
Their slicing machines enable large-volume cutting with user-friendly operation by single control keys and are installed with time-saving automatic return limiters. The operation mode of choice is continuous for high-volume cutting with a double blade or intermittent cutting with a single blade achieving precise slices.
Another company, NOCK Maschinenbau GmbH, has launched a cutting machine with a band blade for 1 horizontal cut and a circular blade cutting unit for vertical cuts, perfect for cutting fish fillets for sushi, thin escalope, and more.
Recent Developments
The global fish filleting machine market is estimated to be valued at USD 2.5 billion in 2025.
It is projected to reach USD 3.8 billion by 2035.
The market is expected to grow at a 4.1% CAGR between 2025 and 2035.
The key product types are stand-alone system and integrated system.
automatic segment is expected to dominate with a 67.5% industry share in 2025.


Our Research Products

The "Full Research Suite" delivers actionable market intel, deep dives on markets or technologies, so clients act faster, cut risk, and unlock growth.

The Leaderboard benchmarks and ranks top vendors, classifying them as Established Leaders, Leading Challengers, or Disruptors & Challengers.

Locates where complements amplify value and substitutes erode it, forecasting net impact by horizon

We deliver granular, decision-grade intel: market sizing, 5-year forecasts, pricing, adoption, usage, revenue, and operational KPIs—plus competitor tracking, regulation, and value chains—across 60 countries broadly.

Spot the shifts before they hit your P&L. We track inflection points, adoption curves, pricing moves, and ecosystem plays to show where demand is heading, why it is changing, and what to do next across high-growth markets and disruptive tech

Real-time reads of user behavior. We track shifting priorities, perceptions of today’s and next-gen services, and provider experience, then pace how fast tech moves from trial to adoption, blending buyer, consumer, and channel inputs with social signals (#WhySwitch, #UX).

Partner with our analyst team to build a custom report designed around your business priorities. From analysing market trends to assessing competitors or crafting bespoke datasets, we tailor insights to your needs.
Supplier Intelligence
Discovery & Profiling
Capacity & Footprint
Performance & Risk
Compliance & Governance
Commercial Readiness
Who Supplies Whom
Scorecards & Shortlists
Playbooks & Docs
Category Intelligence
Definition & Scope
Demand & Use Cases
Cost Drivers
Market Structure
Supply Chain Map
Trade & Policy
Operating Norms
Deliverables
Buyer Intelligence
Account Basics
Spend & Scope
Procurement Model
Vendor Requirements
Terms & Policies
Entry Strategy
Pain Points & Triggers
Outputs
Pricing Analysis
Benchmarks
Trends
Should-Cost
Indexation
Landed Cost
Commercial Terms
Deliverables
Brand Analysis
Positioning & Value Prop
Share & Presence
Customer Evidence
Go-to-Market
Digital & Reputation
Compliance & Trust
KPIs & Gaps
Outputs
Full Research Suite comprises of:
Market outlook & trends analysis
Interviews & case studies
Strategic recommendations
Vendor profiles & capabilities analysis
5-year forecasts
8 regions and 60+ country-level data splits
Market segment data splits
12 months of continuous data updates
DELIVERED AS:
PDF EXCEL ONLINE
Fish Pond Circulating Water Pump Filter Market Size and Share Forecast Outlook 2025 to 2035
Fish Hydrolysate Market Size and Share Forecast Outlook 2025 to 2035
Fish Protein Isolates Market Size and Share Forecast Outlook 2025 to 2035
Fish Meal Alternative Market Size and Share Forecast Outlook 2025 to 2035
Fish Oil Alternatives Market Size and Share Forecast Outlook 2025 to 2035
Fish Protein Concentrate Market Size and Share Forecast Outlook 2025 to 2035
Fish Fermentation Market Size and Share Forecast Outlook 2025 to 2035
Fishing Reels Market Analysis - Size, Share, and Forecast Outlook 2025 to 2035
Fish Processing Equipment Market Size and Share Forecast Outlook 2025 to 2035
Fish Protein Hydrolysate Market Size and Share Forecast Outlook 2025 to 2035
Fish Protein Hydrolysate For Animal Feed And Pet Food Applications Market Size and Share Forecast Outlook 2025 to 2035
Fishmeal and Fish Oil Market Analysis - Size, Share, and Forecast Outlook 2025 to 2035
Fish Feed Ingredients Market Analysis - Size, Share, and Forecast Outlook 2025 to 2035
Fish Collagen Market Analysis - Size, Share, and Forecast Outlook 2025 to 2035
Fish Bone Minerals Market Analysis - Size, Share, and Forecast Outlook 2025 to 2035
Fish Peptones Market Size, Growth, and Forecast for 2025 to 2035
Fish Nutrition Market Size, Growth, and Forecast for 2025 to 2035
Fish Oil Market Analysis - Size, Share, and Forecast Outlook 2025 to 2035
Fish Sauce Market Growth - Culinary Trends & Industry Demand 2025 to 2035
Fish Meal Market Analysis – Size, Share, and Forecast Outlook 2025 to 2035

Thank you!
You will receive an email from our Business Development Manager. Please be sure to check your SPAM/JUNK folder too.
Chat With
MaRIA