Fishmeal And Fish Oil Market Size and Share Forecast Outlook 2025 to 2035

The global fishmeal and fish oil market is projected to grow from USD 8.2 billion in 2025 to USD 16.9 billion by 2035, registering a CAGR of 7.5%.
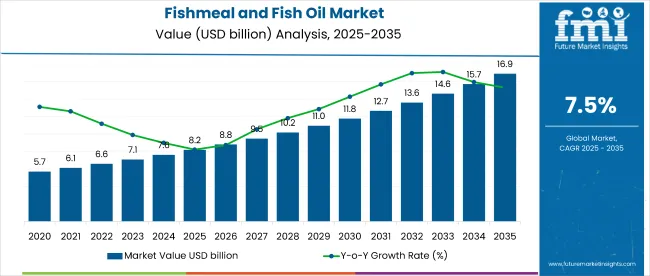
Quick Stats - Fishmeal and Fish Oil Market

  • Market Value (2025): USD 8.2 billion
  • Forecast Value (2035): USD 16.9 billion
  • Forecast CAGR: 7.5%
  • Source Leader in 2025: Marine Fish (38.5% market share)
  • Top Application Segment: Aquaculture & Aquatic Feeds (34.8% share)
  • Key Growth Region: East Asia (Japan is the fastest-growing market with a 6.1% CAGR)

Fishmeal And Fish Oil Market

Metric Value
Industry Size (2025E) USD 8.2 billion
Industry Value (2035F) USD 16.9 billion
CAGR (2025 to 2035) 7.5%

Growth in this market is being driven by rising global demand for sustainable protein sources, particularly in aquaculture and the dietary supplement industry. Fishmeal continues to play a vital role in animal nutrition due to its high digestibility and balanced amino acid profile, while fish oil is in growing demand as a source of omega-3s for human health.

The market holds an estimated 100% share in the marine-derived animal nutrition segment, reflecting its exclusive importance in high-performance animal feed. Within the aquaculture feed ingredients market, it commands approximately 35%, while contributing around 14% to the global omega-3 supplement market, and nearly 5% to the overall animal feed additives market. However, within the broader global food ingredients market, its share remains below 0.1%, reflecting its niche yet strategic role.

Regulatory influence stems from international feed safety standards and traceability frameworks. Certifications like IFFO RS and MSC guide sourcing and processing practices. Governments in China, the EU, and the USA support circular bioeconomy approaches using fish by-products. FAO guidelines and national aquaculture health protocols are directing demand toward consistent, high-grade fishmeal and oil.

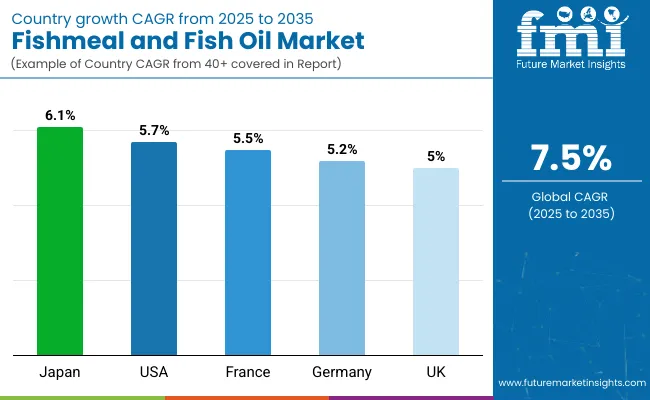
Japan is projected to be the fastest-growing market, expected to expand at a CAGR of 6.1% from 2025 to 2035. Marine fish will lead the source segment with a 38.5% share, while aquaculture & aquatic feeds will dominate the application segment with a 34.8% share. The USA and UK are also expected to grow steadily at CAGRs of 5.7% and 5%, respectively.

Fishmeal and Fish Oil Market Analysis by Top Investment Segments

The market is segmented by source, application, and region. By source, the market includes salmon & trout, marine fish, crustacean, tilapia, and carps. By application, the market is divided into aquaculture & aquatic feeds, land animal feeds and livestock, agriculture and fertilizers, pharmaceuticals, and dietary supplements. Regionally, the market is classified into North America, Latin America, Europe, East Asia, South Asia, Oceania, and the Middle East & Africa.
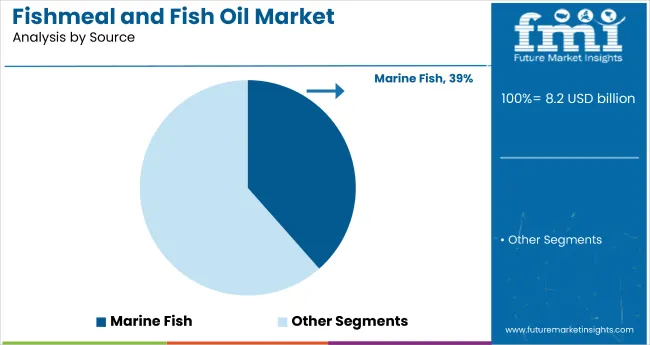
Marine Fish to Lead the Source Segment with 38.5% Market Share

Fishmeal And Fish Oil Market Analysis By Source

Marine fish are projected to capture 38.5% of the source segment by 2025 driven by their high protein content, omega-3 richness, and broad global availability, making them the preferred raw material for fishmeal and oil extraction.
  • Anchovy, sardine, and mackerel are key contributors.
  • Efficient to harvest and ideal for aquafeed and dietary applications.

Aquaculture & Aquatic Feeds to Lead the Application Segment with 34.8% Market Share

Fishmeal And Fish Oil Market Analysis By Application

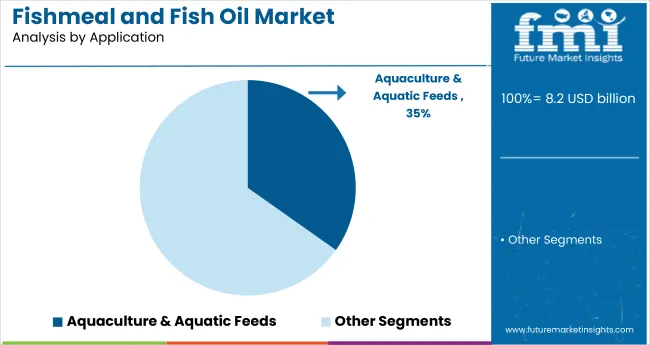
Aquaculture and aquatic feeds are projected to dominate the application segment with a 34.8% market share in 2025, driven by rising demand for nutrient-dense feed in commercial fish and shrimp farming.

  • Superior amino acid profile boosts aquatic growth and feed efficiency
  • Essential for salmon, tilapia, and shrimp health and productivity

Top Fishmeal and Fish Oil Market Dynamics

The global fishmeal and fish oil market is witnessing steady growth, driven by increasing demand for high-protein feed ingredients in aquaculture and livestock sectors. Fishmeal’s rich nutritional profile and functional benefits as a sustainable protein source are boosting its adoption in animal feed formulations worldwide. Additionally, rising awareness about the importance of quality feed for improving animal health and productivity supports market expansion.

Recent Trends in the Fishmeal and Fish Oil Market

  • Advancements in processing technologies such as wet pressing and dry rendering improve product quality and consistency.
  • Increasing focus on sustainable sourcing from marine species and fishery by-products to reduce environmental impact.

Challenges in the Fishmeal and Fish Oil Market
  • Fluctuating raw material supply caused by overfishing and regulatory restrictions leads to price volatility.
  • Competition from plant-based protein alternatives limits market growth in certain regions.

Top Countries Manufacturing, Distributing, Regulating, and Driving Demand for Fishmeal and Fish oil

Country Wise Analysis Of Fishmeal And Fish Oil Market

Japan shows the highest growth among OECD nations, driven by demand from aquaculture and livestock sectors adopting automation and incorporating plant-based alternatives into marine protein feeds. Domestic producers focus on nutrient-efficient systems and blended formulations to improve feed conversion ratios. Germany and France maintain stable demand under EU rules that favor clean-label inputs and certified sustainable sourcing. The USA is expected to expand at a 5.7% CAGR, supported by inland aquaculture and specialty applications in pet food and animal nutrition.

The UK follows at 5%, influenced by regulatory realignment and rising use of marine lipids in performance feeds. Germany grows at 5.2%, with innovation centered on organic livestock feed and circular aquafeed models. These five OECD countries are advancing at 0.85-1.05x the global average, supported by regulatory compliance, supply innovation, and targeted demand from evolving feed systems.

The report includes granular market data from 40+ countries; below are highlights from five top-performing OECD nations.

In-depth Analysis of Fishmeal and Fish Oil Demand in Japan

The Japan fishmeal and fish oil revenue is forecasted to grow at a CAGR of 6.1% from 2025 to 2035. Growth is supported by advanced aquaculture practices and feed innovations focused on sustainability and clean-label principles.

  • Advanced manufacturing ecosystems with automation and sustainability integration.
  • Preference for clean-label, plant-based feed blends.

Demand Trajectory for Fishmeal and Fish Oil in the USA

The USA fishmeal and fish oil market is projected to grow at 5.7% CAGR, driven by innovation in specialty feed formulations, pet food diversification, and large-scale consistency.

  • Focus on sustainability and specialty product development.
  • Large-scale processors driving consistency and customization.

Industrial Fishmeal and Fish Oil Demand in France

The French fishmeal and fish oil revenue is expected to expand at a 5.5% CAGR, benefiting from EU sustainability mandates and increasing demand for premium and organic feed products.

  • Innovation in organic fishmeal formats and sustainable packaging.
  • Growth in artisanal and gourmet feed segments.

Growth Outlook for Fishmeal and Fish Oil in Germany

The demand for fishmeal and fish oil is growing at 5.2% CAGR during the forecast period, backed by EU regulations on feed safety and increased adoption of organic and functional feed ingredients.

  • Strong regulatory compliance and clean-label feed formats.
  • Focus on vegetable-based and fiber-rich blends.

Fishmeal and Fish Oil Trends in the UK

The UK fishmeal and fish oil revenue is expected to grow at 5% CAGR, the slowest among the top five, supported by wellness-focused trends and feed regulation aimed at animal health.
  • Emphasis on low-impact, non-fried feed ingredients.
  • Regulatory support for healthy feed in livestock and aquaculture.

Leading Fishmeal Suppliers and Manufacturers

Fishmeal And Fish Oil Market Analysis By Company

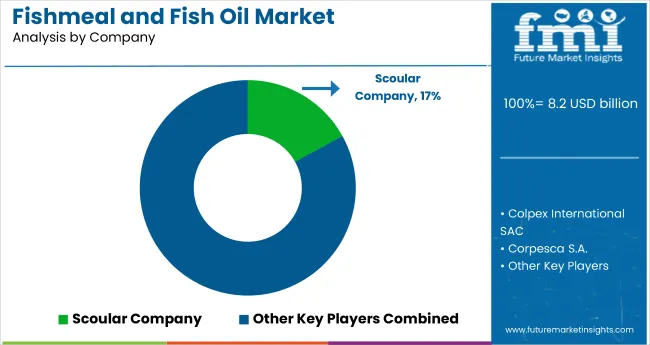
The market is moderately consolidated, with prominent players such as Scoular Company, Colpex International SAC, Corpesca S.A., Corporacion Pesquera Inca S.A.C., and Croda International PLC leading global production and supply. These companies offer a broad spectrum of fishmeal products tailored to aquaculture, livestock feed, and pet nutrition industries.

Scoular Company emphasizes sustainable sourcing and feed traceability, while Colpex International SAC specializes in premium-grade fishmeal derived from pelagic species. Corpesca S.A. and Corporacion Pesquera Inca S.A.C. are known for vertically integrated production processes ensuring quality and volume scalability. Croda International PLC, with its strong biotechnology orientation, delivers omega-rich feed supplements and marine-derived functional ingredients.

Fishmeal and Fish Oil Market Report Scope

Report Attributes Details
Market Size (2025) USD 8.2 billion
Projected Market Size (2035) USD 16.9 billion
CAGR (2025 to 2035) 7.5%
Base Year for Estimation 2024
Historical Period 2020 to 2024
Projections Period 2025 to 2035
Report Parameter USD billion for value/volume in metric tons
Source Analyzed Salmon & Trout, Marine Fish, Crustaceans, Tilapia, and Carps
Application Analyzed Aquaculture & Aquatic Feeds, Livestock & Land Animal Feeds, Agriculture & Fertilizers, Pharmaceuticals, and Dietary Supplements
Regions Covered North America, Latin America, Western Europe, Eastern Europe, Balkans & Baltic, Russia & Belarus, Central Asia, East Asia, South Asia & Pacific, Middle East & Africa
Countries Covered United States, United Kingdom, Germany, France, Japan, China, India, Brazil, South Korea, Australia
Key Players Influencing the Market Scoular Company, Colpex International SAC, Corpesca S.A., Corporacion Pesquera Inca S.A.C., Croda International PLC, Tasa, FMC Corporation, Gc Rieber Oil, Marvesa Holding NV, Mukka Sea Foods Industries Pvt. Ltd., Oceana Group Ltd., Omega Protein Corporation, Orizon S.A., Pesquera Exalmar S.A.A., Pioneer Fishing, SURSAN, Austevoll Seafood ASA, TripleNine Group A/S, FF Skagen A/S
Additional Attributes Dollar sales by equipment type, share by power, regional demand growth, policy influence, automation trends, competitive benchmarking

Segmentation

By Source:

In this segment Salmon & Trout, Marine Fish, Crustaceans, Tilapia, Carps are included in the report

By Application:

Various applications like Aquaculture & Aquatic Feeds, Land Animal Feeds and Livestock, Agriculture and Fertilizers, Pharmaceuticals, Dietary Supplements are considered in the report

By Region:

Industry analysis has been carried out in key countries of North America, Latin America, Europe, Middle East and Africa, East Asia, South Asia, and Oceania

Table of Content

  1. Executive Summary
    • Global Market Outlook
    • Demand-side Trends
    • Supply-side Trends
    • Technology Roadmap Analysis
    • Analysis and Recommendations
  2. Market Overview
    • Market Coverage / Taxonomy
    • Market Definition / Scope / Limitations
  3. Market Background
    • Market Dynamics
      • Drivers
      • Restraints
      • Opportunity
      • Trends
    • Scenario Forecast
      • Demand in Optimistic Scenario
      • Demand in Likely Scenario
      • Demand in Conservative Scenario
    • Opportunity Map Analysis
    • Product Life Cycle Analysis
    • Supply Chain Analysis
      • Supply Side Participants and their Roles
        • Producers
        • Mid-Level Participants (Traders/ Agents/ Brokers)
        • Wholesalers and Distributors
      • Value Added and Value Created at Node in the Supply Chain
      • List of Raw Material Suppliers
      • List of Existing and Potential Buyer’s
    • Investment Feasibility Matrix
    • Value Chain Analysis
      • Profit Margin Analysis
      • Wholesalers and Distributors
      • Retailers
    • PESTLE and Porter’s Analysis
    • Regulatory Landscape
      • By Key Regions
      • By Key Countries
    • Regional Parent Market Outlook
    • Production and Consumption Statistics
    • Import and Export Statistics
  4. Global Market Analysis 2020 to 2024 and Forecast, 2025 to 2035
    • Historical Market Size Value (USD Billion) & Volume (Metric Tons) Analysis, 2020 to 2024
    • Current and Future Market Size Value (USD Billion) & Volume (Metric Tons) Projections, 2025 to 2035
      • Y-o-Y Growth Trend Analysis
      • Absolute $ Opportunity Analysis
  5. Global Market Pricing Analysis 2020 to 2024 and Forecast 2025 to 2035
  6. Global Market Analysis 2020 to 2024 and Forecast 2025 to 2035, By Source
    • Introduction / Key Findings
    • Historical Market Size Value (USD Billion) & Volume (Metric Tons) Analysis By Source, 2020 to 2024
    • Current and Future Market Size Value (USD Billion) & Volume (Metric Tons) Analysis and Forecast By Source, 2025 to 2035
      • Salmon & Trout
      • Marine Fish
      • Crustacean
      • Tilapia
      • Carps
    • Y-o-Y Growth Trend Analysis By Source, 2020 to 2024
    • Absolute $ Opportunity Analysis By Source, 2025 to 2035
  7. Global Market Analysis 2020 to 2024 and Forecast 2025 to 2035, By Application
    • Introduction / Key Findings
    • Historical Market Size Value (USD Billion) & Volume (Metric Tons) Analysis By Application, 2020 to 2024
    • Current and Future Market Size Value (USD Billion) & Volume (Metric Tons) Analysis and Forecast By Application, 2025 to 2035
      • Aquaculture & Aquatic Feeds
      • Land Animal Feeds and Livestock, Agriculture and Fertilizers
      • Pharmaceuticals
      • Dietary Supplements
    • Y-o-Y Growth Trend Analysis By Application, 2020 to 2024
    • Absolute $ Opportunity Analysis By Application, 2025 to 2035
  8. Global Market Analysis 2020 to 2024 and Forecast 2025 to 2035, By Region
    • Introduction
    • Historical Market Size Value (USD Billion) & Volume (Metric Tons) Analysis By Region, 2020 to 2024
    • Current Market Size Value (USD Billion) & Volume (Metric Tons) Analysis and Forecast By Region, 2025 to 2035
      • North America
      • Latin America
      • Western Europe
      • Eastern Europe
      • East Asia
      • South Asia & Pacific
      • Middle East and Africa
    • Market Attractiveness Analysis By Region
  9. North America Market Analysis 2020 to 2024 and Forecast 2025 to 2035, By Country
    • Historical Market Size Value (USD Billion) & Volume (Metric Tons) Trend Analysis By Market Taxonomy, 2020 to 2024
    • Market Size Value (USD Billion) & Volume (Metric Tons) Forecast By Market Taxonomy, 2025 to 2035
      • By Country
        • USA
        • Canada
        • Mexico
      • By Source
      • By Application
    • Market Attractiveness Analysis
      • By Country
      • By Source
      • By Application
    • Key Takeaways
  10. Latin America Market Analysis 2020 to 2024 and Forecast 2025 to 2035, By Country
    • Historical Market Size Value (USD Billion) & Volume (Metric Tons) Trend Analysis By Market Taxonomy, 2020 to 2024
    • Market Size Value (USD Billion) & Volume (Metric Tons) Forecast By Market Taxonomy, 2025 to 2035
      • By Country
        • Brazil
        • Argentina
        • Rest of LATAM
      • By Source
      • By Application
    • Market Attractiveness Analysis
      • By Country
      • By Source
      • By Application
    • Key Takeaways
  11. Western Europe Market Analysis 2020 to 2024 and Forecast 2025 to 2035, By Country
    • Historical Market Size Value (USD Billion) & Volume (Metric Tons) Trend Analysis By Market Taxonomy, 2020 to 2024
    • Market Size Value (USD Billion) & Volume (Metric Tons) Forecast By Market Taxonomy, 2025 to 2035
      • By Country
        • Germany
        • Italy
        • France
        • UK
        • Spain
        • BENELUX
        • Nordic
        • Rest of W.Europe
      • By Source
      • By Application
    • Market Attractiveness Analysis
      • By Country
      • By Source
      • By Application
    • Key Takeaways
  12. Eastern Europe Market Analysis 2020 to 2024 and Forecast 2025 to 2035, By Country
    • Historical Market Size Value (USD Billion) & Volume (Metric Tons) Trend Analysis By Market Taxonomy, 2020 to 2024
    • Market Size Value (USD Billion) & Volume (Metric Tons) Forecast By Market Taxonomy, 2025 to 2035
      • By Country
        • Russia
        • Hungary
        • Poland
        • Balkan & Baltics
        • Rest of E. Europe
      • By Source
      • By Application
    • Market Attractiveness Analysis
      • By Country
      • By Source
      • By Application
    • Key Takeaways
  13. East Asia Market Analysis 2020 to 2024 and Forecast 2025 to 2035, By Country
    • Historical Market Size Value (USD Billion) & Volume (Metric Tons) Trend Analysis By Market Taxonomy, 2020 to 2024
    • Market Size Value (USD Billion) & Volume (Metric Tons) Forecast By Market Taxonomy, 2025 to 2035
      • By Country
        • China
        • Japan
        • South Korea
      • By Source
      • By Application
    • Market Attractiveness Analysis
      • By Country
      • By Source
      • By Application
    • Key Takeaways
  14. South Asia & Pacific Market Analysis 2020 to 2024 and Forecast 2025 to 2035, By Country
    • Historical Market Size Value (USD Billion) & Volume (Metric Tons) Trend Analysis By Market Taxonomy, 2020 to 2024
    • Market Size Value (USD Billion) & Volume (Metric Tons) Forecast By Market Taxonomy, 2025 to 2035
      • By Country
        • India
        • Australia & New Zealand
        • ASEAN
        • Rest of SAP
      • By Source
      • By Application
    • Market Attractiveness Analysis
      • By Country
      • By Source
      • By Application
    • Key Takeaways
  15. Middle East and Africa Market Analysis 2020 to 2024 and Forecast 2025 to 2035, By Country
    • Historical Market Size Value (USD Billion) & Volume (Metric Tons) Trend Analysis By Market Taxonomy, 2020 to 2024
    • Market Size Value (USD Billion) & Volume (Metric Tons) Forecast By Market Taxonomy, 2025 to 2035
      • By Country
        • GCC Countries
        • Northern Africa
        • South Africa
        • Turkiye
        • Rest of MEA
      • By Source
      • By Application
    • Market Attractiveness Analysis
      • By Country
      • By Source
      • By Application
    • Key Takeaways
  16. Key Countries Market Analysis
    • USA
      • Pricing Analysis
      • Market Share Analysis, 2024
        • By Source
        • By Application
    • Canada
      • Pricing Analysis
      • Market Share Analysis, 2024
        • By Source
        • By Application
    • Brazil
      • Pricing Analysis
      • Market Share Analysis, 2024
        • By Source
        • By Application
    • Mexico
      • Pricing Analysis
      • Market Share Analysis, 2024
        • By Source
        • By Application
    • Argentina
      • Pricing Analysis
      • Market Share Analysis, 2024
        • By Source
        • By Application
  17. Market Structure Analysis
    • Competition Dashboard
    • Competition Benchmarking
    • Market Share Analysis of Top Players
      • By Regional
      • By Source
      • By Application
  18. Competition Analysis
    • Competition Deep Dive
      • Scoular Company
        • Overview
        • Product Portfolio
        • Profitability by Market Segments (Product/Age /Sales Channel/Region)
        • Sales Footprint
        • Strategy Overview
          • Marketing Strategy
          • Product Strategy
          • Channel Strategy
      • Colpex International SAC
        • Overview
        • Product Portfolio
        • Profitability by Market Segments (Product/Age /Sales Channel/Region)
        • Sales Footprint
        • Strategy Overview
          • Marketing Strategy
          • Product Strategy
          • Channel Strategy
      • Corpesca S.A.
        • Overview
        • Product Portfolio
        • Profitability by Market Segments (Product/Age /Sales Channel/Region)
        • Sales Footprint
        • Strategy Overview
          • Marketing Strategy
          • Product Strategy
          • Channel Strategy
      • Corporacion Pesquera Inca S.A.C.
        • Overview
        • Product Portfolio
        • Profitability by Market Segments (Product/Age /Sales Channel/Region)
        • Sales Footprint
        • Strategy Overview
          • Marketing Strategy
          • Product Strategy
          • Channel Strategy
      • Croda International PLC
        • Overview
        • Product Portfolio
        • Profitability by Market Segments (Product/Age /Sales Channel/Region)
        • Sales Footprint
        • Strategy Overview
          • Marketing Strategy
          • Product Strategy
          • Channel Strategy
      • Tasa
        • Overview
        • Product Portfolio
        • Profitability by Market Segments (Product/Age /Sales Channel/Region)
        • Sales Footprint
        • Strategy Overview
          • Marketing Strategy
          • Product Strategy
          • Channel Strategy
      • FMC Corporation
        • Overview
        • Product Portfolio
        • Profitability by Market Segments (Product/Age /Sales Channel/Region)
        • Sales Footprint
        • Strategy Overview
          • Marketing Strategy
          • Product Strategy
          • Channel Strategy
      • Gc Rieber Oil
        • Overview
        • Product Portfolio
        • Profitability by Market Segments (Product/Age /Sales Channel/Region)
        • Sales Footprint
        • Strategy Overview
          • Marketing Strategy
          • Product Strategy
          • Channel Strategy
      • Marvesa Holding NV
        • Overview
        • Product Portfolio
        • Profitability by Market Segments (Product/Age /Sales Channel/Region)
        • Sales Footprint
        • Strategy Overview
          • Marketing Strategy
          • Product Strategy
          • Channel Strategy
      • Mukka Sea Foods Industries Pvt. Ltd.
        • Overview
        • Product Portfolio
        • Profitability by Market Segments (Product/Age /Sales Channel/Region)
        • Sales Footprint
        • Strategy Overview
          • Marketing Strategy
          • Product Strategy
          • Channel Strategy
      • Oceana Group Ltd.
        • Overview
        • Product Portfolio
        • Profitability by Market Segments (Product/Age /Sales Channel/Region)
        • Sales Footprint
        • Strategy Overview
          • Marketing Strategy
          • Product Strategy
          • Channel Strategy
      • Omega Protein Corporation
        • Overview
        • Product Portfolio
        • Profitability by Market Segments (Product/Age /Sales Channel/Region)
        • Sales Footprint
        • Strategy Overview
          • Marketing Strategy
          • Product Strategy
          • Channel Strategy
      • Orizon S.A.
        • Overview
        • Product Portfolio
        • Profitability by Market Segments (Product/Age /Sales Channel/Region)
        • Sales Footprint
        • Strategy Overview
          • Marketing Strategy
          • Product Strategy
          • Channel Strategy
      • Pesquera Exalmar S.A.A.
        • Overview
        • Product Portfolio
        • Profitability by Market Segments (Product/Age /Sales Channel/Region)
        • Sales Footprint
        • Strategy Overview
          • Marketing Strategy
          • Product Strategy
          • Channel Strategy
      • Pioneer Fishing
        • Overview
        • Product Portfolio
        • Profitability by Market Segments (Product/Age /Sales Channel/Region)
        • Sales Footprint
        • Strategy Overview
          • Marketing Strategy
          • Product Strategy
          • Channel Strategy
      • SURSAN
        • Overview
        • Product Portfolio
        • Profitability by Market Segments (Product/Age /Sales Channel/Region)
        • Sales Footprint
        • Strategy Overview
          • Marketing Strategy
          • Product Strategy
          • Channel Strategy
      • Austevoll Seafood ASA
        • Overview
        • Product Portfolio
        • Profitability by Market Segments (Product/Age /Sales Channel/Region)
        • Sales Footprint
        • Strategy Overview
          • Marketing Strategy
          • Product Strategy
          • Channel Strategy
      • TripleNine Group A/S
        • Overview
        • Product Portfolio
        • Profitability by Market Segments (Product/Age /Sales Channel/Region)
        • Sales Footprint
        • Strategy Overview
          • Marketing Strategy
          • Product Strategy
          • Channel Strategy
      • FF Skagen A/S
        • Overview
        • Product Portfolio
        • Profitability by Market Segments (Product/Age /Sales Channel/Region)
        • Sales Footprint
        • Strategy Overview
          • Marketing Strategy
          • Product Strategy
          • Channel Strategy
  19. Assumptions & Acronyms Used
  20. Research Methodology

List of Tables

  • Table 1: Global Market Value (USD Billion) Forecast by Region, 2020 to 2035
  • Table 2: Global Market Volume (Metric Tons) Forecast by Region, 2020 to 2035
  • Table 3: Global Market Value (USD Billion) Forecast by Source, 2020 to 2035
  • Table 4: Global Market Volume (Metric Tons) Forecast by Source, 2020 to 2035
  • Table 5: Global Market Value (USD Billion) Forecast by Application, 2020 to 2035
  • Table 6: Global Market Volume (Metric Tons) Forecast by Application, 2020 to 2035
  • Table 7: North America Market Value (USD Billion) Forecast by Country, 2020 to 2035
  • Table 8: North America Market Volume (Metric Tons) Forecast by Country, 2020 to 2035
  • Table 9: North America Market Value (USD Billion) Forecast by Source, 2020 to 2035
  • Table 10: North America Market Volume (Metric Tons) Forecast by Source, 2020 to 2035
  • Table 11: North America Market Value (USD Billion) Forecast by Application, 2020 to 2035
  • Table 12: North America Market Volume (Metric Tons) Forecast by Application, 2020 to 2035
  • Table 13: Latin America Market Value (USD Billion) Forecast by Country, 2020 to 2035
  • Table 14: Latin America Market Volume (Metric Tons) Forecast by Country, 2020 to 2035
  • Table 15: Latin America Market Value (USD Billion) Forecast by Source, 2020 to 2035
  • Table 16: Latin America Market Volume (Metric Tons) Forecast by Source, 2020 to 2035
  • Table 17: Latin America Market Value (USD Billion) Forecast by Application, 2020 to 2035
  • Table 18: Latin America Market Volume (Metric Tons) Forecast by Application, 2020 to 2035
  • Table 19: Western Europe Market Value (USD Billion) Forecast by Country, 2020 to 2035
  • Table 20: Western Europe Market Volume (Metric Tons) Forecast by Country, 2020 to 2035
  • Table 21: Western Europe Market Value (USD Billion) Forecast by Source, 2020 to 2035
  • Table 22: Western Europe Market Volume (Metric Tons) Forecast by Source, 2020 to 2035
  • Table 23: Western Europe Market Value (USD Billion) Forecast by Application, 2020 to 2035
  • Table 24: Western Europe Market Volume (Metric Tons) Forecast by Application, 2020 to 2035
  • Table 25: Eastern Europe Market Value (USD Billion) Forecast by Country, 2020 to 2035
  • Table 26: Eastern Europe Market Volume (Metric Tons) Forecast by Country, 2020 to 2035
  • Table 27: Eastern Europe Market Value (USD Billion) Forecast by Source, 2020 to 2035
  • Table 28: Eastern Europe Market Volume (Metric Tons) Forecast by Source, 2020 to 2035
  • Table 29: Eastern Europe Market Value (USD Billion) Forecast by Application, 2020 to 2035
  • Table 30: Eastern Europe Market Volume (Metric Tons) Forecast by Application, 2020 to 2035
  • Table 31: East Asia Market Value (USD Billion) Forecast by Country, 2020 to 2035
  • Table 32: East Asia Market Volume (Metric Tons) Forecast by Country, 2020 to 2035
  • Table 33: East Asia Market Value (USD Billion) Forecast by Source, 2020 to 2035
  • Table 34: East Asia Market Volume (Metric Tons) Forecast by Source, 2020 to 2035
  • Table 35: East Asia Market Value (USD Billion) Forecast by Application, 2020 to 2035
  • Table 36: East Asia Market Volume (Metric Tons) Forecast by Application, 2020 to 2035
  • Table 37: South Asia & Pacific Market Value (USD Billion) Forecast by Country, 2020 to 2035
  • Table 38: South Asia & Pacific Market Volume (Metric Tons) Forecast by Country, 2020 to 2035
  • Table 39: South Asia & Pacific Market Value (USD Billion) Forecast by Source, 2020 to 2035
  • Table 40: South Asia & Pacific Market Volume (Metric Tons) Forecast by Source, 2020 to 2035
  • Table 41: South Asia & Pacific Market Value (USD Billion) Forecast by Application, 2020 to 2035
  • Table 42: South Asia & Pacific Market Volume (Metric Tons) Forecast by Application, 2020 to 2035
  • Table 43: Middle East and Africa Market Value (USD Billion) Forecast by Country, 2020 to 2035
  • Table 44: Middle East and Africa Market Volume (Metric Tons) Forecast by Country, 2020 to 2035
  • Table 45: Middle East and Africa Market Value (USD Billion) Forecast by Source, 2020 to 2035
  • Table 46: Middle East and Africa Market Volume (Metric Tons) Forecast by Source, 2020 to 2035
  • Table 47: Middle East and Africa Market Value (USD Billion) Forecast by Application, 2020 to 2035
  • Table 48: Middle East and Africa Market Volume (Metric Tons) Forecast by Application, 2020 to 2035

List of Figures

  • Figure 1: Global Market Volume (Metric Tons) Forecast 2020 to 2035
  • Figure 2: Global Market Pricing Analysis
  • Figure 3: Global Market Value (USD Billion) Forecast 2020 to 2035
  • Figure 4: Global Market Value Share and BPS Analysis by Source, 2025 and 2035
  • Figure 5: Global Market Y-o-Y Growth Comparison by Source, 2025 to 2035
  • Figure 6: Global Market Attractiveness Analysis by Source
  • Figure 7: Global Market Value Share and BPS Analysis by Application, 2025 and 2035
  • Figure 8: Global Market Y-o-Y Growth Comparison by Application, 2025 to 2035
  • Figure 9: Global Market Attractiveness Analysis by Application
  • Figure 10: Global Market Value (USD Billion) Share and BPS Analysis by Region, 2025 and 2035
  • Figure 11: Global Market Y-o-Y Growth Comparison by Region, 2025 to 2035
  • Figure 12: Global Market Attractiveness Analysis by Region
  • Figure 13: North America Market Incremental $ Opportunity, 2025 to 2035
  • Figure 14: Latin America Market Incremental $ Opportunity, 2025 to 2035
  • Figure 15: Western Europe Market Incremental $ Opportunity, 2025 to 2035
  • Figure 16: Eastern Europe Market Incremental $ Opportunity, 2025 to 2035
  • Figure 17: East Asia Market Incremental $ Opportunity, 2025 to 2035
  • Figure 18: South Asia & Pacific Market Incremental $ Opportunity, 2025 to 2035
  • Figure 19: Middle East and Africa Market Incremental $ Opportunity, 2025 to 2035
  • Figure 20: North America Market Value Share and BPS Analysis by Country, 2025 and 2035
  • Figure 21: North America Market Value Share and BPS Analysis by Source, 2025 and 2035
  • Figure 22: North America Market Y-o-Y Growth Comparison by Source, 2025 to 2035
  • Figure 23: North America Market Attractiveness Analysis by Source
  • Figure 24: North America Market Value Share and BPS Analysis by Application, 2025 and 2035
  • Figure 25: North America Market Y-o-Y Growth Comparison by Application, 2025 to 2035
  • Figure 26: North America Market Attractiveness Analysis by Application
  • Figure 27: Latin America Market Value Share and BPS Analysis by Country, 2025 and 2035
  • Figure 28: Latin America Market Value Share and BPS Analysis by Source, 2025 and 2035
  • Figure 29: Latin America Market Y-o-Y Growth Comparison by Source, 2025 to 2035
  • Figure 30: Latin America Market Attractiveness Analysis by Source
  • Figure 31: Latin America Market Value Share and BPS Analysis by Application, 2025 and 2035
  • Figure 32: Latin America Market Y-o-Y Growth Comparison by Application, 2025 to 2035
  • Figure 33: Latin America Market Attractiveness Analysis by Application
  • Figure 34: Western Europe Market Value Share and BPS Analysis by Country, 2025 and 2035
  • Figure 35: Western Europe Market Value Share and BPS Analysis by Source, 2025 and 2035
  • Figure 36: Western Europe Market Y-o-Y Growth Comparison by Source, 2025 to 2035
  • Figure 37: Western Europe Market Attractiveness Analysis by Source
  • Figure 38: Western Europe Market Value Share and BPS Analysis by Application, 2025 and 2035
  • Figure 39: Western Europe Market Y-o-Y Growth Comparison by Application, 2025 to 2035
  • Figure 40: Western Europe Market Attractiveness Analysis by Application
  • Figure 41: Eastern Europe Market Value Share and BPS Analysis by Country, 2025 and 2035
  • Figure 42: Eastern Europe Market Value Share and BPS Analysis by Source, 2025 and 2035
  • Figure 43: Eastern Europe Market Y-o-Y Growth Comparison by Source, 2025 to 2035
  • Figure 44: Eastern Europe Market Attractiveness Analysis by Source
  • Figure 45: Eastern Europe Market Value Share and BPS Analysis by Application, 2025 and 2035
  • Figure 46: Eastern Europe Market Y-o-Y Growth Comparison by Application, 2025 to 2035
  • Figure 47: Eastern Europe Market Attractiveness Analysis by Application
  • Figure 48: East Asia Market Value Share and BPS Analysis by Country, 2025 and 2035
  • Figure 49: East Asia Market Value Share and BPS Analysis by Source, 2025 and 2035
  • Figure 50: East Asia Market Y-o-Y Growth Comparison by Source, 2025 to 2035
  • Figure 51: East Asia Market Attractiveness Analysis by Source
  • Figure 52: East Asia Market Value Share and BPS Analysis by Application, 2025 and 2035
  • Figure 53: East Asia Market Y-o-Y Growth Comparison by Application, 2025 to 2035
  • Figure 54: East Asia Market Attractiveness Analysis by Application
  • Figure 55: South Asia & Pacific Market Value Share and BPS Analysis by Country, 2025 and 2035
  • Figure 56: South Asia & Pacific Market Value Share and BPS Analysis by Source, 2025 and 2035
  • Figure 57: South Asia & Pacific Market Y-o-Y Growth Comparison by Source, 2025 to 2035
  • Figure 58: South Asia & Pacific Market Attractiveness Analysis by Source
  • Figure 59: South Asia & Pacific Market Value Share and BPS Analysis by Application, 2025 and 2035
  • Figure 60: South Asia & Pacific Market Y-o-Y Growth Comparison by Application, 2025 to 2035
  • Figure 61: South Asia & Pacific Market Attractiveness Analysis by Application
  • Figure 62: Middle East and Africa Market Value Share and BPS Analysis by Country, 2025 and 2035
  • Figure 63: Middle East and Africa Market Value Share and BPS Analysis by Source, 2025 and 2035
  • Figure 64: Middle East and Africa Market Y-o-Y Growth Comparison by Source, 2025 to 2035
  • Figure 65: Middle East and Africa Market Attractiveness Analysis by Source
  • Figure 66: Middle East and Africa Market Value Share and BPS Analysis by Application, 2025 and 2035
  • Figure 67: Middle East and Africa Market Y-o-Y Growth Comparison by Application, 2025 to 2035
  • Figure 68: Middle East and Africa Market Attractiveness Analysis by Application
  • Figure 69: Global Market - Tier Structure Analysis
  • Figure 70: Global Market - Company Share Analysis

Frequently Asked Questions

What is the projected size of the fishmeal and fish oil market in 2025?

The market is valued at USD 8.2 billion in 2025.

What is the outlook on fishmeal and fish oil demand by 2035?

The market is forecasted to reach USD 16.9 billion by 2035, reflecting a CAGR of 7.5%.

Which segment leads the fishmeal and fish oil market by source in 2025?

Marine fish will lead the source segment, accounting for 38.5% of the global market share in 2025.

What is the top application sector for the fishmeal and fish oil market in 2025?

Aquaculture and aquatic feeds will dominate the application segment with a 34.8% share in 2025.

Which country is projected to have the fastest-growing fishmeal and fish oil market?

Japan is projected to grow at the fastest rate, with a CAGR of 6.1% from 2025 to 2035.

Explore Similar Insights

Future Market Insights

Fishmeal And Fish Oil Market