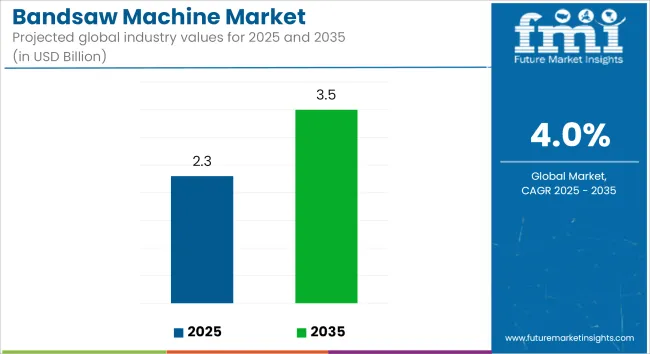
The global bandsaw machines market is estimated to generate sales of USD 2.3 billion in 2025 and is projected to reach approximately USD 3.5 billion by 2035, registering a compound annual growth rate (CAGR) of 4% during the forecast period. Steady demand has been observed from the metalworking, construction equipment, and heavy manufacturing sectors, where precision cutting of large workpieces is routinely required.
Product advancements in 2024 and 2025 have continued to center around automation, blade technology, and energy efficiency. Cosen Saws, a manufacturer of industrial cutting equipment, launched its CNC-530 high-production horizontal bandsaw.
This model was developed for demanding structural steel applications and includes programmable logic control (PLC), automatic material feed, and enhanced blade life monitoring systems. These upgrades were introduced to reduce manual intervention while improving production consistency for high-volume users such as steel fabricators and OEM suppliers.
The vertical bandsaw segment has also seen innovation tailored to small and mid-sized operations. Grizzly Industrial announced the release of its 14" Vertical Metal-Cutting Bandsaw, which incorporates dual-speed settings and variable pitch blade compatibility.
The model was designed to meet performance demands for toolrooms, educational labs, and low-to-medium throughput machining environments. According to Grizzly’s product development team, emphasis has been placed on enhancing rigidity and thermal management for prolonged cutting accuracy under repeated operation cycles.
Metric | Value |
---|---|
Market Size (2025E) | USD 2.3 Billion |
Market Value (2035F) | USD 3.5 Billion |
CAGR (2025 to 2035) | 4% |
Blade technology remains a focus area for competitive differentiation. In 2024, WIKUS introduced a new line of bimetal bandsaw blades under the PRIMAR® M42 product category. These blades were engineered to offer improved tooth geometry and reduced vibration during segmented cutting operations, addressing end-user requirements for extended tool life and enhanced surface finish quality. According to WIKUS, such products are being positioned for use in machine shops transitioning toward digital workflow automation and predictive maintenance schedules.
Demand growth is being supported by infrastructure development, industrial automation, and maintenance-heavy applications where precise cutting of hardened materials is necessary. Integration of digital control units and machine learning algorithms for blade wear prediction has begun to shape the R&D pipeline for global manufacturers.
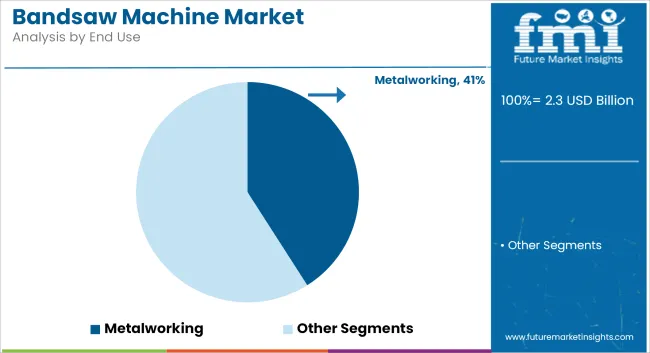
The metalworking segment is estimated to account for approximately 41% of the global bandsaw machines market share in 2025 and is projected to grow at a CAGR of 4.2% through 2035. Demand is driven by the widespread use of bandsaw machines for cutting steel, aluminum, and alloy billets in industrial workshops, tool rooms, and metal processing plants.
These machines offer high precision, clean cutting surfaces, and versatility in handling various profiles such as pipes, beams, and sheets. Manufacturers in sectors like shipbuilding, aerospace, and metal component manufacturing continue to invest in horizontal and vertical bandsaws to improve cutting efficiency and reduce material waste. Technological advancements such as automatic feed systems, servo-driven motors, and carbide-tipped blades further enhance productivity and user safety in metalworking operations.
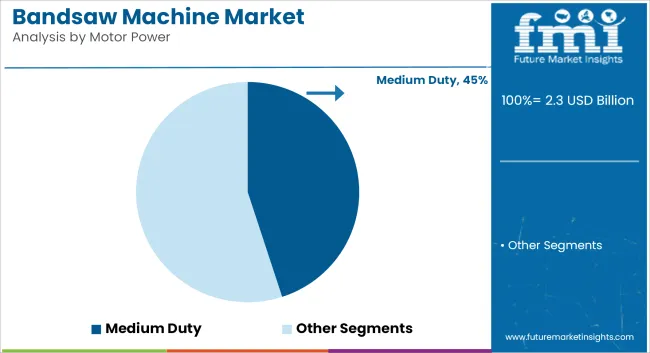
Medium duty machines are projected to hold approximately 45% of the global bandsaw machines market in 2025 and are expected to grow at a CAGR of 4.1% through 2035. These machines offer a balanced combination of cutting capacity, operating speed, and durability, making them suitable for diverse applications in fabrication shops, furniture production, automotive workshops, and general-purpose manufacturing.
With growing demand from small- and mid-sized enterprises, medium duty bandsaws continue to serve as the standard solution for both ferrous and non-ferrous material cutting. Manufacturers are enhancing machine ergonomics, blade tensioning systems, and cutting automation to cater to the evolving requirements of semi-automated industrial environments. As infrastructure development and industrial machining expand globally, medium duty segments remain the go-to option for versatile and reliable cutting operations.
Challenges
Opportunities
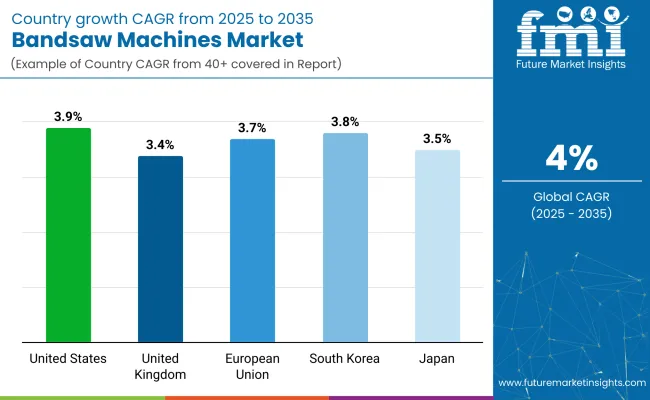
The growth of the bandsaw machines market in the United States is driven by increasing demand from the metalworking, woodworking, and automotive industries. The surging demand for cutting precision in industrial manufacturing, combined with rapid development of automation, drives the market growth substantially. Additionally, the increasing use of CNC-controlled bandsaw machines in mass production plants is improving operational efficiency and minimizing material waste.
Demand comes most prominently from the metal fabrication industry, notably aerospace and defence. Security in the United States has been tight, and the USA has been investing in its defence sector, so manufacturers need advanced bandsaw machines to handle high-strength alloys and complex cuts. Moreover, the trend for lightweight automotive components has helped propel the demand for high-precision cutting tools in the automobile sector.
Market dynamics are also being influenced by sustainability trends. Demand for machinery that is energy efficient as well as being equipped with advanced safety features in industrial equipment has compelled manufacturers to launch bandsaws that offer enhanced blade longevity, less heat generation as well as optimized cutting speeds.
Country | CAGR (2025 to 2035) |
---|---|
USA | 3.9% |
The UK bandsaw machines market is witnessing growth owing to the growing demand from the construction, metalworking, and aerospace industries. A strong emphasis on precision engineering, along with a shift to automation, are spurring market growth in the country. Also, the UK government has joint safety and efficiency regulations that are promoting industries to enrich their cutting tools using advanced technologies.
The growth of the aerospace industry is one of the key drivers impacting the market. There are major manufacturers of aerospace in the UK, and high-precision metal cutting tools remain in demand. Their demand is being led by the construction sector, which is supported by government investments on infrastructures to provide high performance bandsaws utilized for cutting steel, concrete and different building materials.
Trends around sustainability and the transition to low-carbon manufacturing are also changing the industry. Businesses are sourcing new energy-efficient bandsaws with lower noise and vibration. High-durability bandsaws are also seeing increased demand as recycling and scrap metal processing becomes more valuable.
Country | CAGR (2025 to 2035) |
---|---|
UK | 3.4% |
Styling of bandsaw machines in the European Union Severing of Frozen Food bandsaw machines in the European Union European marketplace for bandsaw machines is gaining momentum owing to an uptrend in demand from automotive, construction and industrial manufacturing sectors. Germany, France, and Italy lead in high-accuracy cutting solutions, due to their robust industrial bases. High adherence to safety regulations in the region REACH and CE directives and the desire for sustainable manufacturing are major factors influencing the market.
Trends like Industry 4.0 technology adoption are reshaping the bandsaw market as companies incorporate artificial intelligence-based diagnostics and predictive maintenance systems into their devices. From green manufacturing there has been an increased focus in energy efficient and noise reducing bandsaws.
In the automotive sector, the EU’s ambitious shift in focus toward electric vehicle (EV) production has spurred demand for lightweight materials including aluminium and composites, which in turn is propelling demand for precision cutting tools. Moreover, increasing focus on recycling and circular economy practices is encouraging the adoption of bandsaws in metal recycling facilities.
Country | CAGR (2025 to 2035) |
---|---|
European Union (EU) | 3.7% |
Demand from the electronics, automotive, and precision engineering industries fuels the growth of Japan's bandsaw machines market. So the country is dedicated to high-precision manufacturing and automation, resulting in the prevalence of CNC bandsaws with ultra-fine cutting functions. Also, advancements in blade coatings and cooling systems have improved machine efficiency.
One of its key drivers is the electronics sector, which demands highly precise cutting of metals for semiconductor parts. Also, the country's increasing adoption of electric vehicles (EVs) has raised the demand for lightweight materials, hence creating the need for advanced cutting solutions.
Japan’s strict environmental regulations are an influence, too. Manufacturers have also released bandsaws with energy-efficient motors and noise-dampening designs as regulations prohibiting excessive industrial emissions have become stricter.
Country | CAGR (2025 to 2035) |
---|---|
Japan | 3.5% |
As the automotive, electronics, and construction industries grow, so too does the market for bandsaw machines in South Korea. South Korea’s technological progress and smart factory programs have spurred the use of automated and AI-powered cutting tools.
The booming semiconductor industry in South Korea, which is a major consumer of precision metal cutting tools, sharply propels market growth. On the contrary, government initiatives promoting eco-friendly industrial production are compelling manufacturers to come up with energy-efficient bandsaws.
Country | CAGR (2025 to 2035) |
---|---|
South Korea | 3.8% |
The bandsaw machines market has gained a significant increase global market value owing to the rise in demand from metalworking, woodworking, and automotive sectors. High precision cutting solutions and automation trends are reshaping energy saving bandsaw machines buying patterns are significantly changing as organizations seek better productivity and cost reduction from their in-line manufacturers, so firms are focusing on high-precision cutting solutions and energy-efficient bandsaw machines to optimize operational costs.
There are technologies such as evolved global leaders and regional manufacturers making innovative catalysts, cost-effective approaches, and domain-specific applications.
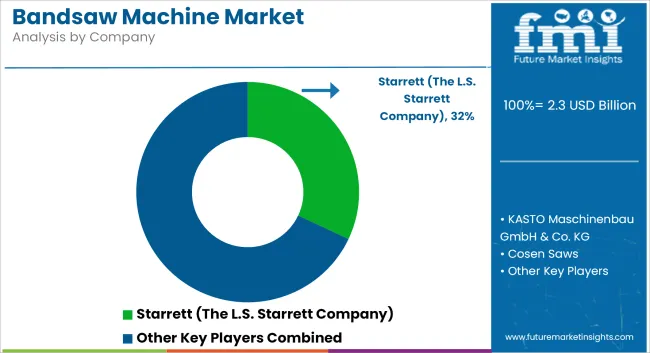
Table 1: Global Market Value (US$ Million) Forecast by Region, 2018 to 2033
Table 2: Global Market Volume (Units) Forecast by Region, 2018 to 2033
Table 3: Global Market Value (US$ Million) Forecast by Orientation, 2018 to 2033
Table 4: Global Market Volume (Units) Forecast by Orientation, 2018 to 2033
Table 5: Global Market Value (US$ Million) Forecast by Operation, 2018 to 2033
Table 6: Global Market Volume (Units) Forecast by Operation, 2018 to 2033
Table 7: Global Market Value (US$ Million) Forecast by Cutting Type, 2018 to 2033
Table 8: Global Market Volume (Units) Forecast by Cutting Type, 2018 to 2033
Table 9: Global Market Value (US$ Million) Forecast by End Use, 2018 to 2033
Table 10: Global Market Volume (Units) Forecast by End Use, 2018 to 2033
Table 11: North America Market Value (US$ Million) Forecast by Country, 2018 to 2033
Table 12: North America Market Volume (Units) Forecast by Country, 2018 to 2033
Table 13: North America Market Value (US$ Million) Forecast by Orientation, 2018 to 2033
Table 14: North America Market Volume (Units) Forecast by Orientation, 2018 to 2033
Table 15: North America Market Value (US$ Million) Forecast by Operation, 2018 to 2033
Table 16: North America Market Volume (Units) Forecast by Operation, 2018 to 2033
Table 17: North America Market Value (US$ Million) Forecast by Cutting Type, 2018 to 2033
Table 18: North America Market Volume (Units) Forecast by Cutting Type, 2018 to 2033
Table 19: North America Market Value (US$ Million) Forecast by End Use, 2018 to 2033
Table 20: North America Market Volume (Units) Forecast by End Use, 2018 to 2033
Table 21: Latin America Market Value (US$ Million) Forecast by Country, 2018 to 2033
Table 22: Latin America Market Volume (Units) Forecast by Country, 2018 to 2033
Table 23: Latin America Market Value (US$ Million) Forecast by Orientation, 2018 to 2033
Table 24: Latin America Market Volume (Units) Forecast by Orientation, 2018 to 2033
Table 25: Latin America Market Value (US$ Million) Forecast by Operation, 2018 to 2033
Table 26: Latin America Market Volume (Units) Forecast by Operation, 2018 to 2033
Table 27: Latin America Market Value (US$ Million) Forecast by Cutting Type, 2018 to 2033
Table 28: Latin America Market Volume (Units) Forecast by Cutting Type, 2018 to 2033
Table 29: Latin America Market Value (US$ Million) Forecast by End Use, 2018 to 2033
Table 30: Latin America Market Volume (Units) Forecast by End Use, 2018 to 2033
Table 31: Western Europe Market Value (US$ Million) Forecast by Country, 2018 to 2033
Table 32: Western Europe Market Volume (Units) Forecast by Country, 2018 to 2033
Table 33: Western Europe Market Value (US$ Million) Forecast by Orientation, 2018 to 2033
Table 34: Western Europe Market Volume (Units) Forecast by Orientation, 2018 to 2033
Table 35: Western Europe Market Value (US$ Million) Forecast by Operation, 2018 to 2033
Table 36: Western Europe Market Volume (Units) Forecast by Operation, 2018 to 2033
Table 37: Western Europe Market Value (US$ Million) Forecast by Cutting Type, 2018 to 2033
Table 38: Western Europe Market Volume (Units) Forecast by Cutting Type, 2018 to 2033
Table 39: Western Europe Market Value (US$ Million) Forecast by End Use, 2018 to 2033
Table 40: Western Europe Market Volume (Units) Forecast by End Use, 2018 to 2033
Table 41: Eastern Europe Market Value (US$ Million) Forecast by Country, 2018 to 2033
Table 42: Eastern Europe Market Volume (Units) Forecast by Country, 2018 to 2033
Table 43: Eastern Europe Market Value (US$ Million) Forecast by Orientation, 2018 to 2033
Table 44: Eastern Europe Market Volume (Units) Forecast by Orientation, 2018 to 2033
Table 45: Eastern Europe Market Value (US$ Million) Forecast by Operation, 2018 to 2033
Table 46: Eastern Europe Market Volume (Units) Forecast by Operation, 2018 to 2033
Table 47: Eastern Europe Market Value (US$ Million) Forecast by Cutting Type, 2018 to 2033
Table 48: Eastern Europe Market Volume (Units) Forecast by Cutting Type, 2018 to 2033
Table 49: Eastern Europe Market Value (US$ Million) Forecast by End Use, 2018 to 2033
Table 50: Eastern Europe Market Volume (Units) Forecast by End Use, 2018 to 2033
Table 51: South Asia and Pacific Market Value (US$ Million) Forecast by Country, 2018 to 2033
Table 52: South Asia and Pacific Market Volume (Units) Forecast by Country, 2018 to 2033
Table 53: South Asia and Pacific Market Value (US$ Million) Forecast by Orientation, 2018 to 2033
Table 54: South Asia and Pacific Market Volume (Units) Forecast by Orientation, 2018 to 2033
Table 55: South Asia and Pacific Market Value (US$ Million) Forecast by Operation, 2018 to 2033
Table 56: South Asia and Pacific Market Volume (Units) Forecast by Operation, 2018 to 2033
Table 57: South Asia and Pacific Market Value (US$ Million) Forecast by Cutting Type, 2018 to 2033
Table 58: South Asia and Pacific Market Volume (Units) Forecast by Cutting Type, 2018 to 2033
Table 59: South Asia and Pacific Market Value (US$ Million) Forecast by End Use, 2018 to 2033
Table 60: South Asia and Pacific Market Volume (Units) Forecast by End Use, 2018 to 2033
Table 61: East Asia Market Value (US$ Million) Forecast by Country, 2018 to 2033
Table 62: East Asia Market Volume (Units) Forecast by Country, 2018 to 2033
Table 63: East Asia Market Value (US$ Million) Forecast by Orientation, 2018 to 2033
Table 64: East Asia Market Volume (Units) Forecast by Orientation, 2018 to 2033
Table 65: East Asia Market Value (US$ Million) Forecast by Operation, 2018 to 2033
Table 66: East Asia Market Volume (Units) Forecast by Operation, 2018 to 2033
Table 67: East Asia Market Value (US$ Million) Forecast by Cutting Type, 2018 to 2033
Table 68: East Asia Market Volume (Units) Forecast by Cutting Type, 2018 to 2033
Table 69: East Asia Market Value (US$ Million) Forecast by End Use, 2018 to 2033
Table 70: East Asia Market Volume (Units) Forecast by End Use, 2018 to 2033
Table 71: Middle East and Africa Market Value (US$ Million) Forecast by Country, 2018 to 2033
Table 72: Middle East and Africa Market Volume (Units) Forecast by Country, 2018 to 2033
Table 73: Middle East and Africa Market Value (US$ Million) Forecast by Orientation, 2018 to 2033
Table 74: Middle East and Africa Market Volume (Units) Forecast by Orientation, 2018 to 2033
Table 75: Middle East and Africa Market Value (US$ Million) Forecast by Operation, 2018 to 2033
Table 76: Middle East and Africa Market Volume (Units) Forecast by Operation, 2018 to 2033
Table 77: Middle East and Africa Market Value (US$ Million) Forecast by Cutting Type, 2018 to 2033
Table 78: Middle East and Africa Market Volume (Units) Forecast by Cutting Type, 2018 to 2033
Table 79: Middle East and Africa Market Value (US$ Million) Forecast by End Use, 2018 to 2033
Table 80: Middle East and Africa Market Volume (Units) Forecast by End Use, 2018 to 2033
Figure 1: Global Market Value (US$ Million) by Orientation, 2023 to 2033
Figure 2: Global Market Value (US$ Million) by Operation, 2023 to 2033
Figure 3: Global Market Value (US$ Million) by Cutting Type, 2023 to 2033
Figure 4: Global Market Value (US$ Million) by End Use, 2023 to 2033
Figure 5: Global Market Value (US$ Million) by Region, 2023 to 2033
Figure 6: Global Market Value (US$ Million) Analysis by Region, 2018 to 2033
Figure 7: Global Market Volume (Units) Analysis by Region, 2018 to 2033
Figure 8: Global Market Value Share (%) and BPS Analysis by Region, 2023 to 2033
Figure 9: Global Market Y-o-Y Growth (%) Projections by Region, 2023 to 2033
Figure 10: Global Market Value (US$ Million) Analysis by Orientation, 2018 to 2033
Figure 11: Global Market Volume (Units) Analysis by Orientation, 2018 to 2033
Figure 12: Global Market Value Share (%) and BPS Analysis by Orientation, 2023 to 2033
Figure 13: Global Market Y-o-Y Growth (%) Projections by Orientation, 2023 to 2033
Figure 14: Global Market Value (US$ Million) Analysis by Operation, 2018 to 2033
Figure 15: Global Market Volume (Units) Analysis by Operation, 2018 to 2033
Figure 16: Global Market Value Share (%) and BPS Analysis by Operation, 2023 to 2033
Figure 17: Global Market Y-o-Y Growth (%) Projections by Operation, 2023 to 2033
Figure 18: Global Market Value (US$ Million) Analysis by Cutting Type, 2018 to 2033
Figure 19: Global Market Volume (Units) Analysis by Cutting Type, 2018 to 2033
Figure 20: Global Market Value Share (%) and BPS Analysis by Cutting Type, 2023 to 2033
Figure 21: Global Market Y-o-Y Growth (%) Projections by Cutting Type, 2023 to 2033
Figure 22: Global Market Value (US$ Million) Analysis by End Use, 2018 to 2033
Figure 23: Global Market Volume (Units) Analysis by End Use, 2018 to 2033
Figure 24: Global Market Value Share (%) and BPS Analysis by End Use, 2023 to 2033
Figure 25: Global Market Y-o-Y Growth (%) Projections by End Use, 2023 to 2033
Figure 26: Global Market Attractiveness by Orientation, 2023 to 2033
Figure 27: Global Market Attractiveness by Operation, 2023 to 2033
Figure 28: Global Market Attractiveness by Cutting Type, 2023 to 2033
Figure 29: Global Market Attractiveness by End Use, 2023 to 2033
Figure 30: Global Market Attractiveness by Region, 2023 to 2033
Figure 31: North America Market Value (US$ Million) by Orientation, 2023 to 2033
Figure 32: North America Market Value (US$ Million) by Operation, 2023 to 2033
Figure 33: North America Market Value (US$ Million) by Cutting Type, 2023 to 2033
Figure 34: North America Market Value (US$ Million) by End Use, 2023 to 2033
Figure 35: North America Market Value (US$ Million) by Country, 2023 to 2033
Figure 36: North America Market Value (US$ Million) Analysis by Country, 2018 to 2033
Figure 37: North America Market Volume (Units) Analysis by Country, 2018 to 2033
Figure 38: North America Market Value Share (%) and BPS Analysis by Country, 2023 to 2033
Figure 39: North America Market Y-o-Y Growth (%) Projections by Country, 2023 to 2033
Figure 40: North America Market Value (US$ Million) Analysis by Orientation, 2018 to 2033
Figure 41: North America Market Volume (Units) Analysis by Orientation, 2018 to 2033
Figure 42: North America Market Value Share (%) and BPS Analysis by Orientation, 2023 to 2033
Figure 43: North America Market Y-o-Y Growth (%) Projections by Orientation, 2023 to 2033
Figure 44: North America Market Value (US$ Million) Analysis by Operation, 2018 to 2033
Figure 45: North America Market Volume (Units) Analysis by Operation, 2018 to 2033
Figure 46: North America Market Value Share (%) and BPS Analysis by Operation, 2023 to 2033
Figure 47: North America Market Y-o-Y Growth (%) Projections by Operation, 2023 to 2033
Figure 48: North America Market Value (US$ Million) Analysis by Cutting Type, 2018 to 2033
Figure 49: North America Market Volume (Units) Analysis by Cutting Type, 2018 to 2033
Figure 50: North America Market Value Share (%) and BPS Analysis by Cutting Type, 2023 to 2033
Figure 51: North America Market Y-o-Y Growth (%) Projections by Cutting Type, 2023 to 2033
Figure 52: North America Market Value (US$ Million) Analysis by End Use, 2018 to 2033
Figure 53: North America Market Volume (Units) Analysis by End Use, 2018 to 2033
Figure 54: North America Market Value Share (%) and BPS Analysis by End Use, 2023 to 2033
Figure 55: North America Market Y-o-Y Growth (%) Projections by End Use, 2023 to 2033
Figure 56: North America Market Attractiveness by Orientation, 2023 to 2033
Figure 57: North America Market Attractiveness by Operation, 2023 to 2033
Figure 58: North America Market Attractiveness by Cutting Type, 2023 to 2033
Figure 59: North America Market Attractiveness by End Use, 2023 to 2033
Figure 60: North America Market Attractiveness by Country, 2023 to 2033
Figure 61: Latin America Market Value (US$ Million) by Orientation, 2023 to 2033
Figure 62: Latin America Market Value (US$ Million) by Operation, 2023 to 2033
Figure 63: Latin America Market Value (US$ Million) by Cutting Type, 2023 to 2033
Figure 64: Latin America Market Value (US$ Million) by End Use, 2023 to 2033
Figure 65: Latin America Market Value (US$ Million) by Country, 2023 to 2033
Figure 66: Latin America Market Value (US$ Million) Analysis by Country, 2018 to 2033
Figure 67: Latin America Market Volume (Units) Analysis by Country, 2018 to 2033
Figure 68: Latin America Market Value Share (%) and BPS Analysis by Country, 2023 to 2033
Figure 69: Latin America Market Y-o-Y Growth (%) Projections by Country, 2023 to 2033
Figure 70: Latin America Market Value (US$ Million) Analysis by Orientation, 2018 to 2033
Figure 71: Latin America Market Volume (Units) Analysis by Orientation, 2018 to 2033
Figure 72: Latin America Market Value Share (%) and BPS Analysis by Orientation, 2023 to 2033
Figure 73: Latin America Market Y-o-Y Growth (%) Projections by Orientation, 2023 to 2033
Figure 74: Latin America Market Value (US$ Million) Analysis by Operation, 2018 to 2033
Figure 75: Latin America Market Volume (Units) Analysis by Operation, 2018 to 2033
Figure 76: Latin America Market Value Share (%) and BPS Analysis by Operation, 2023 to 2033
Figure 77: Latin America Market Y-o-Y Growth (%) Projections by Operation, 2023 to 2033
Figure 78: Latin America Market Value (US$ Million) Analysis by Cutting Type, 2018 to 2033
Figure 79: Latin America Market Volume (Units) Analysis by Cutting Type, 2018 to 2033
Figure 80: Latin America Market Value Share (%) and BPS Analysis by Cutting Type, 2023 to 2033
Figure 81: Latin America Market Y-o-Y Growth (%) Projections by Cutting Type, 2023 to 2033
Figure 82: Latin America Market Value (US$ Million) Analysis by End Use, 2018 to 2033
Figure 83: Latin America Market Volume (Units) Analysis by End Use, 2018 to 2033
Figure 84: Latin America Market Value Share (%) and BPS Analysis by End Use, 2023 to 2033
Figure 85: Latin America Market Y-o-Y Growth (%) Projections by End Use, 2023 to 2033
Figure 86: Latin America Market Attractiveness by Orientation, 2023 to 2033
Figure 87: Latin America Market Attractiveness by Operation, 2023 to 2033
Figure 88: Latin America Market Attractiveness by Cutting Type, 2023 to 2033
Figure 89: Latin America Market Attractiveness by End Use, 2023 to 2033
Figure 90: Latin America Market Attractiveness by Country, 2023 to 2033
Figure 91: Western Europe Market Value (US$ Million) by Orientation, 2023 to 2033
Figure 92: Western Europe Market Value (US$ Million) by Operation, 2023 to 2033
Figure 93: Western Europe Market Value (US$ Million) by Cutting Type, 2023 to 2033
Figure 94: Western Europe Market Value (US$ Million) by End Use, 2023 to 2033
Figure 95: Western Europe Market Value (US$ Million) by Country, 2023 to 2033
Figure 96: Western Europe Market Value (US$ Million) Analysis by Country, 2018 to 2033
Figure 97: Western Europe Market Volume (Units) Analysis by Country, 2018 to 2033
Figure 98: Western Europe Market Value Share (%) and BPS Analysis by Country, 2023 to 2033
Figure 99: Western Europe Market Y-o-Y Growth (%) Projections by Country, 2023 to 2033
Figure 100: Western Europe Market Value (US$ Million) Analysis by Orientation, 2018 to 2033
Figure 101: Western Europe Market Volume (Units) Analysis by Orientation, 2018 to 2033
Figure 102: Western Europe Market Value Share (%) and BPS Analysis by Orientation, 2023 to 2033
Figure 103: Western Europe Market Y-o-Y Growth (%) Projections by Orientation, 2023 to 2033
Figure 104: Western Europe Market Value (US$ Million) Analysis by Operation, 2018 to 2033
Figure 105: Western Europe Market Volume (Units) Analysis by Operation, 2018 to 2033
Figure 106: Western Europe Market Value Share (%) and BPS Analysis by Operation, 2023 to 2033
Figure 107: Western Europe Market Y-o-Y Growth (%) Projections by Operation, 2023 to 2033
Figure 108: Western Europe Market Value (US$ Million) Analysis by Cutting Type, 2018 to 2033
Figure 109: Western Europe Market Volume (Units) Analysis by Cutting Type, 2018 to 2033
Figure 110: Western Europe Market Value Share (%) and BPS Analysis by Cutting Type, 2023 to 2033
Figure 111: Western Europe Market Y-o-Y Growth (%) Projections by Cutting Type, 2023 to 2033
Figure 112: Western Europe Market Value (US$ Million) Analysis by End Use, 2018 to 2033
Figure 113: Western Europe Market Volume (Units) Analysis by End Use, 2018 to 2033
Figure 114: Western Europe Market Value Share (%) and BPS Analysis by End Use, 2023 to 2033
Figure 115: Western Europe Market Y-o-Y Growth (%) Projections by End Use, 2023 to 2033
Figure 116: Western Europe Market Attractiveness by Orientation, 2023 to 2033
Figure 117: Western Europe Market Attractiveness by Operation, 2023 to 2033
Figure 118: Western Europe Market Attractiveness by Cutting Type, 2023 to 2033
Figure 119: Western Europe Market Attractiveness by End Use, 2023 to 2033
Figure 120: Western Europe Market Attractiveness by Country, 2023 to 2033
Figure 121: Eastern Europe Market Value (US$ Million) by Orientation, 2023 to 2033
Figure 122: Eastern Europe Market Value (US$ Million) by Operation, 2023 to 2033
Figure 123: Eastern Europe Market Value (US$ Million) by Cutting Type, 2023 to 2033
Figure 124: Eastern Europe Market Value (US$ Million) by End Use, 2023 to 2033
Figure 125: Eastern Europe Market Value (US$ Million) by Country, 2023 to 2033
Figure 126: Eastern Europe Market Value (US$ Million) Analysis by Country, 2018 to 2033
Figure 127: Eastern Europe Market Volume (Units) Analysis by Country, 2018 to 2033
Figure 128: Eastern Europe Market Value Share (%) and BPS Analysis by Country, 2023 to 2033
Figure 129: Eastern Europe Market Y-o-Y Growth (%) Projections by Country, 2023 to 2033
Figure 130: Eastern Europe Market Value (US$ Million) Analysis by Orientation, 2018 to 2033
Figure 131: Eastern Europe Market Volume (Units) Analysis by Orientation, 2018 to 2033
Figure 132: Eastern Europe Market Value Share (%) and BPS Analysis by Orientation, 2023 to 2033
Figure 133: Eastern Europe Market Y-o-Y Growth (%) Projections by Orientation, 2023 to 2033
Figure 134: Eastern Europe Market Value (US$ Million) Analysis by Operation, 2018 to 2033
Figure 135: Eastern Europe Market Volume (Units) Analysis by Operation, 2018 to 2033
Figure 136: Eastern Europe Market Value Share (%) and BPS Analysis by Operation, 2023 to 2033
Figure 137: Eastern Europe Market Y-o-Y Growth (%) Projections by Operation, 2023 to 2033
Figure 138: Eastern Europe Market Value (US$ Million) Analysis by Cutting Type, 2018 to 2033
Figure 139: Eastern Europe Market Volume (Units) Analysis by Cutting Type, 2018 to 2033
Figure 140: Eastern Europe Market Value Share (%) and BPS Analysis by Cutting Type, 2023 to 2033
Figure 141: Eastern Europe Market Y-o-Y Growth (%) Projections by Cutting Type, 2023 to 2033
Figure 142: Eastern Europe Market Value (US$ Million) Analysis by End Use, 2018 to 2033
Figure 143: Eastern Europe Market Volume (Units) Analysis by End Use, 2018 to 2033
Figure 144: Eastern Europe Market Value Share (%) and BPS Analysis by End Use, 2023 to 2033
Figure 145: Eastern Europe Market Y-o-Y Growth (%) Projections by End Use, 2023 to 2033
Figure 146: Eastern Europe Market Attractiveness by Orientation, 2023 to 2033
Figure 147: Eastern Europe Market Attractiveness by Operation, 2023 to 2033
Figure 148: Eastern Europe Market Attractiveness by Cutting Type, 2023 to 2033
Figure 149: Eastern Europe Market Attractiveness by End Use, 2023 to 2033
Figure 150: Eastern Europe Market Attractiveness by Country, 2023 to 2033
Figure 151: South Asia and Pacific Market Value (US$ Million) by Orientation, 2023 to 2033
Figure 152: South Asia and Pacific Market Value (US$ Million) by Operation, 2023 to 2033
Figure 153: South Asia and Pacific Market Value (US$ Million) by Cutting Type, 2023 to 2033
Figure 154: South Asia and Pacific Market Value (US$ Million) by End Use, 2023 to 2033
Figure 155: South Asia and Pacific Market Value (US$ Million) by Country, 2023 to 2033
Figure 156: South Asia and Pacific Market Value (US$ Million) Analysis by Country, 2018 to 2033
Figure 157: South Asia and Pacific Market Volume (Units) Analysis by Country, 2018 to 2033
Figure 158: South Asia and Pacific Market Value Share (%) and BPS Analysis by Country, 2023 to 2033
Figure 159: South Asia and Pacific Market Y-o-Y Growth (%) Projections by Country, 2023 to 2033
Figure 160: South Asia and Pacific Market Value (US$ Million) Analysis by Orientation, 2018 to 2033
Figure 161: South Asia and Pacific Market Volume (Units) Analysis by Orientation, 2018 to 2033
Figure 162: South Asia and Pacific Market Value Share (%) and BPS Analysis by Orientation, 2023 to 2033
Figure 163: South Asia and Pacific Market Y-o-Y Growth (%) Projections by Orientation, 2023 to 2033
Figure 164: South Asia and Pacific Market Value (US$ Million) Analysis by Operation, 2018 to 2033
Figure 165: South Asia and Pacific Market Volume (Units) Analysis by Operation, 2018 to 2033
Figure 166: South Asia and Pacific Market Value Share (%) and BPS Analysis by Operation, 2023 to 2033
Figure 167: South Asia and Pacific Market Y-o-Y Growth (%) Projections by Operation, 2023 to 2033
Figure 168: South Asia and Pacific Market Value (US$ Million) Analysis by Cutting Type, 2018 to 2033
Figure 169: South Asia and Pacific Market Volume (Units) Analysis by Cutting Type, 2018 to 2033
Figure 170: South Asia and Pacific Market Value Share (%) and BPS Analysis by Cutting Type, 2023 to 2033
Figure 171: South Asia and Pacific Market Y-o-Y Growth (%) Projections by Cutting Type, 2023 to 2033
Figure 172: South Asia and Pacific Market Value (US$ Million) Analysis by End Use, 2018 to 2033
Figure 173: South Asia and Pacific Market Volume (Units) Analysis by End Use, 2018 to 2033
Figure 174: South Asia and Pacific Market Value Share (%) and BPS Analysis by End Use, 2023 to 2033
Figure 175: South Asia and Pacific Market Y-o-Y Growth (%) Projections by End Use, 2023 to 2033
Figure 176: South Asia and Pacific Market Attractiveness by Orientation, 2023 to 2033
Figure 177: South Asia and Pacific Market Attractiveness by Operation, 2023 to 2033
Figure 178: South Asia and Pacific Market Attractiveness by Cutting Type, 2023 to 2033
Figure 179: South Asia and Pacific Market Attractiveness by End Use, 2023 to 2033
Figure 180: South Asia and Pacific Market Attractiveness by Country, 2023 to 2033
Figure 181: East Asia Market Value (US$ Million) by Orientation, 2023 to 2033
Figure 182: East Asia Market Value (US$ Million) by Operation, 2023 to 2033
Figure 183: East Asia Market Value (US$ Million) by Cutting Type, 2023 to 2033
Figure 184: East Asia Market Value (US$ Million) by End Use, 2023 to 2033
Figure 185: East Asia Market Value (US$ Million) by Country, 2023 to 2033
Figure 186: East Asia Market Value (US$ Million) Analysis by Country, 2018 to 2033
Figure 187: East Asia Market Volume (Units) Analysis by Country, 2018 to 2033
Figure 188: East Asia Market Value Share (%) and BPS Analysis by Country, 2023 to 2033
Figure 189: East Asia Market Y-o-Y Growth (%) Projections by Country, 2023 to 2033
Figure 190: East Asia Market Value (US$ Million) Analysis by Orientation, 2018 to 2033
Figure 191: East Asia Market Volume (Units) Analysis by Orientation, 2018 to 2033
Figure 192: East Asia Market Value Share (%) and BPS Analysis by Orientation, 2023 to 2033
Figure 193: East Asia Market Y-o-Y Growth (%) Projections by Orientation, 2023 to 2033
Figure 194: East Asia Market Value (US$ Million) Analysis by Operation, 2018 to 2033
Figure 195: East Asia Market Volume (Units) Analysis by Operation, 2018 to 2033
Figure 196: East Asia Market Value Share (%) and BPS Analysis by Operation, 2023 to 2033
Figure 197: East Asia Market Y-o-Y Growth (%) Projections by Operation, 2023 to 2033
Figure 198: East Asia Market Value (US$ Million) Analysis by Cutting Type, 2018 to 2033
Figure 199: East Asia Market Volume (Units) Analysis by Cutting Type, 2018 to 2033
Figure 200: East Asia Market Value Share (%) and BPS Analysis by Cutting Type, 2023 to 2033
Figure 201: East Asia Market Y-o-Y Growth (%) Projections by Cutting Type, 2023 to 2033
Figure 202: East Asia Market Value (US$ Million) Analysis by End Use, 2018 to 2033
Figure 203: East Asia Market Volume (Units) Analysis by End Use, 2018 to 2033
Figure 204: East Asia Market Value Share (%) and BPS Analysis by End Use, 2023 to 2033
Figure 205: East Asia Market Y-o-Y Growth (%) Projections by End Use, 2023 to 2033
Figure 206: East Asia Market Attractiveness by Orientation, 2023 to 2033
Figure 207: East Asia Market Attractiveness by Operation, 2023 to 2033
Figure 208: East Asia Market Attractiveness by Cutting Type, 2023 to 2033
Figure 209: East Asia Market Attractiveness by End Use, 2023 to 2033
Figure 210: East Asia Market Attractiveness by Country, 2023 to 2033
Figure 211: Middle East and Africa Market Value (US$ Million) by Orientation, 2023 to 2033
Figure 212: Middle East and Africa Market Value (US$ Million) by Operation, 2023 to 2033
Figure 213: Middle East and Africa Market Value (US$ Million) by Cutting Type, 2023 to 2033
Figure 214: Middle East and Africa Market Value (US$ Million) by End Use, 2023 to 2033
Figure 215: Middle East and Africa Market Value (US$ Million) by Country, 2023 to 2033
Figure 216: Middle East and Africa Market Value (US$ Million) Analysis by Country, 2018 to 2033
Figure 217: Middle East and Africa Market Volume (Units) Analysis by Country, 2018 to 2033
Figure 218: Middle East and Africa Market Value Share (%) and BPS Analysis by Country, 2023 to 2033
Figure 219: Middle East and Africa Market Y-o-Y Growth (%) Projections by Country, 2023 to 2033
Figure 220: Middle East and Africa Market Value (US$ Million) Analysis by Orientation, 2018 to 2033
Figure 221: Middle East and Africa Market Volume (Units) Analysis by Orientation, 2018 to 2033
Figure 222: Middle East and Africa Market Value Share (%) and BPS Analysis by Orientation, 2023 to 2033
Figure 223: Middle East and Africa Market Y-o-Y Growth (%) Projections by Orientation, 2023 to 2033
Figure 224: Middle East and Africa Market Value (US$ Million) Analysis by Operation, 2018 to 2033
Figure 225: Middle East and Africa Market Volume (Units) Analysis by Operation, 2018 to 2033
Figure 226: Middle East and Africa Market Value Share (%) and BPS Analysis by Operation, 2023 to 2033
Figure 227: Middle East and Africa Market Y-o-Y Growth (%) Projections by Operation, 2023 to 2033
Figure 228: Middle East and Africa Market Value (US$ Million) Analysis by Cutting Type, 2018 to 2033
Figure 229: Middle East and Africa Market Volume (Units) Analysis by Cutting Type, 2018 to 2033
Figure 230: Middle East and Africa Market Value Share (%) and BPS Analysis by Cutting Type, 2023 to 2033
Figure 231: Middle East and Africa Market Y-o-Y Growth (%) Projections by Cutting Type, 2023 to 2033
Figure 232: Middle East and Africa Market Value (US$ Million) Analysis by End Use, 2018 to 2033
Figure 233: Middle East and Africa Market Volume (Units) Analysis by End Use, 2018 to 2033
Figure 234: Middle East and Africa Market Value Share (%) and BPS Analysis by End Use, 2023 to 2033
Figure 235: Middle East and Africa Market Y-o-Y Growth (%) Projections by End Use, 2023 to 2033
Figure 236: Middle East and Africa Market Attractiveness by Orientation, 2023 to 2033
Figure 237: Middle East and Africa Market Attractiveness by Operation, 2023 to 2033
Figure 238: Middle East and Africa Market Attractiveness by Cutting Type, 2023 to 2033
Figure 239: Middle East and Africa Market Attractiveness by End Use, 2023 to 2033
Figure 240: Middle East and Africa Market Attractiveness by Country, 2023 to 2033
The overall market size for Bandsaw Machine Market was USD 2.3 Billion in 2025.
The Bandsaw Machine Market is expected to reach USD 3.5 Billion in 2035.
The demand in the Bandsaw Market is likely to increase with increasing industrialization, infrastructure growth, and more applications in woodworking, metalworking, and automobile manufacturing, where precision cutting and effectiveness are essential.
The top 5 countries which drives the development of Bandsaw Machine Market are USA, UK, Europe Union, Japan and South Korea.
Horizontal Bandsaw Machines to Command a Significant Share over the Assessment Period.
Explore Similar Insights
Thank you!
You will receive an email from our Business Development Manager. Please be sure to check your SPAM/JUNK folder too.