Cup Filling Machines Market
Market Insights on Cup Filling Machines covering sales outlook, demand forecast & up-to-date key trends
Cup Filling Machines Market By Technology (Automatic, Semi-automatic, Manual), Machine Type (Rotary, Linear), Capacity (Below 1000/Hr., 1000 t0 3000/Hr., 3001 to 6000/Hr., Above 6000/Hr.) & Region- Forecast to 2022-2029
Cup Filling Machines Market Snapshot
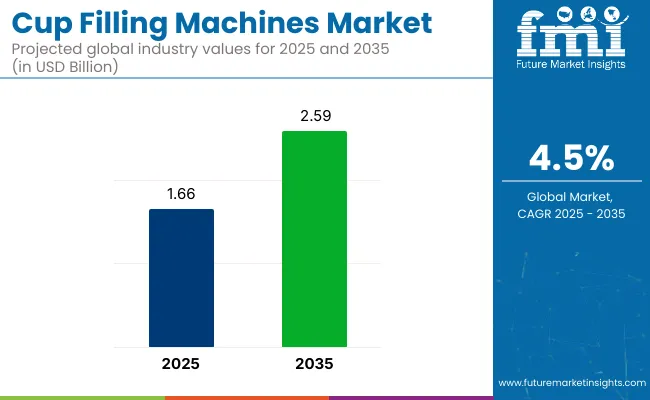
[248 Pages Report] The cup filling machines market is estimated at US$ 1.6 Bn in 2022 and is projected to reach US$ 2.2 Bn by 2029, at a CAGR of 4.6% from 2022 to 2029.
Market Size 2022 |
US$ 1.6 Bn |
Market Size 2029 |
US$ 2.2 Bn |
Value CAGR (2022-2029) |
4.6% |
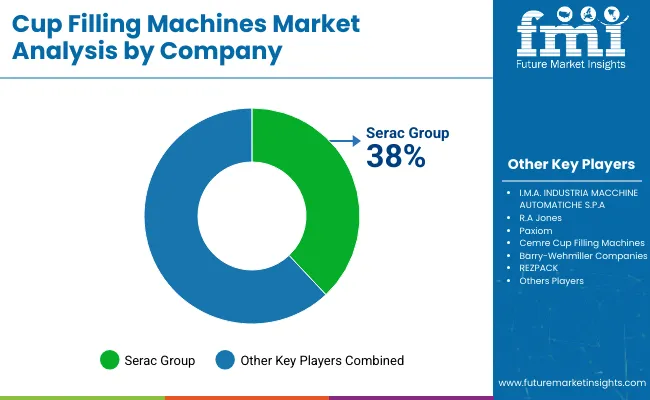
Collective Value Share: Top 5 Companies (2022E) |
20-25% |
The cup filling machines market forms around 2-3% of the global packaging machinery market worth US$ ~58 Bn in 2021.
The cup filling machines market saw soaring growth in 2021 with worldwide revenues up 4.3% year over year. As per the FMI analysis, the cup filling machines revenues is estimated to escalate between 2022 and 2029 along with creating an incremental opportunity of US$ ~682 Mn during the forecasted period.
Newly released data from cup filling machines market analysis shows that global sales of the overall automatic cup filling machines market is anticipated to create an incremental opportunity of US$ 423 Mn during 2022-2029 along with holding around 63% by the end of 2029.
North America followed by Europe region is anticipated to remain the leading regions for cup filling machines market among the other regions. Both the regions, collectively are estimated to hold around 42% of the market value share by the end of 2029.
Let us know your requirement to get
100% FREE customization
Historic and Forecast Market Outlook for Cup Filling Machines
The global cup filling machines market is estimated to expand 1.4 times the current market value during the forecast period with consistent growth in the food & beverage sector.
The cup filling machines are used for filling and sealing the cups with precise volumetric measurements. The cup filling machines are used by various food, beverages and other industries to fill and seal cups precisely within a few seconds. These machines have gained popularity due to their ability to deliver perfect packaging of cups in lesser time.
The different types of cup filling machines are available as per the requirement of the end-use industries such as rotary cup filling machines and liner cup filling machines. Besides this, the cup filling machines are made available with the latest features and technology attached with it which gains traction in the market.
The features such as PC connectivity, PLC control, digital touch screen display, and multiple products filling facilities makes cup filling machines user-friendly.
The cup filling machines market is anticipated to experience a boost in the demand curve with the increasing preference for packed food among consumers. Also, the expanding and constantly growing food & beverage industry drives the demand for cup filling machines. Overall, the future outlook for the cup filling machines market is estimated to grow at a faster rate during the forecast period.
How the Change in Lifestyle and Preferences Contribute to the Growth of Cup Filling Machines Market?
The rising levels of disposable income on personal levels and change in lifestyle induce a significant impact on the packaging machinery market such as the cup filling machines market. Increasingly busy professional lives mean a reduction in the time left for cooking and storing food. As the preference for packaged food such as dairy products and fruit juices increases, substantial opportunities to capture major portions of the market share arise for cup filling machines manufacturers.
Moreover, the cup filling machines are widely used in the dairy and food industry for filling and sealing ice cream, water, yoghurt, buttermilk and other beverages. Milk and milk products are highly in demand due to their nutritional factors, which ultimately help in the growth of the cup filling machines market.
According to the report & survey of the Food and Agriculture Organization of the United Nations (FAO), in 2020 the global milk production reached around 906 Mn tonnes, up with 2.0 per cent from 2019, this ultimately contribute to the growth of global cup filling machines market.
Find your sweet spots for generating winning opportunities in this market.
Talk to AnalystHow the Trend of Precision along with Automation in the Packaging Industry Creates Growth Opportunity for the Cup Filling Machines Market?
Automation is becoming an integral part of each and every industry, including the food & beverages industry. The packaging of food products is no longer carried out manually as the increasing demand for packaged food products requires fast and more precise packaging, which is achieved by using automatic and semi-automatic packaging machinery.
Food manufacturers and suppliers are adopting these automatic packaging machinery to complete the food packaging in a quicker and more efficient manner. Food manufacturers prefer rotary and linear cup filling machines to fill and seal the cups with precise volumetric measurements.
Moreover, the widespread trend of working with less to create more, especially in the food packaging sector is contributing significantly to the growth of the cup filling machines market. Along with that, prominent food manufacturers are making efforts to avoid the unnecessary labor cost which indirectly shifted their focus towards automatic and semi-automatic cup filling machines which ultimately accelerates the demand for cup filling machines.
What was the Impact of the COVID-19 Pandemic on the Global Cup Filling Machines Market?
The slowdown in the operation of various packaging industries due to the COVID-19 pandemic had a negative impact on the cup filling machines. Also, the packaging industry experienced a downfall in the demand during the COVID pandemic which resulted in a negative demand for the cup filling machines market.
The various other factors such as interrupted supply chain, imbalance in the supply of components/raw material, trade restriction by government, and others during COVID-19 had an adverse impact on the cup filling machines market.
Later, at the beginning of 2021, the end-use industries, as well as the packaging industry, started to operate at their full efficiency to cover the loss. Moreover, the end-use industries tried to focus on increasing their production capacity and adopting the latest technology to cover the incurred losses during the pandemic.
The cup filling machines manufacturers are focusing on offering innovation and the latest technology in the cup filling lines to cater for the increasing requirement of technological advancement among the packaging manufacturers. Over, the cup filling machines market is estimated to experience a positive growth rate during the foreseeable period.

A unified Market Research Subscription Platform, built for today's disparate research needs.
Country-wise Insights
How will the U.S. Create Market Growth Opportunity for the Cup Filling Machines Market?
The U.S. captures the major portion of the North American cup filling machines market which accounts for 78% of the North American cup filling machines market along with creating an incremental opportunity of US$ 86 Mn during 2022-2029.
The rising consumption of dairy products in the U.S. is considered to be the major factor driving the demand for the cup filling machines market in the U.S. According to the International Dairy Foods Association (IDFA), in 2020 the dairy consumption in the U.S. showcased an increase of 3 pounds per person over the previous year. This indicated the growth opportunity for the cup filling machines market in the U.S.
How India will Propel the Cup Filling Machines Market Growth?
India remains the leading country generating revenue across South Asia for the cup filling machines market. India cup filling machines market is anticipated to expand 1.6 times the current market value by the end of 2029.
The expanding & penetrating food & beverage industry in India is estimated to be the main factor propelling the growth of the cup filling machines market in India.
Category-wise Insights
Which Technology Segment Holds the Majority of the Cup Filling Machines Market?
With the advancement in technology and with the increasing demand for automation in the packaging industry, the automatic cup filling machines segment is estimated to hold approximately 5/8th portion of the market value share by the end of 2029 and is estimated to create an incremental opportunity of US$ 423 Mn during 2022-2029.
Which Type of Cup Filling Machines are Preferred by the End-use Industry?
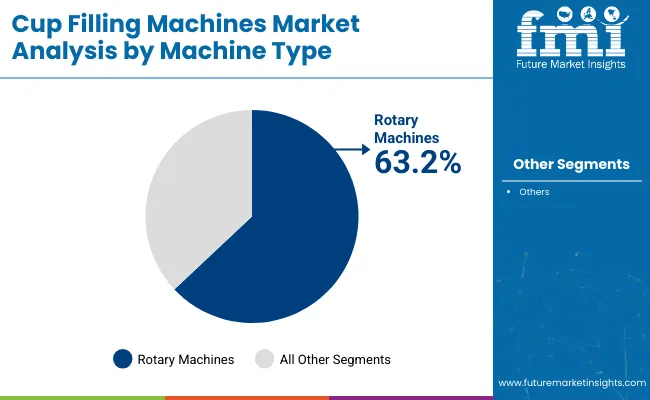
The rotary cup filling machines are majorly preferred by the end-use industry as the rotary cup filling machines are the continuous system that can be used for different sized cups as well as are more efficient which attracts the end-use industries. The rotary cup filling machines segment is forecasted to hold a major portion of the cup filling machines market by the end of 2029 along with holding the market value of US$ 1.3 Bn.
Competitive Landscape
The key manufacturers of cup filling machines are trying to focus on expanding their presence and capacity by purchasing the new facility as well as collaborating with various end-use industries. Also, the key players are focusing on adopting the latest technology in the cup filling lines to attract the end-use industries.
- In November 2021, Serac group announced the expansion of its cup decontamination solution for its cup filling lines. The cup decontamination technology helps in offering an intermediate level of performance between H2O2 and UV decontamination.
- In May 2019, Paxiom Group announced the expansion by purchasing the second facility in Las Vegas, NV.
Scope of Report
Attribute |
Details |
Forecast Period |
2022-2029 |
Historical Data Available for |
2014-2021 |
Market Analysis |
US$ Million for Value and Units for Volume |
Key Regions Covered |
North America, Latin America, Europe, South Asia, East Asia, Oceania, and Middle East & Africa |
Key Countries Covered |
US, Brazil, Mexico, Germany, Spain, Italy, France, U.K., Russia, China, Japan, India, Australia, GCC Countries, and South Africa |
Key Segments Covered |
Technology, Machine Type, Capacity, End-use, and Region |
Key Companies Profiled |
|
Report Coverage |
Market Forecast, Company Share Analysis, Competition Intelligence, DROT Analysis, Market Dynamics and Challenges, and Strategic Growth Initiatives |
Customization & Pricing |
Available upon Request |
Cup Filling Machines Market by Category
By Technology:
- Automatic Cup Filling Machines
- Semi-automatic Cup Filling Machine
- Manual Cup Filling Machines
By Machine Type:
- Rotary Cup Filling Machines
- Linear Cup Filling Machines
By Capacity:
- Below 1000/Hr.
- 1000 to 3000/Hr.
- 3001 to 6000/Hr.
- Above 6000/Hr.
By End-use:
- Food
- Dairy Products
- Cereals & Dry Fruits
- Ready to Eat
- Jam, Sauces & Pickles
- Spices & Condiments
- Bakery & Confectionery
- Others
- Beverages
- Fruit Juices
- Alcoholic Drinks
- Others
- Others
By Region:
- North America
- Latin America
- Europe
- South Asia
- East Asia
- Oceania
- Middle East and Africa (MEA)
Frequently Asked Questions
The global cup filling machines market was worth US$ 1,567 Mn in 2021.
The global market for cup filling machines is projected to expand at a CAGR of 4.6% during 2022-2029 and is anticipated to reach US$ 2,248 Mn by the end of the next seven years.
The constantly growing and expanding major end-use industry such as the food & beverage sector drives the sales of packaging machinery such as cup filling machines.
The trend for automation in the packaging industry propels the demand for automatic cup filling machines across the globe.
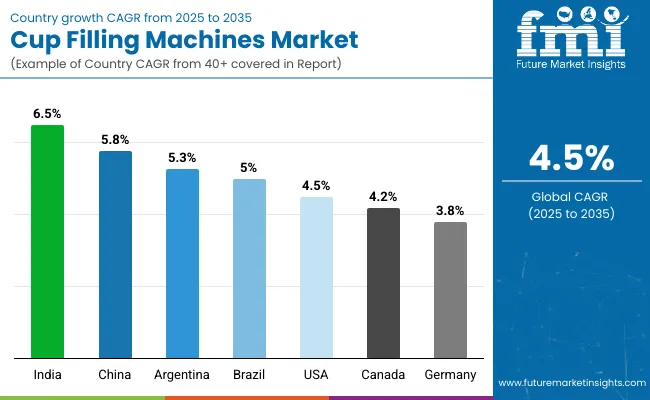
As per FMI analysis, the India cup filling machines market is estimated to register a CAGR of 6.1% between 2022 and 2029.
Table of Content
1. Executive Summary
1.1. Global Market Overview
1.2. Market Analysis
1.3. Analysis and Recommendations
2. Market Overview
2.1. Market Definition
2.2. Market Coverage
3. Key Market Trends
3.1. Key Trends Impacting the Market
3.2. Product Innovation / Development Trends
4. Key Success Factors
4.1. Product Adoption / Usage Analysis
4.2. Product USPs / Features
5. Global Cup Filling Machines Market Demand Analysis 2014-2021 and Forecast, 2022-2029
5.1. Historical Market Volume (Units) Analysis, 2014-2021
5.2. Current and Future Market Volume (Units) Projections, 2022-2029
5.3. Y-o-Y Growth Trend Analysis
6. Global Cup Filling Machines Market - Pricing Analysis
6.1. Regional Pricing Analysis, By Technology
6.2. Pricing Break-up
6.3. Global Average Pricing Analysis Benchmark
7. Global Cup Filling Machines Market Demand (US$ Mn) Analysis 2014-2021 and Forecast, 2022-2029
7.1. Historical Market Value (US$ Mn) Analysis, 2014-2021
7.2. Current and Future Market Value (US$ Mn) Projections, 2022-2029
7.2.1. Y-o-Y Growth Trend Analysis
7.2.2. Absolute $ Opportunity Analysis
8. Market Background
8.1. Global Packaging Machinery Market Overview
8.2. Global Cup Market Overview
8.3. Global Food & Beverages Market Outlook
8.4. Macro-Economic Factors & Co-relation Analysis
8.4.1. Global Packaging Machinery Industry Growth
8.4.2. Global Packaging Industry Growth
8.4.3. Global Packaged Food Market Overview
8.4.4. Global Beverage Industry Growth
8.4.5. GDP Growth
8.4.6. COVID-19 Pandemic
8.5. Forecast Factors - Relevance & Impact
8.5.1. Global Packaging Market Growth
8.5.2. Global Food & Beverage Market Outlook
8.5.3. Per Capita Beverage Consumption
8.5.4. Per Capita Packed Food Consumption
8.5.5. Global Retail Sector Growth
8.5.6. Segmental Revenue Growth of Key Players
8.5.7. Manufacturing Value Added Growth (MVA)
8.6. Value Chain Analysis
8.6.1. Key Participants
8.6.1.1. Component Suppliers
8.6.1.2. Cup Filling Machines Manufacturers
8.6.1.3. End Users
8.6.2. Profitability Margin
8.7. Market Dynamics
8.7.1. Drivers
8.7.2. Restraints
8.7.3. Opportunity Analysis
9. Impact of COVID-19
9.1. Current Statistics and Probable Future Impact
9.2. Impact of COVID-19 on Cup Filling Machines Market
10. Global Cup Filling Machines Market Analysis 2014-2021 and Forecast 2022-2029, By Technology
10.1. Introduction
10.2. Historical Market Size (US$ Mn) and Volume (Units) Analysis, By Technology, 2014-2021
10.3. Current and Future Market Size (US$ Mn) and Volume (Units) Analysis and Forecast, By Technology, 2022-2029
10.3.1. Automatic Cup Filling Machines
10.3.2. Semi-automatic Cup Filling Machines
10.3.3. Manual Cup Filling Machines
10.4. Market Attractiveness Analysis, By Technology
11. Global Cup Filling Machines Market Analysis 2014-2021 and Forecast 2022-2029, By Machine Type
11.1. Introduction
11.2. Historical Market Size (US$ Mn) and Volume (Units) Analysis, By Machine Type, 2014-2021
11.3. Current and Future Market Size (US$ Mn) and Volume (Units) Analysis and Forecast, By Machine Type, 2022-2029
11.3.1. Rotary Cup Filling Machines
11.3.2. Linear Cup Filling Machines
11.4. Market Attractiveness Analysis, By Machine Type
12. Global Cup Filling Machines Market Analysis 2014-2021 and Forecast 2022-2029, By Capacity
12.1. Introduction
12.2. Historical Market Size (US$ Mn) and Volume (Units) Analysis, By Capacity, 2014-2021
12.3. Current and Future Market Size (US$ Mn) and Volume (Units) Analysis and Forecast, By Capacity, 2022-2029
12.3.1. Below 1000/Hr.
12.3.2. 1000 to 3000/Hr.
12.3.3. 3001 to 6000/Hr.
12.3.4. Above 6000/Hr.
12.4. Market Attractiveness Analysis, By Capacity
13. Global Cup Filling Machines Market Analysis 2014-2021 and Forecast 2022-2029, By End-use
13.1. Introduction
13.2. Historical Market Size (US$ Mn) and Volume (Units) Analysis, By End-use, 2014-2021
13.3. Current and Future Market Size (US$ Mn) and Volume (Units) Analysis and Forecast, By End-use, 2022-2029
13.3.1. Food
13.3.1.1. Dairy Products
13.3.1.2. Cereals & Dry Fruits
13.3.1.3. Ready to Eat
13.3.1.4. Jam, Sauces & Pickles
13.3.1.5. Spices & Condiments
13.3.1.6. Bakery & Confectionery
13.3.1.7. Others
13.3.2. Beverages
13.3.2.1. Fruit Juices
13.3.2.2. Alcoholic Drinks
13.3.2.3. Others
13.3.3. Others
13.4. Market Attractiveness Analysis, By End-use
14. Global Cup Filling Machines Market Analysis 2014-2021 and Forecast 2022-2029, By Region
14.1. Introduction
14.2. Historical Market Size (US$ Mn) and Volume (Units) Analysis, by Region, 2014-2021
14.3. Current Market Size (US$ Mn) and Volume (Units) Analysis and Forecast, by Region, 2022-2029
14.3.1. North America
14.3.2. Latin America
14.3.3. Europe
14.3.4. South Asia
14.3.5. East Asia
14.3.6. Oceania
14.3.7. Middle East and Africa (MEA)
14.4. Market Attractiveness Analysis, by Region
15. North America Cup Filling Machines Market Analysis 2014-2021 and Forecast 2022-2029
15.1. Introduction
15.2. Historical Market Size (US$ Mn) and Volume (Units) Trend Analysis, by Market Taxonomy, 2014-2021
15.3. Market Size (US$ Mn) and Volume (Units) Forecast, by Market Taxonomy, 2022-2029
15.3.1. By Country
15.3.1.1. U.S.
15.3.1.2. Canada
15.3.2. By Technology
15.3.3. By Machine Type
15.3.4. By Capacity
15.3.5. By End-use
15.4. Market Attractiveness Analysis
15.4.1. By Country
15.4.2. By Technology
15.4.3. By Machine Type
15.4.4. By Capacity
15.4.5. By End-use
16. Latin America Cup Filling Machines Market Analysis 2014-2021 and Forecast 2022-2029
16.1. Introduction
16.2. Historical Market Size (US$ Mn) and Volume (Units) Trend Analysis, by Market Taxonomy, 2014-2021
16.3. Market Size (US$ Mn) and Volume (Units) Forecast, by Market Taxonomy, 2022-2029
16.3.1. By Country
16.3.1.1. Brazil
16.3.1.2. Mexico
16.3.1.3. Argentina
16.3.1.4. Rest of Latin America
16.3.2. By Technology
16.3.3. By Machine Type
16.3.4. By Capacity
16.3.5. By End-use
16.4. Market Attractiveness Analysis
16.4.1. By Country
16.4.2. By Technology
16.4.3. By Machine Type
16.4.4. By Capacity
16.4.5. By End-use
17. Europe Cup Filling Machines Market Analysis 2014-2021 and Forecast 2022-2029
17.1. Introduction
17.2. Historical Market Size (US$ Mn) and Volume (Units) Trend Analysis, by Market Taxonomy, 2014-2021
17.3. Market Size (US$ Mn) and Volume (Units) Forecast, by Market Taxonomy, 2022-2029
17.3.1. By Country
17.3.1.1. Germany
17.3.1.2. Italy
17.3.1.3. France
17.3.1.4. Spain
17.3.1.5. U.K.
17.3.1.6. BENELUX
17.3.1.7. Russia
17.3.1.8. Poland
17.3.1.9. Rest of Europe
17.3.2. By Capacity
17.3.3. By Material
17.3.4. By End Use
17.4. Market Attractiveness Analysis
17.4.1. By Country
17.4.2. By Technology
17.4.3. By Machine Type
17.4.4. By Capacity
17.4.5. By End-use
18. South Asia Cup Filling Machines Market Analysis 2014-2021 and Forecast 2022-2029
18.1. Introduction
18.2. Historical Market Size (US$ Mn) and Volume (Units) Trend Analysis, by Market Taxonomy, 2014-2021
18.3. Market Size (US$ Mn) and Volume (Units) Forecast, by Market Taxonomy, 2022-2029
18.3.1. By Country
18.3.1.1. India
18.3.1.2. Thailand
18.3.1.3. Indonesia
18.3.1.4. Malaysia
18.3.1.5. Rest of South Asia
18.3.2. By Technology
18.3.3. By Machine Type
18.3.4. By Capacity
18.3.5. By End-use
18.4. Market Attractiveness Analysis
18.4.1. By Country
18.4.2. By Technology
18.4.3. By Machine Type
18.4.4. By Capacity
18.4.5. By End-use
19. East Asia Cup Filling Machines Market Analysis 2014-2021 and Forecast 2022-2029
19.1. Introduction
19.2. Historical Market Size (US$ Mn) and Volume (Units) Trend Analysis, by Market Taxonomy, 2014-2021
19.3. Market Size (US$ Mn) and Volume (Units) Forecast, by Market Taxonomy, 2022-2029
19.3.1. By Country
19.3.1.1. China
19.3.1.2. Japan
19.3.1.3. South Korea
19.3.1.4. Rest of East Asia
19.3.2. By Technology
19.3.3. By Machine Type
19.3.4. By Capacity
19.3.5. By End-use
19.4. Market Attractiveness Analysis
19.4.1. By Country
19.4.2. By Technology
19.4.3. By Machine Type
19.4.4. By Capacity
19.4.5. By End-use
20. Oceania Cup Filling Machines Market Analysis 2014-2021 and Forecast 2022-2029
20.1. Introduction
20.2. Historical Market Size (US$ Mn) and Volume (Units) Trend Analysis, by Market Taxonomy, 2014-2021
20.3. Market Size (US$ Mn) and Volume (Units) Forecast, by Market Taxonomy, 2022-2029
20.3.1. By Country
20.3.1.1. Australia
20.3.1.2. New Zealand
20.3.2. By Technology
20.3.3. By Machine Type
20.3.4. By Capacity
20.3.5. By End-use
20.4. Market Attractiveness Analysis
20.4.1. By Country
20.4.2. By Technology
20.4.3. By Machine Type
20.4.4. By Capacity
20.4.5. By End-use
21. Middle East and Africa Cup Filling Machines Market Analysis 2014-2021 and Forecast 2022-2029
21.1. Introduction
21.2. Historical Market Size (US$ Mn) and Volume (Units) Trend Analysis, by Market Taxonomy, 2014-2021
21.3. Market Size (US$ Mn) and Volume (Units) Forecast, by Market Taxonomy, 2022-2029
21.3.1. By Country
21.3.1.1. GCC Countries
21.3.1.2. Turkey
21.3.1.3. Northern Africa
21.3.1.4. South Africa
21.3.1.5. Rest of Middle East and Africa
21.3.2. By Technology
21.3.3. By Machine Type
21.3.4. By Capacity
21.3.5. By End-use
21.4. Market Attractiveness Analysis
21.4.1. By Country
21.4.2. By Technology
21.4.3. By Machine Type
21.4.4. By Capacity
21.4.5. By End-use
22. Cup Filling Machines Market Country wise Analysis 2022 & 2029
22.1. U.S. Cup Filling Machines Market Analysis
22.1.1. Market Volume (Units) and Value (US$ Mn) Analysis and Forecast, by Market Taxonomy
22.1.1.1. By Technology
22.1.1.2. By Machine Type
22.1.1.3. By Capacity
22.1.1.4. By End-use
22.2. Brazil Cup Filling Machines Market Analysis
22.2.1. Market Volume (Units) and Value (US$ Mn) Analysis and Forecast, by Market Taxonomy
22.2.1.1. By Technology
22.2.1.2. By Machine Type
22.2.1.3. By Capacity
22.2.1.4. By End-use
22.3. Mexico Cup Filling Machines Market Analysis
22.3.1. Market Volume (Units) and Value (US$ Mn) Analysis and Forecast, by Market Taxonomy
22.3.1.1. By Technology
22.3.1.2. By Machine Type
22.3.1.3. By Capacity
22.3.1.4. By End-use
22.4. Germany Cup Filling Machines Market Analysis
22.4.1. Market Volume (Units) and Value (US$ Mn) Analysis and Forecast, by Market Taxonomy
22.4.1.1. By Technology
22.4.1.2. By Machine Type
22.4.1.3. By Capacity
22.4.1.4. By End-use
22.5. Spain Cup Filling Machines Market Analysis
22.5.1. Market Volume (Units) and Value (US$ Mn) Analysis and Forecast, by Market Taxonomy
22.5.1.1. By Technology
22.5.1.2. By Machine Type
22.5.1.3. By Capacity
22.5.1.4. By End-use
22.6. Italy Cup Filling Machines Market Analysis
22.6.1. Market Volume (Units) and Value (US$ Mn) Analysis and Forecast, by Market Taxonomy
22.6.1.1. By Technology
22.6.1.2. By Machine Type
22.6.1.3. By Capacity
22.6.1.4. By End-use
22.7. France Cup Filling Machines Market Analysis
22.7.1. Market Volume (Units) and Value (US$ Mn) Analysis and Forecast, by Market Taxonomy
22.7.1.1. By Technology
22.7.1.2. By Machine Type
22.7.1.3. By Capacity
22.7.1.4. By End-use
22.8. U.K. Cup Filling Machines Market Analysis
22.8.1. Market Volume (Units) and Value (US$ Mn) Analysis and Forecast, by Market Taxonomy
22.8.1.1. By Technology
22.8.1.2. By Machine Type
22.8.1.3. By Capacity
22.8.1.4. By End-use
22.9. Russia Cup Filling Machines Market Analysis
22.9.1. Market Volume (Units) and Value (US$ Mn) Analysis and Forecast, by Market Taxonomy
22.9.1.1. By Technology
22.9.1.2. By Machine Type
22.9.1.3. By Capacity
22.9.1.4. By End-use
22.10. China Cup Filling Machines Market Analysis
22.10.1. Market Volume (Units) and Value (US$ Mn) Analysis and Forecast, by Market Taxonomy
22.10.1.1. By Technology
22.10.1.2. By Machine Type
22.10.1.3. By Capacity
22.10.1.4. By End-use
22.11. Japan Cup Filling Machines Market Analysis
22.11.1. Market Volume (Units) and Value (US$ Mn) Analysis and Forecast, by Market Taxonomy
22.11.1.1. By Technology
22.11.1.2. By Machine Type
22.11.1.3. By Capacity
22.11.1.4. By End-use
22.12. India Cup Filling Machines Market Analysis
22.12.1. Market Volume (Units) and Value (US$ Mn) Analysis and Forecast, by Market Taxonomy
22.12.1.1. By Technology
22.12.1.2. By Machine Type
22.12.1.3. By Capacity
22.12.1.4. By End-use
22.13. Australia Cup Filling Machines Market Analysis
22.13.1. Market Volume (Units) and Value (US$ Mn) Analysis and Forecast, by Market Taxonomy
22.13.1.1. By Technology
22.13.1.2. By Machine Type
22.13.1.3. By Capacity
22.13.1.4. By End-use
22.14. GCC Countries Cup Filling Machines Market Analysis
22.14.1. Market Volume (Units) and Value (US$ Mn) Analysis and Forecast, by Market Taxonomy
22.14.1.1. By Technology
22.14.1.2. By Machine Type
22.14.1.3. By Capacity
22.14.1.4. By End-use
22.15. South Africa Cup Filling Machines Market Analysis
22.15.1. Market Volume (Units) and Value (US$ Mn) Analysis and Forecast, by Market Taxonomy
22.15.1.1. By Technology
22.15.1.2. By Machine Type
22.15.1.3. By Capacity
22.15.1.4. By End-use
23. Market Structure Analysis
23.1. Market Analysis, by Tier of Cup Filling Machines Companies
23.2. Market Share Analysis of Top Players
23.3. Market Presence Analysis
23.3.1. By Operating Regions
23.3.2. By Product Portfolio
24. Competition Analysis
24.1. Competition Dashboard
24.2. Competition Benchmarking
24.3. Competition Deep Dive
24.3.1. I.M.A. INDUSTRIA MACCHINE AUTOMATICHE S.P.A
24.3.1.1. Overview
24.3.1.2. Product Portfolio
24.3.1.3. Profitability by Market Segments
24.3.1.4. Sales Footprint
24.3.1.5. Strategy Overview
24.3.1.5.1. Marketing Strategy
24.3.1.5.2. Product Strategy
24.3.1.5.3. Channel Strategy
24.3.2. R.A Jones
24.3.2.1. Overview
24.3.2.2. Product Portfolio
24.3.2.3. Profitability by Market Segments
24.3.2.4. Sales Footprint
24.3.2.5. Strategy Overview
24.3.2.5.1. Marketing Strategy
24.3.2.5.2. Product Strategy
24.3.2.5.3. Channel Strategy
24.3.3. Serac Group
24.3.3.1. Overview
24.3.3.2. Product Portfolio
24.3.3.3. Profitability by Market Segments
24.3.3.4. Sales Footprint
24.3.3.5. Strategy Overview
24.3.3.5.1. Marketing Strategy
24.3.3.5.2. Product Strategy
24.3.3.5.3. Channel Strategy
24.3.4. Paxiom Group
24.3.4.1. Overview
24.3.4.2. Product Portfolio
24.3.4.3. Profitability by Market Segments
24.3.4.4. Sales Footprint
24.3.4.5. Strategy Overview
24.3.4.5.1. Marketing Strategy
24.3.4.5.2. Product Strategy
24.3.4.5.3. Channel Strategy
24.3.5. Cemre Cup Filling Machines
24.3.5.1. Overview
24.3.5.2. Product Portfolio
24.3.5.3. Profitability by Market Segments
24.3.5.4. Sales Footprint
24.3.5.5. Strategy Overview
24.3.5.5.1. Marketing Strategy
24.3.5.5.2. Product Strategy
24.3.5.5.3. Channel Strategy
24.3.6. Barry-Wehmiller Companies
24.3.6.1. Overview
24.3.6.2. Product Portfolio
24.3.6.3. Profitability by Market Segments
24.3.6.4. Sales Footprint
24.3.6.5. Strategy Overview
24.3.6.5.1. Marketing Strategy
24.3.6.5.2. Product Strategy
24.3.6.5.3. Channel Strategy
24.3.7. REZPACK (UnionPack International Co.,Ltd)
24.3.7.1. Overview
24.3.7.2. Product Portfolio
24.3.7.3. Profitability by Market Segments
24.3.7.4. Sales Footprint
24.3.7.5. Strategy Overview
24.3.7.5.1. Marketing Strategy
24.3.7.5.2. Product Strategy
24.3.7.5.3. Channel Strategy
24.3.8. AMS FILLING
24.3.8.1. Overview
24.3.8.2. Product Portfolio
24.3.8.3. Profitability by Market Segments
24.3.8.4. Sales Footprint
24.3.8.5. Strategy Overview
24.3.8.5.1. Marketing Strategy
24.3.8.5.2. Product Strategy
24.3.8.5.3. Channel Strategy
24.3.9. NHM Machinery
24.3.9.1. Overview
24.3.9.2. Product Portfolio
24.3.9.3. Profitability by Market Segments
24.3.9.4. Sales Footprint
24.3.9.5. Strategy Overview
24.3.9.5.1. Marketing Strategy
24.3.9.5.2. Product Strategy
24.3.9.5.3. Channel Strategy
24.3.10. Shikoku Kakoki Co.,Ltd.
24.3.10.1. Overview
24.3.10.2. Product Portfolio
24.3.10.3. Profitability by Market Segments
24.3.10.4. Sales Footprint
24.3.10.5. Strategy Overview
24.3.10.5.1. Marketing Strategy
24.3.10.5.2. Product Strategy
24.3.10.5.3. Channel Strategy
24.3.11. Spee-Dee Packaging Machinery, Inc.
24.3.11.1. Overview
24.3.11.2. Product Portfolio
24.3.11.3. Profitability by Market Segments
24.3.11.4. Sales Footprint
24.3.11.5. Strategy Overview
24.3.11.5.1. Marketing Strategy
24.3.11.5.2. Product Strategy
24.3.11.5.3. Channel Strategy
24.3.12. Associated Pack Tech Engineers
24.3.12.1. Overview
24.3.12.2. Product Portfolio
24.3.12.3. Profitability by Market Segments
24.3.12.4. Sales Footprint
24.3.12.5. Strategy Overview
24.3.12.5.1. Marketing Strategy
24.3.12.5.2. Product Strategy
24.3.12.5.3. Channel Strategy
24.3.13. Trepko Group
24.3.13.1. Overview
24.3.13.2. Product Portfolio
24.3.13.3. Profitability by Market Segments
24.3.13.4. Sales Footprint
24.3.13.5. Strategy Overview
24.3.13.5.1. Marketing Strategy
24.3.13.5.2. Product Strategy
24.3.13.5.3. Channel Strategy
24.3.14. Rovema North America, Inc.
24.3.14.1. Overview
24.3.14.2. Product Portfolio
24.3.14.3. Profitability by Market Segments
24.3.14.4. Sales Footprint
24.3.14.5. Strategy Overview
24.3.14.5.1. Marketing Strategy
24.3.14.5.2. Product Strategy
24.3.14.5.3. Channel Strategy
24.3.15. ControlGMC
24.3.15.1. Overview
24.3.15.2. Product Portfolio
24.3.15.3. Profitability by Market Segments
24.3.15.4. Sales Footprint
24.3.15.5. Strategy Overview
24.3.15.5.1. Marketing Strategy
24.3.15.5.2. Product Strategy
24.3.15.5.3. Channel Strategy
24.3.16. Alter Pack Canada
24.3.16.1. Overview
24.3.16.2. Product Portfolio
24.3.16.3. Profitability by Market Segments
24.3.16.4. Sales Footprint
24.3.16.5. Strategy Overview
24.3.16.5.1. Marketing Strategy
24.3.16.5.2. Product Strategy
24.3.16.5.3. Channel Strategy
24.3.17. PRASANNA PACKAGING MACHINERY PVT. LTD.
24.3.17.1. Overview
24.3.17.2. Product Portfolio
24.3.17.3. Profitability by Market Segments
24.3.17.4. Sales Footprint
24.3.17.5. Strategy Overview
24.3.17.5.1. Marketing Strategy
24.3.17.5.2. Product Strategy
24.3.17.5.3. Channel Strategy
24.3.18. Hermann WALDNER GmbH & Co. KG
24.3.18.1. Overview
24.3.18.2. Product Portfolio
24.3.18.3. Profitability by Market Segments
24.3.18.4. Sales Footprint
24.3.18.5. Strategy Overview
24.3.18.5.1. Marketing Strategy
24.3.18.5.2. Product Strategy
24.3.18.5.3. Channel Strategy
24.3.19. CDA USA
24.3.19.1. Overview
24.3.19.2. Product Portfolio
24.3.19.3. Profitability by Market Segments
24.3.19.4. Sales Footprint
24.3.19.5. Strategy Overview
24.3.19.5.1. Marketing Strategy
24.3.19.5.2. Product Strategy
24.3.19.5.3. Channel Strategy
24.3.20. Robert Bosch GmbH
24.3.20.1. Overview
24.3.20.2. Product Portfolio
24.3.20.3. Profitability by Market Segments
24.3.20.4. Sales Footprint
24.3.20.5. Strategy Overview
24.3.20.5.1. Marketing Strategy
24.3.20.5.2. Product Strategy
24.3.20.5.3. Channel Strategy
25. Assumptions and Acronyms Used
26. Research Methodology
Let us know your requirement to get
100% FREE customization
List of Tables
Table 01: Global Cup Filling Machines Market Value (US$ Mn) Analysis, by Technology, 2014H-2029F
Table 02: Global Cup Filling Machines Market Volume (Units) Analysis, by Technology, 2014H-2029F
Table 03: Global Cup Filling Machines Market Value (US$ Mn) Analysis, by Machine Type, 2014H-2029F
Table 04: Global Cup Filling Machines Market Volume (Units) Analysis, by Machine Type, 2014H-2029F
Table 05: Global Cup Filling Machines Market Value (US$ Mn) Analysis, by Capacity, 2014H-2029F
Table 06: Global Cup Filling Machines Market Volume (Units) Analysis, by Capacity, 2014H-2029F
Table 07: Global Cup Filling Machines Market Value (US$ Mn) Analysis, by End-use, 2014H-2029F
Table 08: Global Cup Filling Machines Market Volume (Units) Analysis, by End-use, 2014H-2029F
Table 09: Global Cup Filling Machines Market Value (US$ Mn) Analysis, by Region, 2014H-2029F
Table 10: Global Cup Filling Machines Market Volume (Units) Analysis, by Region, 2014H-2029F
Table 11: North America Cup Filling Machines Market Value (US$ Mn) Analysis, by Technology, 2014H-2029F
Table 12: North America Cup Filling Machines Market Volume (Units) Analysis, by Technology, 2014H-2029F
Table 13: North America Cup Filling Machines Market Value (US$ Mn) Analysis, by Machine Type, 2014H-2029F
Table 14: North America Cup Filling Machines Market Volume (Units) Analysis, by Machine Type, 2014H-2029F
Table 15: North America Cup Filling Machines Market Value (US$ Mn) Analysis, by Capacity, 2014H-2029F
Table 16: North America Cup Filling Machines Market Volume (Units) Analysis, by Capacity, 2014H-2029F
Table 17: North America Cup Filling Machines Market Value (US$ Mn) Analysis, by End-use, 2014H-2029F
Table 18: North America Cup Filling Machines Market Volume (Units) Analysis, by End-use, 2014H-2029F
Table 19: North America Cup Filling Machines Market Value (US$ Mn) Analysis, by Country, 2014H-2029F
Table 20: North America Cup Filling Machines Market Volume (Units) Analysis, by Country, 2014H-2029F
Table 21: Latin America Cup Filling Machines Market Value (US$ Mn) Analysis, by Technology, 2014H-2029F
Table 22: Latin America Cup Filling Machines Market Volume (Units) Analysis, by Technology, 2014H-2029F
Table 23: Latin America Cup Filling Machines Market Value (US$ Mn) Analysis, by Machine Type, 2014H-2029F
Table 24: Latin America Cup Filling Machines Market Volume (Units) Analysis, by Machine Type, 2014H-2029F
Table 25: Latin America Cup Filling Machines Market Value (US$ Mn) Analysis, by Capacity, 2014H-2029F
Table 26: Latin America Cup Filling Machines Market Volume (Units) Analysis, by Capacity, 2014H-2029F
Table 27: Latin America Cup Filling Machines Market Value (US$ Mn) Analysis, by End-use, 2014H-2029F
Table 28: Latin America Cup Filling Machines Market Volume (Units) Analysis, by End-use, 2014H-2029F
Table 29: Latin America Cup Filling Machines Market Value (US$ Mn) Analysis, by Country, 2014H-2029F
Table 30: Latin America Cup Filling Machines Market Volume (Units) Analysis, by Country, 2014H-2029F
Table 31: Europe Cup Filling Machines Market Value (US$ Mn) Analysis, by Technology, 2014H-2029F
Table 32: Europe Cup Filling Machines Market Volume (Units) Analysis, by Technology, 2014H-2029F
Table 33: Europe Cup Filling Machines Market Value (US$ Mn) Analysis, by Machine Type, 2014H-2029F
Table 34: Europe Cup Filling Machines Market Volume (Units) Analysis, by Machine Type, 2014H-2029F
Table 35: Europe Cup Filling Machines Market Value (US$ Mn) Analysis, by Capacity, 2014H-2029F
Table 36: Europe Cup Filling Machines Market Volume (Units) Analysis, by Capacity, 2014H-2029F
Table 37: Europe Cup Filling Machines Market Value (US$ Mn) Analysis, by End-use, 2014H-2029F
Table 38: Europe Cup Filling Machines Market Volume (Units) Analysis, by End-use, 2014H-2029F
Table 39: Europe Cup Filling Machines Market Value (US$ Mn) Analysis, by Country, 2014H-2029F
Table 40: Europe Cup Filling Machines Market Volume (Units) Analysis, by Country, 2014H-2029F
Table 41: South Asia Cup Filling Machines Market Value (US$ Mn) Analysis, by Technology, 2014H-2029F
Table 42: South Asia Cup Filling Machines Market Volume (Units) Analysis, by Technology, 2014H-2029F
Table 43: South Asia Cup Filling Machines Market Value (US$ Mn) Analysis, by Machine Type, 2014H-2029F
Table 44: South Asia Cup Filling Machines Market Volume (Units) Analysis, by Machine Type, 2014H-2029F
Table 45: South Asia Cup Filling Machines Market Value (US$ Mn) Analysis, by Capacity, 2014H-2029F
Table 46: South Asia Cup Filling Machines Market Volume (Units) Analysis, by Capacity, 2014H-2029F
Table 47: South Asia Cup Filling Machines Market Value (US$ Mn) Analysis, by End-use, 2014H-2029F
Table 48: South Asia Cup Filling Machines Market Volume (Units) Analysis, by End-use, 2014H-2029F
Table 49: South Asia Cup Filling Machines Market Value (US$ Mn) Analysis, by Country, 2014H-2029F
Table 50: South Asia Cup Filling Machines Market Volume (Units) Analysis, by Country, 2014H-2029F
Table 51: East Asia Cup Filling Machines Market Value (US$ Mn) Analysis, by Technology, 2014H-2029F
Table 52: East Asia Cup Filling Machines Market Volume (Units) Analysis, by Technology, 2014H-2029F
Table 53: East Asia Cup Filling Machines Market Value (US$ Mn) Analysis, by Machine Type, 2014H-2029F
Table 54: East Asia Cup Filling Machines Market Volume (Units) Analysis, by Machine Type, 2014H-2029F
Table 55: East Asia Cup Filling Machines Market Value (US$ Mn) Analysis, by Capacity, 2014H-2029F
Table 56: East Asia Cup Filling Machines Market Volume (Units) Analysis, by Capacity, 2014H-2029F
Table 57: East Asia Cup Filling Machines Market Value (US$ Mn) Analysis, by End-use, 2014H-2029F
Table 58: East Asia Cup Filling Machines Market Volume (Units) Analysis, by End-use, 2014H-2029F
Table 59: East Asia Cup Filling Machines Market Value (US$ Mn) Analysis, by Country, 2014H-2029F
Table 60: East Asia Cup Filling Machines Market Volume (Units) Analysis, by Country, 2014H-2029F
Table 61: Oceania Cup Filling Machines Market Value (US$ Mn) Analysis, by Technology, 2014H-2029F
Table 62: Oceania Cup Filling Machines Market Volume (Units) Analysis, by Technology, 2014H-2029F
Table 63: Oceania Cup Filling Machines Market Value (US$ Mn) Analysis, by Machine Type, 2014H-2029F
Table 64: Oceania Cup Filling Machines Market Volume (Units) Analysis, by Machine Type, 2014H-2029F
Table 65: Oceania Cup Filling Machines Market Value (US$ Mn) Analysis, by Capacity, 2014H-2029F
Table 66: Oceania Cup Filling Machines Market Volume (Units) Analysis, by Capacity, 2014H-2029F
Table 67: Oceania Cup Filling Machines Market Value (US$ Mn) Analysis, by End-use, 2014H-2029F
Table 68: Oceania Cup Filling Machines Market Volume (Units) Analysis, by End-use, 2014H-2029F
Table 69: Oceania Cup Filling Machines Market Value (US$ Mn) Analysis, by Country, 2014H-2029F
Table 70: Oceania Cup Filling Machines Market Volume (Units) Analysis, by Country, 2014H-2029F
Table 71: MEA Cup Filling Machines Market Value (US$ Mn) Analysis, by Technology, 2014H-2029F
Table 72: MEA Cup Filling Machines Market Volume (Units) Analysis, by Technology, 2014H-2029F
Table 73: MEA Cup Filling Machines Market Value (US$ Mn) Analysis, by Machine Type, 2014H-2029F
Table 74: MEA Cup Filling Machines Market Volume (Units) Analysis, by Machine Type, 2014H-2029F
Table 75: MEA Cup Filling Machines Market Value (US$ Mn) Analysis, by Capacity, 2014H-2029F
Table 76: MEA Cup Filling Machines Market Volume (Units) Analysis, by Capacity, 2014H-2029F
Table 77: MEA Cup Filling Machines Market Value (US$ Mn) Analysis, by End-use, 2014H-2029F
Table 78: MEA Cup Filling Machines Market Volume (Units) Analysis, by End-use, 2014H-2029F
Table 79: MEA Cup Filling Machines Market Value (US$ Mn) Analysis, by Country, 2014H-2029F
Table 80: MEA Cup Filling Machines Market Volume (Units) Analysis, by Country, 2014H-2029F
Find your sweet spots for generating winning opportunities in this market.
Talk to AnalystList of Charts
Figure 01: Global Cup Filling Machines Market Share Analysis by Technology, 2022E & 2029F
Figure 02: Global Cup Filling Machines Market Y-o-Y Analysis by Technology, 2019H-2029F
Figure 03: Global Cup Filling Machines Market Attractiveness Analysis by Technology, 2022E-2029F
Figure 04: Global Cup Filling Machines Market Share Analysis by Machine Type, 2022E & 2029F
Figure 05: Global Cup Filling Machines Market Y-o-Y Analysis by Machine Type, 2019H-2029F
Figure 06: Global Cup Filling Machines Market Attractiveness Analysis by Machine Type, 2022E-2029F
Figure 07: Global Cup Filling Machines Market Share Analysis by Capacity, 2022E & 2029F
Figure 08: Global Cup Filling Machines Market Y-o-Y Analysis by Capacity, 2019H-2029F
Figure 09: Global Cup Filling Machines Market Attractiveness Analysis by Capacity, 2022E-2029F
Figure 10: Global Cup Filling Machines Market Share Analysis by End-use, 2022E & 2029F
Figure 11: Global Cup Filling Machines Market Y-o-Y Analysis by End-use, 2019H-2029F
Figure 12: Global Cup Filling Machines Market Attractiveness Analysis by End-use, 2022E-2029F
Figure 13: Global Cup Filling Machines Market Share Analysis by Region, 2022E & 2029F
Figure 14: Global Cup Filling Machines Market Y-o-Y Analysis by Region, 2019H-2029F
Figure 15: Global Cup Filling Machines Market Attractiveness Analysis by Region, 2022E-2029F
Figure 16: North America Cup Filling Machines Market Share Analysis by Technology, 2022E & 2029F
Figure 17: North America Cup Filling Machines Market Share Analysis by Machine Type 2022(E)
Figure 18: North America Cup Filling Machines Market Share Analysis by Capacity 2022(E)
Figure 19: North America Cup Filling Machines Market Attractiveness Analysis by End-use, 2022E-2029F
Figure 20: North America Cup Filling Machines Market Value Share Analysis by Country 2022(E)
Figure 21: Latin America Cup Filling Machines Market Share Analysis by Technology, 2022E & 2029F
Figure 22: Latin America Cup Filling Machines Market Share Analysis by Machine Type 2022(E)
Figure 23: Latin America Cup Filling Machines Market Share Analysis by Capacity 2022(E)
Figure 24: Latin America Cup Filling Machines Market Attractiveness Analysis by End-use, 2022E-2029F
Figure 25: Latin America Cup Filling Machines Market Value Share Analysis by Country 2022(E)
Figure 26: Europe Cup Filling Machines Market Share Analysis by Technology, 2022E & 2029F
Figure 27: Europe Cup Filling Machines Market Share Analysis by Machine Type 2022(E)
Figure 28: Europe Cup Filling Machines Market Share Analysis by Capacity 2022(E)
Figure 29: Europe Cup Filling Machines Market Attractiveness Analysis by End-use, 2022E-2029F
Figure 30: Europe Cup Filling Machines Market Value Share Analysis by Country 2022(E)
Figure 31: South Asia Cup Filling Machines Market Share Analysis by Technology, 2022E & 2029F
Figure 32: South Asia Cup Filling Machines Market Share Analysis by Machine Type 2022(E)
Figure 33: South Asia Filling Machines Market Share Analysis by Capacity 2022(E)
Figure 34: South Asia Cup Filling Machines Market Attractiveness Analysis by End-use, 2022E-2029F
Figure 35: South Asia Cup Filling Machines Market Value Share Analysis by Country 2022(E)
Figure 36: East Asia Cup Filling Machines Market Share Analysis by Technology, 2022E & 2029F
Figure 37: East Asia Cup Filling Machines Market Share Analysis by Machine Type 2022(E)
Figure 38: East Asia Cup Filling Machines Market Share Analysis by Capacity 2022(E)
Figure 39: East Asia Cup Filling Machines Market Attractiveness Analysis by End-use, 2022E-2029F
Figure 40: East Asia Cup Filling Machines Market Value Share Analysis by Country 2022(E)
Figure 41: Oceania Cup Filling Machines Market Share Analysis by Technology, 2022E & 2029F
Figure 42: Oceania Cup Filling Machines Market Share Analysis by Machine Type 2022(E)
Figure 43: Oceania Cup Filling Machines Market Share Analysis by Capacity 2022(E)
Figure 44: Oceania Cup Filling Machines Market Attractiveness Analysis by End-use, 2022E-2029F
Figure 45: Oceania Cup Filling Machines Market Value Share Analysis by Country 2022(E)
Figure 46: MEA Cup Filling Machines Market Share Analysis by Technology, 2022E & 2029F
Figure 47: MEA Cup Filling Machines Market Share Analysis by Machine Type 2022(E)
Figure 48: MEA Cup Filling Machines Market Share Analysis by Capacity 2022(E)
Figure 49: MEA Cup Filling Machines Market Attractiveness Analysis by End-use, 2022E-2029F
Figure 50: MEA Cup Filling Machines Market Value Share Analysis by Country 2022(E)
Figure 51: U.S. Cup Filling Machines Market Value Share Analysis, by Technology, 2022(E) & 2029(F)
Figure 52: U.S. Cup Filling Machines Market Value Share Analysis, by Machine Type, 2022(E)
Figure 53: U.S. Cup Filling Machines Market Value Share Analysis, by Capacity, 2022(E)
Figure 54: U.S. Cup Filling Machines Market Value Share Analysis, by End-use, 2022(E)
Figure 55: Brazil Cup Filling Machines Market Value Share Analysis, by Technology, 2022(E) & 2029(F)
Figure 56: Brazil Cup Filling Machines Market Value Share Analysis, by Machine Type, 2022(E)
Figure 57: Brazil Cup Filling Machines Market Value Share Analysis, by Capacity, 2022(E)
Figure 58: Brazil Cup Filling Machines Market Value Share Analysis, by End-use, 2022(E)
Figure 59: Mexico Cup Filling Machines Market Value Share Analysis, by Technology, 2022(E) & 2029(F)
Figure 60: Mexico Cup Filling Machines Market Value Share Analysis, by Machine Type, 2022(E)
Figure 61: Mexico Cup Filling Machines Market Value Share Analysis, by Capacity, 2022(E)
Figure 62: Mexico Cup Filling Machines Market Value Share Analysis, by End-use, 2022(E)
Figure 63: Germany Cup Filling Machines Market Value Share Analysis, by Technology, 2022(E) & 2029(F)
Figure 64: Germany Cup Filling Machines Market Value Share Analysis, by Machine Type, 2022(E)
Figure 65: Germany Cup Filling Machines Market Value Share Analysis, by Capacity, 2022(E)
Figure 66: Germany Cup Filling Machines Market Value Share Analysis, by End-use, 2022(E)
Figure 67: Spain Cup Filling Machines Market Value Share Analysis, by Technology, 2022(E) & 2029(F)
Figure 68: Spain Cup Filling Machines Market Value Share Analysis, by Machine Type, 2022(E)
Figure 69: Spain Cup Filling Machines Market Value Share Analysis, by Capacity, 2022(E)
Figure 70: Spain Cup Filling Machines Market Value Share Analysis, by End-use, 2022(E)
Figure 71: Italy Cup Filling Machines Market Value Share Analysis, by Technology, 2022(E) & 2029(F)
Figure 72: Italy Cup Filling Machines Market Value Share Analysis, by Machine Type, 2022(E)
Figure 73: Italy Cup Filling Machines Market Value Share Analysis, by Capacity, 2022(E)
Figure 74: Italy Cup Filling Machines Market Value Share Analysis, by End-use, 2022(E)
Figure 75: France Cup Filling Machines Market Value Share Analysis, by Technology, 2022(E) & 2029(F)
Figure 76: France Cup Filling Machines Market Value Share Analysis, by Machine Type, 2022(E)
Figure 77: France Cup Filling Machines Market Value Share Analysis, by Capacity, 2022(E)
Figure 78: France Cup Filling Machines Market Value Share Analysis, by End-use, 2022(E)
Figure 79: UK Cup Filling Machines Market Value Share Analysis, by Technology, 2022(E) & 2029(F)
Figure 80: UK Cup Filling Machines Market Value Share Analysis, by Machine Type, 2022(E)
Figure 81: UK Cup Filling Machines Market Value Share Analysis, by Capacity, 2022(E)
Figure 82: UK Cup Filling Machines Market Value Share Analysis, by End-use, 2022(E)
Figure 83: Russia Cup Filling Machines Market Value Share Analysis, by Technology, 2022(E) & 2029(F)
Figure 84: Russia Cup Filling Machines Market Value Share Analysis, by Machine Type, 2022(E)
Figure 85: Russia Cup Filling Machines Market Value Share Analysis, by Capacity, 2022(E)
Figure 86: Russia Cup Filling Machines Market Value Share Analysis, by End-use, 2022E)
Figure 87: China Cup Filling Machines Market Value Share Analysis, by Technology, 2022(E) & 2029(F)
Figure 89: China Cup Filling Machines Market Value Share Analysis, by Machine Type, 2022(E)
Figure 90: China Cup Filling Machines Market Value Share Analysis, by Capacity, 2022(E)
Figure 91: China Cup Filling Machines Market Value Share Analysis, by End-use, 2022(E)
Figure 92: Japan Cup Filling Machines Market Value Share Analysis, by Technology, 2022(E) & 2029(F)
Figure 93: Japan Cup Filling Machines Market Value Share Analysis, by Machine Type, 2022(E)
Figure 94: Japan Cup Filling Machines Market Value Share Analysis, by Capacity, 2022(E)
Figure 95: Japan Cup Filling Machines Market Value Share Analysis, by End-use, 2022(E)
Figure 96: India Cup Filling Machines Market Value Share Analysis, by Technology, 2022(E) & 2029(F)
Figure 97: India Cup Filling Machines Market Value Share Analysis, by Machine Type, 2022(E)
Figure 98: India Cup Filling Machines Market Value Share Analysis, by Capacity, 2022(E)
Figure 99: India Cup Filling Machines Market Value Share Analysis, by End-use, 2022(E)
Figure 100: Australia Cup Filling Machines Market Value Share Analysis, by Technology, 2022(E) & 2029(F)
Figure 101: Australia Cup Filling Machines Market Value Share Analysis, by Machine Type, 2022(E)
Figure 102: Australia Cup Filling Machines Market Value Share Analysis, by Capacity, 2022(E)
Figure 103: Australia Cup Filling Machines Market Value Share Analysis, by End-use, 2022(E)
Figure 104: GCC Countries Cup Filling Machines Market Value Share Analysis, by Technology, 2022(E) & 2029(F)
Figure 105: GCC Countries Cup Filling Machines Market Value Share Analysis, by Machine Type, 2022(E)
Figure 106: GCC Countries Cup Filling Machines Market Value Share Analysis, by Capacity, 2022(E)
Figure 107: GCC Countries Cup Filling Machines Market Value Share Analysis, by End-use, 2022(E)
Figure 108: South Africa Cup Filling Machines Market Value Share Analysis, by Technology, 2022(E) & 2029(F)
Figure 109: South Africa Cup Filling Machines Market Value Share Analysis, by Machine Type, 2022(E)
Figure 110: South Africa Cup Filling Machines Market Value Share Analysis, by Capacity, 2022(E)
Figure 111: South Africa Cup Filling Machines Market Value Share Analysis, by End-use, 2022(E)
Need specific information?
Request CustomizationExplore Packaging Insights
View Reports