Cup Carriers Market
How Cup Carriers Are Emerging as Frontrunners in Sustainable Packaging. FMI Explores Key Trends!
Cup Carriers Market by Material, Carrying Capacity, End Use & Region - Forecast 2022 – 2032
Cup Carriers Market Outlook (2022-2032)
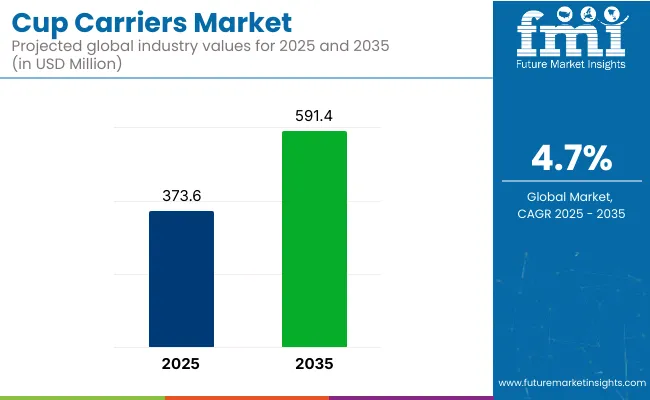
[164 Pages Report] The global cup carriers market was valued at around US$ 308.0 Mn in 2021. Cup carriers’ sales are projected to increase at a healthy CAGR of 5.1% over the forecast period, to reach a valuation of US$ 528.5 Mn by 2032.
Attributes |
Key Insights |
Cup Carriers Market Estimated Size (2022E) |
US$ 320.9 Mn |
Projected Market Valuation (2032F) |
US$ 528.5 Mn |
Value-based CAGR (2022-2032) |
5.1% |
Top 3 Countries Market Share |
46% |
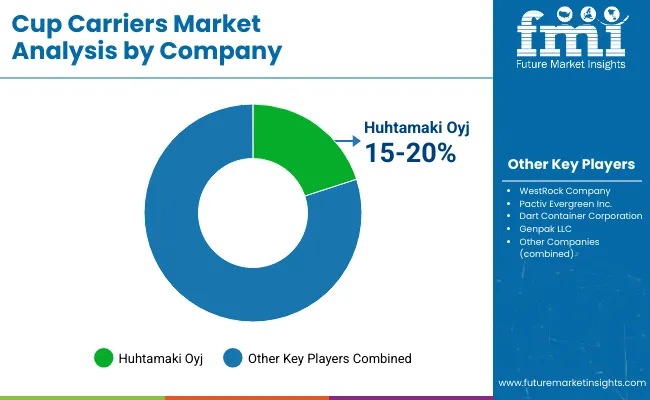
The molded fiber cup carriers market revenue totalled US$ 118.3 Mn in 2021. The demand for molded fiber cup carriers will accelerate with top 5 providers holding 10-15% of cup carriers market in 2022.
Molded pulp is made from recycled paperboard and newspapers. It is also considered as sustainable packaging material. Molded pulp and paper cup carriers are non-toxic and 100% recyclable. Plastic cup carriers offer better strength against heavy loads, which eliminate the risk of product loss and are more protective.
Paper and wood are better options for environmental conservation as they are more eco-friendly. Attributing to this, the paper segment is expected to lead in the global market during the forecast period.
The U.S. cup carriers market is expected to witness an incremental growth of 1.7x during the forecast period. Across North America, total sales of cup carriers are estimated to reach US$ 95.5 Mn by 2022.
Let us know your requirement to get
100% FREE customization
2015-2021 Cup Carriers Market Historic Outlook Vs 2022-2032 Forecast
According to Future Market Insights, the sales of cup carriers market are forecast to increase at a 5.1% CAGR over the assessment period, in comparison to the 3.8% CAGR registered between 2015 to 2021. Looking at the numerous benefits of cup carriers, demand for cup carriers in the industries such as foodservice, institutional, and household will increase. To cater this, manufacturers are increasing the production capabilities of cup carriers and are also trying to innovate their products.
Cup carriers, which are manufactured using materials like paper, wood, and molded pulp, are recyclable and eco-friendly. In addition, plastic cup carriers are good in quality and can handle a good amount of weight. Furthermore, producers are also innovating their products for making them sustainable that are both ecologically friendly and long lasting, resulting in lower carbon footprint.
What is Driving the Global Cup Carriers Market?
“Cup Carriers are Actively Being Used for Online Food Delivery Services”
The ongoing expansion in the beverage market and the trend of online delivery services are expected to boost sales of cup carriers. The trend of online food delivery has increased after the pandemic and is expected to continue over the forecast period. Cup carriers are a good solution for the delivery of liquid substances and are available in various sizes and materials.
In addition, cup carriers made from paper, wood and molded pulp are renewable, sustainable, and eco- friendly, thereby making it easier for the customer as well as suppliers to use them.
Nowadays, both government and end users are very conscious of the environment. End users are now preferring products which are more eco-friendly as compared traditional products. Cup carriers made up of materials like wood, paper and molded pulp have created an opportunity for sustainable growth.
Find your sweet spots for generating winning opportunities in this market.
Talk to AnalystCountry-wise insights
How is the Germany Cup Carriers Market Faring?
“Manufacturers in Germany are Preferring Cardboard Cup Holders”
According to the Germany Trade & Invest (GTAI), like most business sectors worldwide, the food and beverage market was impacted most by the pandemic. However, growing national retail sales helped in the recovery. There was significant growth seen in the revenue of food retailing by around 8%, reaching US$ 250.2 Bn in the year 2020. In the Germany market, more than one seventy thousand-food products are available to the customer.
The demand for the cup carriers is expected to increase due to significant growth in the food and beverage sector. As per the report, the Germany cup carriers market will create an incremental opportunity of US$ 17.2 Mn by the end of 2032.
Why is the China Cup Carriers Market Considered Lucrative?
“High Demand for Reusable Cup Carriers in China Will Fuel Growth”
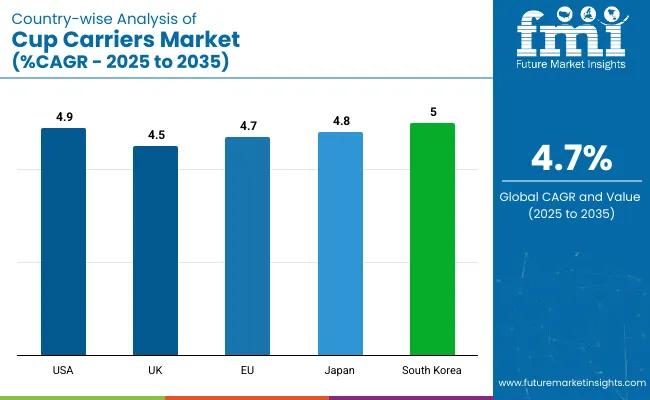
As per FMI, sales of cup carriers in China increased at a 3.5% CAGR during the historic period 2015-2021 and is expected to increase at a 5.9% CAGR over the forecast period.
According to the World Health Organization (WHO), in 2019, the alcohol consumption per capita was around 6.04 litres in China. The demand of cup carriers is expected to increase due to high production and consumption rates of alcohol and other beverages.
Category-wise Insights
Which Material Type is More Preferred by Cup Carriers Manufacturers?
“Demand for Molded Fiber Cups to Remain High”
Based on material type, the molded fiber cup carriers segment will account for 36.5% of the total market share, with sales growing at a 4.6% CAGR over the forecast period. One of the main factors contributing to its high usage is highly biodegradable and reliable protection to the products. Additionally, molded fiber cup carriers are cost-competitive, water-resistant, and are unaffected by extreme temperatures which improve their applicability.
Which is the Leading End-Use of Cup Carriers?
“Sales of Cup Carries in the Foodservice Sector Will Gain Traction”
Foodservice, institutional and household are among the industries that use cup carriers. However, in 2032, the foodservice application sector is anticipated to account for a lion’s share in the market.
Expansion in the foodservice sector is expected to boost the entire market by more than 300 basis points in the forthcoming years. Foodservice has developed a lot with new business outlets and takeaway systems, which is beneficial to the cup carriers market.

A unified Market Research Subscription Platform, built for today's disparate research needs.
Competitive Landscape
Since there are so many local and regional competitors, the global cup carriers market is competitive. Key players use a variety of marketing techniques, including mergers & acquisitions, expansions, collaborations, and partnerships.
Leading organisations also use new product creation as a strategic way to improve their presence in the market. Advanced cup carriers have been incorporated as a result of these strategies. Some of the recent developments in the market are:
- Huhtamaki came up with a Huhtamaki Future SmartTM paper cup that is the first paper cup, which is 100% renewable, which is made from plants and through this, it has significantly tried to reduce the environmental issues.
- Recently, WestRock Company has announced a partnership with company named Recipe Unlimited for better recyclable paperboard packaging, with the motive of diverting 31 million plastic containers.
Scope of the Report
Attribute |
Details |
Estimated Market Size (2022) |
US$ 320.9 Mn |
Projected Market Valuation (2032) |
US$ 528.5 Mn |
Value-based CAGR (2022-2032) |
5.1% |
Forecast Period |
2022-2032 |
Historical Data Available for |
2015-2021 |
Market Analysis |
Value (In US$ Mn) and Volume (In Tonnes) |
Key Countries Covered |
The U.S., Canada, Mexico, Brazil, Germany, the U.K., France, Italy, Spain, Russia, China, Japan, India, GCC countries, and Australia |
Key Regions Covered |
North America, Latin America, Europe, East Asia, South Asia, the Middle East & Africa, and Oceania |
Key Segments Covered |
Material, Carrying Capacity, End Use and Region. |
Key Companies Profiled |
|
Report Coverage |
Market Forecast, Company Share Analysis, Competition Intelligence, DROT Analysis, Market Dynamics and Challenges, and Strategic Growth Initiatives |
Global Cup Carriers Market by Category
Material:
- Plastic
- Paper
- Wood
- Molded Pulp
Carrying Capacity:
- Single Cup
- 02 Cups to 04 Cups
- Above 4 Cups
End Use:
- Foodservice
- Quick Service Restaurant
- Hotels
- Restaurants
- Cafes
- Others
- Institutional
- Household
Region:
- North America
- Latin America
- Europe
- South Asia
- East Asia
- Middle East & Africa
- Oceania
Frequently Asked Questions
The global cup carriers market size was valued at US$ 308 Mn in 2021 and is expected to increase at a 5.1% CAGR from 2022 to 2032.
During the forecast period, paper is likely to be the fastest-growing material type in the global cup carriers market.
Developments in the food and beverage and an increase in restaurant takeaways are expected to boost the market.
02 Cups to 04 Cups capacity segment will reach a valuation of US$ 243.9 Mn in 2022.
Table of Content
1. Executive Summary
1.1. Global Market Outlook
1.2. Demand-side Trends
1.3. Supply-side Trends
1.4. Technology Roadmap Analysis
1.5. Analysis and Recommendations
2. Market Overview
2.1. Market Coverage / Taxonomy
2.2. Market Definition / Scope / Limitations
3. Market Background
3.1. Market Dynamics
3.1.1. Drivers
3.1.2. Restraints
3.1.3. Opportunity
3.1.4. Trends
3.2. Scenario Forecast
3.2.1. Demand in Optimistic Scenario
3.2.2. Demand in Likely Scenario
3.2.3. Demand in Conservative Scenario
3.3. Opportunity Map Analysis
3.4. Product Life Cycle Analysis
3.5. Supply Chain Analysis
3.5.1. Supply Side Participants and their Roles
3.5.1.1. Producers
3.5.1.2. Mid-Level Participants (Traders/ Agents/ Brokers)
3.5.1.3. Wholesalers and Distributors
3.5.2. Value Added and Value Created at Node in the Supply Chain
3.5.3. List of Raw Material Suppliers
3.5.4. List of Existing and Potential Buyer’s
3.6. Value Chain Analysis
3.6.1. Profit Margin Analysis
3.6.2. Wholesalers and Distributors
3.7. Regulatory Landscape
3.7.1. By Key Regions
3.7.2. By Key Countries
3.8. Regional Parent Market Outlook
3.9. Production and Consumption Statistics
3.10. Import and Export Statistics
4. Global Market Analysis 2015-2021 and Forecast, 2022-2032
4.1. Historical Market Size Value (US$ Mn) & Volume (Tonnes) Analysis, 2015-2021
4.2. Current and Future Market Size Value (US$ Mn) & Volume (Tonnes) Projections, 2022-2032
4.2.1. Y-o-Y Growth Trend Analysis
4.2.2. Absolute $ Opportunity Analysis
5. Global Market Analysis 2015-2021 and Forecast 2022-2032, By Material
5.1. Introduction / Key Findings
5.2. Historical Market Size Value (US$ Mn) & Volume (Tonnes) Analysis By Material, 2015-2021
5.3. Current and Future Market Size Value (US$ Mn) & Volume (Tonnes) Analysis and Forecast By Material, 2022-2032
5.3.1. Plastic
5.3.2. Paper
5.3.3. Wood
5.3.4. Molded Pulp
5.4. Y-o-Y Growth Trend Analysis By Material, 2015-2021
5.5. Absolute $ Opportunity Analysis By Material, 2022-2032
6. Global Market Analysis 2015-2021 and Forecast 2022-2032, By Carrying Capacity
6.1. Introduction / Key Findings
6.2. Historical Market Size Value (US$ Mn) & Volume (Tonnes) Analysis By Carrying Capacity, 2015-2021
6.3. Current and Future Market Size Value (US$ Mn) & Volume (Tonnes) Analysis and Forecast By Carrying Capacity, 2022-2032
6.3.1. Single Cup
6.3.2. 02 to 04 Cups
6.3.3. Above 04 Cups
6.4. Y-o-Y Growth Trend Analysis By Carrying Capacity, 2015-2021
6.5. Absolute $ Opportunity Analysis By Carrying Capacity, 2022-2032
7. Global Market Analysis 2015-2021 and Forecast 2022-2032, By End Use
7.1. Introduction / Key Findings
7.2. Historical Market Size Value (US$ Mn) & Volume (Tonnes) Analysis By End Use, 2015-2021
7.3. Current and Future Market Size Value (US$ Mn) & Volume (Tonnes) Analysis and Forecast By End Use, 2022-2032
7.3.1. Food Service
7.3.1.1. Quick Service Restaurants
7.3.1.2. Hotels
7.3.1.3. Restaurants
7.3.1.4. Cafes
7.3.1.5. Others
7.3.2. Institutional
7.3.3. Household
7.4. Y-o-Y Growth Trend Analysis By End Use, 2015-2021
7.5. Absolute $ Opportunity Analysis By End Use, 2022-2032
8. Global Market Analysis 2015-2021 and Forecast 2022-2032, By Region
8.1. Introduction
8.2. Historical Market Size Value (US$ Mn) & Volume (Tonnes) Analysis By Region, 2015-2021
8.3. Current Market Size Value (US$ Mn) & Volume (Tonnes) Analysis and Forecast By Region, 2022-2032
8.3.1. North America
8.3.2. Latin America
8.3.3. Europe
8.3.4. East Asia
8.3.5. South Asia
8.3.6. Oceania
8.3.7. MEA
8.4. Market Attractiveness Analysis By Region
9. North America Market Analysis 2015-2021 and Forecast 2022-2032, By Country
9.1. Historical Market Size Value (US$ Mn) & Volume (Tonnes) Trend Analysis By Market Taxonomy, 2015-2021
9.2. Market Size Value (US$ Mn) & Volume (Tonnes) Forecast By Market Taxonomy, 2022-2032
9.2.1. By Country
9.2.1.1. U.S.
9.2.1.2. Canada
9.2.2. By Material
9.2.3. By Carrying Capacity
9.2.4. By End Use
9.3. Market Attractiveness Analysis
9.3.1. By Country
9.3.2. By Material
9.3.3. By Carrying Capacity
9.3.4. By End Use
9.4. Key Takeaways
10. Latin America Market Analysis 2015-2021 and Forecast 2022-2032, By Country
10.1. Historical Market Size Value (US$ Mn) & Volume (Tonnes) Trend Analysis By Market Taxonomy, 2015-2021
10.2. Market Size Value (US$ Mn) & Volume (Tonnes) Forecast By Market Taxonomy, 2022-2032
10.2.1. By Country
10.2.1.1. Brazil
10.2.1.2. Mexico
10.2.1.3. Argentina
10.2.1.4. Chile
10.2.1.5. Peru
10.2.1.6. Rest of Latin America
10.2.2. By Material
10.2.3. By Carrying Capacity
10.2.4. By End Use
10.3. Market Attractiveness Analysis
10.3.1. By Country
10.3.2. By Material
10.3.3. By Carrying Capacity
10.3.4. By End Use
10.4. Key Takeaways
11. Europe Market Analysis 2015-2021 and Forecast 2022-2032, By Country
11.1. Historical Market Size Value (US$ Mn) & Volume (Tonnes) Trend Analysis By Market Taxonomy, 2015-2021
11.2. Market Size Value (US$ Mn) & Volume (Tonnes) Forecast By Market Taxonomy, 2022-2032
11.2.1. By Country
11.2.1.1. Germany
11.2.1.2. Italy
11.2.1.3. France
11.2.1.4. U.K.
11.2.1.5. Spain
11.2.1.6. Russia
11.2.1.7. BENELUX
11.2.1.8. Rest of Europe
11.2.2. By Material
11.2.3. By Carrying Capacity
11.2.4. By End Use
11.3. Market Attractiveness Analysis
11.3.1. By Country
11.3.2. By Material
11.3.3. By Carrying Capacity
11.3.4. By End Use
11.4. Key Takeaways
12. East Asia Market Analysis 2015-2021 and Forecast 2022-2032, By Country
12.1. Historical Market Size Value (US$ Mn) & Volume (Tonnes) Trend Analysis By Market Taxonomy, 2015-2021
12.2. Market Size Value (US$ Mn) & Volume (Tonnes) Forecast By Market Taxonomy, 2022-2032
12.2.1. By Country
12.2.1.1. China
12.2.1.2. Japan
12.2.1.3. South Korea
12.2.2. By Material
12.2.3. By Carrying Capacity
12.2.4. By End Use
12.3. Market Attractiveness Analysis
12.3.1. By Country
12.3.2. By Material
12.3.3. By Carrying Capacity
12.3.4. By End Use
12.4. Key Takeaways
13. South Asia Market Analysis 2015-2021 and Forecast 2022-2032, By Country
13.1. Historical Market Size Value (US$ Mn) & Volume (Tonnes) Trend Analysis By Market Taxonomy, 2015-2021
13.2. Market Size Value (US$ Mn) & Volume (Tonnes) Forecast By Market Taxonomy, 2022-2032
13.2.1. By Country
13.2.1.1. India
13.2.1.2. Thailand
13.2.1.3. Malaysia
13.2.1.4. Indonesia
13.2.1.5. Rest of South Asia
13.2.2. By Material
13.2.3. By Carrying Capacity
13.2.4. By End Use
13.3. Market Attractiveness Analysis
13.3.1. By Country
13.3.2. By Material
13.3.3. By Carrying Capacity
13.3.4. By End Use
13.4. Key Takeaways
14. Oceania Market Analysis 2015-2021 and Forecast 2022-2032, By Country
14.1. Historical Market Size Value (US$ Mn) & Volume (Tonnes) Trend Analysis By Market Taxonomy, 2015-2021
14.2. Market Size Value (US$ Mn) & Volume (Tonnes) Forecast By Market Taxonomy, 2022-2032
14.2.1. By Country
14.2.1.1. Australia
14.2.1.2. New Zealand
14.2.2. By Material
14.2.3. By Carrying Capacity
14.2.4. By End Use
14.3. Market Attractiveness Analysis
14.3.1. By Country
14.3.2. By Material
14.3.3. By Carrying Capacity
14.3.4. By End Use
14.4. Key Takeaways
15. MEA Market Analysis 2015-2021 and Forecast 2022-2032, By Country
15.1. Historical Market Size Value (US$ Mn) & Volume (Tonnes) Trend Analysis By Market Taxonomy, 2015-2021
15.2. Market Size Value (US$ Mn) & Volume (Tonnes) Forecast By Market Taxonomy, 2022-2032
15.2.1. By Country
15.2.1.1. GCC
15.2.1.2. Rest of MEA
15.2.2. By Material
15.2.3. By Carrying Capacity
15.2.4. By End Use
15.3. Market Attractiveness Analysis
15.3.1. By Country
15.3.2. By Material
15.3.3. By Carrying Capacity
15.3.4. By End Use
15.4. Key Takeaways
16. Key Countries Market Analysis
16.1. U.S.
16.1.1. Pricing Analysis
16.1.2. Market Share Analysis, 2021
16.1.2.1. By Material
16.1.2.2. By Carrying Capacity
16.1.2.3. By End Use
16.2. Canada
16.2.1. Pricing Analysis
16.2.2. Market Share Analysis, 2021
16.2.2.1. By Material
16.2.2.2. By Carrying Capacity
16.2.2.3. By End Use
16.3. Brazil
16.3.1. Pricing Analysis
16.3.2. Market Share Analysis, 2021
16.3.2.1. By Material
16.3.2.2. By Carrying Capacity
16.3.2.3. By End Use
16.4. Mexico
16.4.1. Pricing Analysis
16.4.2. Market Share Analysis, 2021
16.4.2.1. By Material
16.4.2.2. By Carrying Capacity
16.4.2.3. By End Use
16.5. Argentina
16.5.1. Pricing Analysis
16.5.2. Market Share Analysis, 2021
16.5.2.1. By Material
16.5.2.2. By Carrying Capacity
16.5.2.3. By End Use
16.6. Germany
16.6.1. Pricing Analysis
16.6.2. Market Share Analysis, 2021
16.6.2.1. By Material
16.6.2.2. By Carrying Capacity
16.6.2.3. By End Use
16.7. Italy
16.7.1. Pricing Analysis
16.7.2. Market Share Analysis, 2021
16.7.2.1. By Material
16.7.2.2. By Carrying Capacity
16.7.2.3. By End Use
16.8. France
16.8.1. Pricing Analysis
16.8.2. Market Share Analysis, 2021
16.8.2.1. By Material
16.8.2.2. By Carrying Capacity
16.8.2.3. By End Use
16.9. U.K.
16.9.1. Pricing Analysis
16.9.2. Market Share Analysis, 2021
16.9.2.1. By Material
16.9.2.2. By Carrying Capacity
16.9.2.3. By End Use
16.10. Spain
16.10.1. Pricing Analysis
16.10.2. Market Share Analysis, 2021
16.10.2.1. By Material
16.10.2.2. By Carrying Capacity
16.10.2.3. By End Use
16.11. Russia
16.11.1. Pricing Analysis
16.11.2. Market Share Analysis, 2021
16.11.2.1. By Material
16.11.2.2. By Carrying Capacity
16.11.2.3. By End Use
16.12. China
16.12.1. Pricing Analysis
16.12.2. Market Share Analysis, 2021
16.12.2.1. By Material
16.12.2.2. By Carrying Capacity
16.12.2.3. By End Use
16.13. Japan
16.13.1. Pricing Analysis
16.13.2. Market Share Analysis, 2021
16.13.2.1. By Material
16.13.2.2. By Carrying Capacity
16.13.2.3. By End Use
16.14. India
16.14.1. Pricing Analysis
16.14.2. Market Share Analysis, 2021
16.14.2.1. By Material
16.14.2.2. By Carrying Capacity
16.14.2.3. By End Use
16.15. Australia
16.15.1. Pricing Analysis
16.15.2. Market Share Analysis, 2021
16.15.2.1. By Material
16.15.2.2. By Carrying Capacity
16.15.2.3. By End Use
16.16. New Zealand
16.16.1. Pricing Analysis
16.16.2. Market Share Analysis, 2021
16.16.2.1. By Material
16.16.2.2. By Carrying Capacity
16.16.2.3. By End Use
16.17. GCC
16.17.1. Pricing Analysis
16.17.2. Market Share Analysis, 2021
16.17.2.1. By Material
16.17.2.2. By Carrying Capacity
16.17.2.3. By End Use
17. Market Structure Analysis
17.1. Competition Dashboard
17.2. Competition Benchmarking
18. Competition Analysis
18.1. Competition Deep Dive
18.1.1. MULTIPAP
18.1.1.1. Overview
18.1.1.2. Product Portfolio
18.1.1.3. Profitability by Market Segments
18.1.1.4. Sales Footprint
18.1.1.5. Strategy Overview
18.1.1.5.1. Marketing Strategy
18.1.1.5.2. Product Strategy
18.1.1.5.3. Channel Strategy
18.1.2. Green Paper Products, LLC.
18.1.2.1. Overview
18.1.2.2. Product Portfolio
18.1.2.3. Profitability by Market Segments
18.1.2.4. Sales Footprint
18.1.2.5. Strategy Overview
18.1.2.5.1. Marketing Strategy
18.1.2.5.2. Product Strategy
18.1.2.5.3. Channel Strategy
18.1.3. Huhtamäki Oyj
18.1.3.1. Overview
18.1.3.2. Product Portfolio
18.1.3.3. Profitability by Market Segments
18.1.3.4. Sales Footprint
18.1.3.5. Strategy Overview
18.1.3.5.1. Marketing Strategy
18.1.3.5.2. Product Strategy
18.1.3.5.3. Channel Strategy
18.1.4. Georgia-Pacific Consumer Products LP
18.1.4.1. Overview
18.1.4.2. Product Portfolio
18.1.4.3. Profitability by Market Segments
18.1.4.4. Sales Footprint
18.1.4.5. Strategy Overview
18.1.4.5.1. Marketing Strategy
18.1.4.5.2. Product Strategy
18.1.4.5.3. Channel Strategy
18.1.5. Sabert Corporation
18.1.5.1. Overview
18.1.5.2. Product Portfolio
18.1.5.3. Profitability by Market Segments
18.1.5.4. Sales Footprint
18.1.5.5. Strategy Overview
18.1.5.5.1. Marketing Strategy
18.1.5.5.2. Product Strategy
18.1.5.5.3. Channel Strategy
18.1.6. Pactiv LLC
18.1.6.1. Overview
18.1.6.2. Product Portfolio
18.1.6.3. Profitability by Market Segments
18.1.6.4. Sales Footprint
18.1.6.5. Strategy Overview
18.1.6.5.1. Marketing Strategy
18.1.6.5.2. Product Strategy
18.1.6.5.3. Channel Strategy
18.1.7. Southern Champion Tray, LP
18.1.7.1. Overview
18.1.7.2. Product Portfolio
18.1.7.3. Profitability by Market Segments
18.1.7.4. Sales Footprint
18.1.7.5. Strategy Overview
18.1.7.5.1. Marketing Strategy
18.1.7.5.2. Product Strategy
18.1.7.5.3. Channel Strategy
18.1.8. Graphic Packaging International, LLC
18.1.8.1. Overview
18.1.8.2. Product Portfolio
18.1.8.3. Profitability by Market Segments
18.1.8.4. Sales Footprint
18.1.8.5. Strategy Overview
18.1.8.5.1. Marketing Strategy
18.1.8.5.2. Product Strategy
18.1.8.5.3. Channel Strategy
18.1.9. PakTech
18.1.9.1. Overview
18.1.9.2. Product Portfolio
18.1.9.3. Profitability by Market Segments
18.1.9.4. Sales Footprint
18.1.9.5. Strategy Overview
18.1.9.5.1. Marketing Strategy
18.1.9.5.2. Product Strategy
18.1.9.5.3. Channel Strategy
18.1.10. WestRock Company
18.1.10.1. Overview
18.1.10.2. Product Portfolio
18.1.10.3. Profitability by Market Segments
18.1.10.4. Sales Footprint
18.1.10.5. Strategy Overview
18.1.10.5.1. Marketing Strategy
18.1.10.5.2. Product Strategy
18.1.10.5.3. Channel Strategy
18.1.11. CELLULOPACK SAS
18.1.11.1. Overview
18.1.11.2. Product Portfolio
18.1.11.3. Profitability by Market Segments
18.1.11.4. Sales Footprint
18.1.11.5. Strategy Overview
18.1.11.5.1. Marketing Strategy
18.1.11.5.2. Product Strategy
18.1.11.5.3. Channel Strategy
18.1.12. Cascades inc.
18.1.12.1. Overview
18.1.12.2. Product Portfolio
18.1.12.3. Profitability by Market Segments
18.1.12.4. Sales Footprint
18.1.12.5. Strategy Overview
18.1.12.5.1. Marketing Strategy
18.1.12.5.2. Product Strategy
18.1.12.5.3. Channel Strategy
18.1.13. MULTI-WAYS PACKAGING
18.1.13.1. Overview
18.1.13.2. Product Portfolio
18.1.13.3. Profitability by Market Segments
18.1.13.4. Sales Footprint
18.1.13.5. Strategy Overview
18.1.13.5.1. Marketing Strategy
18.1.13.5.2. Product Strategy
18.1.13.5.3. Channel Strategy
18.1.14. Colpac Ltd.
18.1.14.1. Overview
18.1.14.2. Product Portfolio
18.1.14.3. Profitability by Market Segments
18.1.14.4. Sales Footprint
18.1.14.5. Strategy Overview
18.1.14.5.1. Marketing Strategy
18.1.14.5.2. Product Strategy
18.1.14.5.3. Channel Strategy
18.1.15. Dreamfly Packaging Co.,Ltd
18.1.15.1. Overview
18.1.15.2. Product Portfolio
18.1.15.3. Profitability by Market Segments
18.1.15.4. Sales Footprint
18.1.15.5. Strategy Overview
18.1.15.5.1. Marketing Strategy
18.1.15.5.2. Product Strategy
18.1.15.5.3. Channel Strategy
18.1.16. Napco National
18.1.16.1. Overview
18.1.16.2. Product Portfolio
18.1.16.3. Profitability by Market Segments
18.1.16.4. Sales Footprint
18.1.16.5. Strategy Overview
18.1.16.5.1. Marketing Strategy
18.1.16.5.2. Product Strategy
18.1.16.5.3. Channel Strategy
18.1.17. Detmold Group
18.1.17.1. Overview
18.1.17.2. Product Portfolio
18.1.17.3. Profitability by Market Segments
18.1.17.4. Sales Footprint
18.1.17.5. Strategy Overview
18.1.17.5.1. Marketing Strategy
18.1.17.5.2. Product Strategy
18.1.17.5.3. Channel Strategy
18.1.18. Judin Pack Group
18.1.18.1. Overview
18.1.18.2. Product Portfolio
18.1.18.3. Profitability by Market Segments
18.1.18.4. Sales Footprint
18.1.18.5. Strategy Overview
18.1.18.5.1. Marketing Strategy
18.1.18.5.2. Product Strategy
18.1.18.5.3. Channel Strategy
19. Assumptions & Acronyms Used
20. Research Methodology
Let us know your requirement to get
100% FREE customization
List of Tables
Table 1: Global Market Value (US$ Mn) Forecast by Region, 2015-2032
Table 2: Global Market Volume (Tonnes) Forecast by Region, 2015-2032
Table 3: Global Market Value (US$ Mn) Forecast by Material, 2015-2032
Table 4: Global Market Volume (Tonnes) Forecast by Material, 2015-2032
Table 5: Global Market Value (US$ Mn) Forecast by Carrying Capacity, 2015-2032
Table 6: Global Market Volume (Tonnes) Forecast by Carrying Capacity, 2015-2032
Table 7: Global Market Value (US$ Mn) Forecast by End Use, 2015-2032
Table 8: Global Market Volume (Tonnes) Forecast by End Use, 2015-2032
Table 9: North America Market Value (US$ Mn) Forecast by Country, 2015-2032
Table 10: North America Market Volume (Tonnes) Forecast by Country, 2015-2032
Table 11: North America Market Value (US$ Mn) Forecast by Material, 2015-2032
Table 12: North America Market Volume (Tonnes) Forecast by Material, 2015-2032
Table 13: North America Market Value (US$ Mn) Forecast by Carrying Capacity, 2015-2032
Table 14: North America Market Volume (Tonnes) Forecast by Carrying Capacity, 2015-2032
Table 15: North America Market Value (US$ Mn) Forecast by End Use, 2015-2032
Table 16: North America Market Volume (Tonnes) Forecast by End Use, 2015-2032
Table 17: Latin America Market Value (US$ Mn) Forecast by Country, 2015-2032
Table 18: Latin America Market Volume (Tonnes) Forecast by Country, 2015-2032
Table 19: Latin America Market Value (US$ Mn) Forecast by Material, 2015-2032
Table 20: Latin America Market Volume (Tonnes) Forecast by Material, 2015-2032
Table 21: Latin America Market Value (US$ Mn) Forecast by Carrying Capacity, 2015-2032
Table 22: Latin America Market Volume (Tonnes) Forecast by Carrying Capacity, 2015-2032
Table 23: Latin America Market Value (US$ Mn) Forecast by End Use, 2015-2032
Table 24: Latin America Market Volume (Tonnes) Forecast by End Use, 2015-2032
Table 25: Europe Market Value (US$ Mn) Forecast by Country, 2015-2032
Table 26: Europe Market Volume (Tonnes) Forecast by Country, 2015-2032
Table 27: Europe Market Value (US$ Mn) Forecast by Material, 2015-2032
Table 28: Europe Market Volume (Tonnes) Forecast by Material, 2015-2032
Table 29: Europe Market Value (US$ Mn) Forecast by Carrying Capacity, 2015-2032
Table 30: Europe Market Volume (Tonnes) Forecast by Carrying Capacity, 2015-2032
Table 31: Europe Market Value (US$ Mn) Forecast by End Use, 2015-2032
Table 32: Europe Market Volume (Tonnes) Forecast by End Use, 2015-2032
Table 33: East Asia Market Value (US$ Mn) Forecast by Country, 2015-2032
Table 34: East Asia Market Volume (Tonnes) Forecast by Country, 2015-2032
Table 35: East Asia Market Value (US$ Mn) Forecast by Material, 2015-2032
Table 36: East Asia Market Volume (Tonnes) Forecast by Material, 2015-2032
Table 37: East Asia Market Value (US$ Mn) Forecast by Carrying Capacity, 2015-2032
Table 38: East Asia Market Volume (Tonnes) Forecast by Carrying Capacity, 2015-2032
Table 39: East Asia Market Value (US$ Mn) Forecast by End Use, 2015-2032
Table 40: East Asia Market Volume (Tonnes) Forecast by End Use, 2015-2032
Table 41: South Asia Market Value (US$ Mn) Forecast by Country, 2015-2032
Table 42: South Asia Market Volume (Tonnes) Forecast by Country, 2015-2032
Table 43: South Asia Market Value (US$ Mn) Forecast by Material, 2015-2032
Table 44: South Asia Market Volume (Tonnes) Forecast by Material, 2015-2032
Table 45: South Asia Market Value (US$ Mn) Forecast by Carrying Capacity, 2015-2032
Table 46: South Asia Market Volume (Tonnes) Forecast by Carrying Capacity, 2015-2032
Table 47: South Asia Market Value (US$ Mn) Forecast by End Use, 2015-2032
Table 48: South Asia Market Volume (Tonnes) Forecast by End Use, 2015-2032
Table 49: Oceania Market Value (US$ Mn) Forecast by Country, 2015-2032
Table 50: Oceania Market Volume (Tonnes) Forecast by Country, 2015-2032
Table 51: Oceania Market Value (US$ Mn) Forecast by Material, 2015-2032
Table 52: Oceania Market Volume (Tonnes) Forecast by Material, 2015-2032
Table 53: Oceania Market Value (US$ Mn) Forecast by Carrying Capacity, 2015-2032
Table 54: Oceania Market Volume (Tonnes) Forecast by Carrying Capacity, 2015-2032
Table 55: Oceania Market Value (US$ Mn) Forecast by End Use, 2015-2032
Table 56: Oceania Market Volume (Tonnes) Forecast by End Use, 2015-2032
Table 57: MEA Market Value (US$ Mn) Forecast by Country, 2015-2032
Table 58: MEA Market Volume (Tonnes) Forecast by Country, 2015-2032
Table 59: MEA Market Value (US$ Mn) Forecast by Material, 2015-2032
Table 60: MEA Market Volume (Tonnes) Forecast by Material, 2015-2032
Table 61: MEA Market Value (US$ Mn) Forecast by Carrying Capacity, 2015-2032
Table 62: MEA Market Volume (Tonnes) Forecast by Carrying Capacity, 2015-2032
Table 63: MEA Market Value (US$ Mn) Forecast by End Use, 2015-2032
Table 64: MEA Market Volume (Tonnes) Forecast by End Use, 2015-2032
Find your sweet spots for generating winning opportunities in this market.
Talk to AnalystList of Charts
Figure 1: Global Market Value (US$ Mn) by Material, 2022-2032
Figure 2: Global Market Value (US$ Mn) by Carrying Capacity, 2022-2032
Figure 3: Global Market Value (US$ Mn) by End Use, 2022-2032
Figure 4: Global Market Value (US$ Mn) by Region, 2022-2032
Figure 5: Global Market Value (US$ Mn) Analysis by Region, 2015-2032
Figure 6: Global Market Volume (Tonnes) Analysis by Region, 2015-2032
Figure 7: Global Market Value Share (%) and BPS Analysis by Region, 2022-2032
Figure 8: Global Market Y-o-Y Growth (%) Projections by Region, 2022-2032
Figure 9: Global Market Value (US$ Mn) Analysis by Material, 2015-2032
Figure 10: Global Market Volume (Tonnes) Analysis by Material, 2015-2032
Figure 11: Global Market Value Share (%) and BPS Analysis by Material, 2022-2032
Figure 12: Global Market Y-o-Y Growth (%) Projections by Material, 2022-2032
Figure 13: Global Market Value (US$ Mn) Analysis by Carrying Capacity, 2015-2032
Figure 14: Global Market Volume (Tonnes) Analysis by Carrying Capacity, 2015-2032
Figure 15: Global Market Value Share (%) and BPS Analysis by Carrying Capacity, 2022-2032
Figure 16: Global Market Y-o-Y Growth (%) Projections by Carrying Capacity, 2022-2032
Figure 17: Global Market Value (US$ Mn) Analysis by End Use, 2015-2032
Figure 18: Global Market Volume (Tonnes) Analysis by End Use, 2015-2032
Figure 19: Global Market Value Share (%) and BPS Analysis by End Use, 2022-2032
Figure 20: Global Market Y-o-Y Growth (%) Projections by End Use, 2022-2032
Figure 21: Global Market Attractiveness by Material, 2022-2032
Figure 22: Global Market Attractiveness by Carrying Capacity, 2022-2032
Figure 23: Global Market Attractiveness by End Use, 2022-2032
Figure 24: Global Market Attractiveness by Region, 2022-2032
Figure 25: North America Market Value (US$ Mn) by Material, 2022-2032
Figure 26: North America Market Value (US$ Mn) by Carrying Capacity, 2022-2032
Figure 27: North America Market Value (US$ Mn) by End Use, 2022-2032
Figure 28: North America Market Value (US$ Mn) by Country, 2022-2032
Figure 29: North America Market Value (US$ Mn) Analysis by Country, 2015-2032
Figure 30: North America Market Volume (Tonnes) Analysis by Country, 2015-2032
Figure 31: North America Market Value Share (%) and BPS Analysis by Country, 2022-2032
Figure 32: North America Market Y-o-Y Growth (%) Projections by Country, 2022-2032
Figure 33: North America Market Value (US$ Mn) Analysis by Material, 2015-2032
Figure 34: North America Market Volume (Tonnes) Analysis by Material, 2015-2032
Figure 35: North America Market Value Share (%) and BPS Analysis by Material, 2022-2032
Figure 36: North America Market Y-o-Y Growth (%) Projections by Material, 2022-2032
Figure 37: North America Market Value (US$ Mn) Analysis by Carrying Capacity, 2015-2032
Figure 38: North America Market Volume (Tonnes) Analysis by Carrying Capacity, 2015-2032
Figure 39: North America Market Value Share (%) and BPS Analysis by Carrying Capacity, 2022-2032
Figure 40: North America Market Y-o-Y Growth (%) Projections by Carrying Capacity, 2022-2032
Figure 41: North America Market Value (US$ Mn) Analysis by End Use, 2015-2032
Figure 42: North America Market Volume (Tonnes) Analysis by End Use, 2015-2032
Figure 43: North America Market Value Share (%) and BPS Analysis by End Use, 2022-2032
Figure 44: North America Market Y-o-Y Growth (%) Projections by End Use, 2022-2032
Figure 45: North America Market Attractiveness by Material, 2022-2032
Figure 46: North America Market Attractiveness by Carrying Capacity, 2022-2032
Figure 47: North America Market Attractiveness by End Use, 2022-2032
Figure 48: North America Market Attractiveness by Country, 2022-2032
Figure 49: Latin America Market Value (US$ Mn) by Material, 2022-2032
Figure 50: Latin America Market Value (US$ Mn) by Carrying Capacity, 2022-2032
Figure 51: Latin America Market Value (US$ Mn) by End Use, 2022-2032
Figure 52: Latin America Market Value (US$ Mn) by Country, 2022-2032
Figure 53: Latin America Market Value (US$ Mn) Analysis by Country, 2015-2032
Figure 54: Latin America Market Volume (Tonnes) Analysis by Country, 2015-2032
Figure 55: Latin America Market Value Share (%) and BPS Analysis by Country, 2022-2032
Figure 56: Latin America Market Y-o-Y Growth (%) Projections by Country, 2022-2032
Figure 57: Latin America Market Value (US$ Mn) Analysis by Material, 2015-2032
Figure 58: Latin America Market Volume (Tonnes) Analysis by Material, 2015-2032
Figure 59: Latin America Market Value Share (%) and BPS Analysis by Material, 2022-2032
Figure 60: Latin America Market Y-o-Y Growth (%) Projections by Material, 2022-2032
Figure 61: Latin America Market Value (US$ Mn) Analysis by Carrying Capacity, 2015-2032
Figure 62: Latin America Market Volume (Tonnes) Analysis by Carrying Capacity, 2015-2032
Figure 63: Latin America Market Value Share (%) and BPS Analysis by Carrying Capacity, 2022-2032
Figure 64: Latin America Market Y-o-Y Growth (%) Projections by Carrying Capacity, 2022-2032
Figure 65: Latin America Market Value (US$ Mn) Analysis by End Use, 2015-2032
Figure 66: Latin America Market Volume (Tonnes) Analysis by End Use, 2015-2032
Figure 67: Latin America Market Value Share (%) and BPS Analysis by End Use, 2022-2032
Figure 68: Latin America Market Y-o-Y Growth (%) Projections by End Use, 2022-2032
Figure 69: Latin America Market Attractiveness by Material, 2022-2032
Figure 70: Latin America Market Attractiveness by Carrying Capacity, 2022-2032
Figure 71: Latin America Market Attractiveness by End Use, 2022-2032
Figure 72: Latin America Market Attractiveness by Country, 2022-2032
Figure 73: Europe Market Value (US$ Mn) by Material, 2022-2032
Figure 74: Europe Market Value (US$ Mn) by Carrying Capacity, 2022-2032
Figure 75: Europe Market Value (US$ Mn) by End Use, 2022-2032
Figure 76: Europe Market Value (US$ Mn) by Country, 2022-2032
Figure 77: Europe Market Value (US$ Mn) Analysis by Country, 2015-2032
Figure 78: Europe Market Volume (Tonnes) Analysis by Country, 2015-2032
Figure 79: Europe Market Value Share (%) and BPS Analysis by Country, 2022-2032
Figure 80: Europe Market Y-o-Y Growth (%) Projections by Country, 2022-2032
Figure 81: Europe Market Value (US$ Mn) Analysis by Material, 2015-2032
Figure 82: Europe Market Volume (Tonnes) Analysis by Material, 2015-2032
Figure 83: Europe Market Value Share (%) and BPS Analysis by Material, 2022-2032
Figure 84: Europe Market Y-o-Y Growth (%) Projections by Material, 2022-2032
Figure 85: Europe Market Value (US$ Mn) Analysis by Carrying Capacity, 2015-2032
Figure 86: Europe Market Volume (Tonnes) Analysis by Carrying Capacity, 2015-2032
Figure 87: Europe Market Value Share (%) and BPS Analysis by Carrying Capacity, 2022-2032
Figure 88: Europe Market Y-o-Y Growth (%) Projections by Carrying Capacity, 2022-2032
Figure 89: Europe Market Value (US$ Mn) Analysis by End Use, 2015-2032
Figure 90: Europe Market Volume (Tonnes) Analysis by End Use, 2015-2032
Figure 91: Europe Market Value Share (%) and BPS Analysis by End Use, 2022-2032
Figure 92: Europe Market Y-o-Y Growth (%) Projections by End Use, 2022-2032
Figure 93: Europe Market Attractiveness by Material, 2022-2032
Figure 94: Europe Market Attractiveness by Carrying Capacity, 2022-2032
Figure 95: Europe Market Attractiveness by End Use, 2022-2032
Figure 96: Europe Market Attractiveness by Country, 2022-2032
Figure 97: East Asia Market Value (US$ Mn) by Material, 2022-2032
Figure 98: East Asia Market Value (US$ Mn) by Carrying Capacity, 2022-2032
Figure 99: East Asia Market Value (US$ Mn) by End Use, 2022-2032
Figure 100: East Asia Market Value (US$ Mn) by Country, 2022-2032
Figure 101: East Asia Market Value (US$ Mn) Analysis by Country, 2015-2032
Figure 102: East Asia Market Volume (Tonnes) Analysis by Country, 2015-2032
Figure 103: East Asia Market Value Share (%) and BPS Analysis by Country, 2022-2032
Figure 104: East Asia Market Y-o-Y Growth (%) Projections by Country, 2022-2032
Figure 105: East Asia Market Value (US$ Mn) Analysis by Material, 2015-2032
Figure 106: East Asia Market Volume (Tonnes) Analysis by Material, 2015-2032
Figure 107: East Asia Market Value Share (%) and BPS Analysis by Material, 2022-2032
Figure 108: East Asia Market Y-o-Y Growth (%) Projections by Material, 2022-2032
Figure 109: East Asia Market Value (US$ Mn) Analysis by Carrying Capacity, 2015-2032
Figure 110: East Asia Market Volume (Tonnes) Analysis by Carrying Capacity, 2015-2032
Figure 111: East Asia Market Value Share (%) and BPS Analysis by Carrying Capacity, 2022-2032
Figure 112: East Asia Market Y-o-Y Growth (%) Projections by Carrying Capacity, 2022-2032
Figure 113: East Asia Market Value (US$ Mn) Analysis by End Use, 2015-2032
Figure 114: East Asia Market Volume (Tonnes) Analysis by End Use, 2015-2032
Figure 115: East Asia Market Value Share (%) and BPS Analysis by End Use, 2022-2032
Figure 116: East Asia Market Y-o-Y Growth (%) Projections by End Use, 2022-2032
Figure 117: East Asia Market Attractiveness by Material, 2022-2032
Figure 118: East Asia Market Attractiveness by Carrying Capacity, 2022-2032
Figure 119: East Asia Market Attractiveness by End Use, 2022-2032
Figure 120: East Asia Market Attractiveness by Country, 2022-2032
Figure 121: South Asia Market Value (US$ Mn) by Material, 2022-2032
Figure 122: South Asia Market Value (US$ Mn) by Carrying Capacity, 2022-2032
Figure 123: South Asia Market Value (US$ Mn) by End Use, 2022-2032
Figure 124: South Asia Market Value (US$ Mn) by Country, 2022-2032
Figure 125: South Asia Market Value (US$ Mn) Analysis by Country, 2015-2032
Figure 126: South Asia Market Volume (Tonnes) Analysis by Country, 2015-2032
Figure 127: South Asia Market Value Share (%) and BPS Analysis by Country, 2022-2032
Figure 128: South Asia Market Y-o-Y Growth (%) Projections by Country, 2022-2032
Figure 129: South Asia Market Value (US$ Mn) Analysis by Material, 2015-2032
Figure 130: South Asia Market Volume (Tonnes) Analysis by Material, 2015-2032
Figure 131: South Asia Market Value Share (%) and BPS Analysis by Material, 2022-2032
Figure 132: South Asia Market Y-o-Y Growth (%) Projections by Material, 2022-2032
Figure 133: South Asia Market Value (US$ Mn) Analysis by Carrying Capacity, 2015-2032
Figure 134: South Asia Market Volume (Tonnes) Analysis by Carrying Capacity, 2015-2032
Figure 135: South Asia Market Value Share (%) and BPS Analysis by Carrying Capacity, 2022-2032
Figure 136: South Asia Market Y-o-Y Growth (%) Projections by Carrying Capacity, 2022-2032
Figure 137: South Asia Market Value (US$ Mn) Analysis by End Use, 2015-2032
Figure 138: South Asia Market Volume (Tonnes) Analysis by End Use, 2015-2032
Figure 139: South Asia Market Value Share (%) and BPS Analysis by End Use, 2022-2032
Figure 140: South Asia Market Y-o-Y Growth (%) Projections by End Use, 2022-2032
Figure 141: South Asia Market Attractiveness by Material, 2022-2032
Figure 142: South Asia Market Attractiveness by Carrying Capacity, 2022-2032
Figure 143: South Asia Market Attractiveness by End Use, 2022-2032
Figure 144: South Asia Market Attractiveness by Country, 2022-2032
Figure 145: Oceania Market Value (US$ Mn) by Material, 2022-2032
Figure 146: Oceania Market Value (US$ Mn) by Carrying Capacity, 2022-2032
Figure 147: Oceania Market Value (US$ Mn) by End Use, 2022-2032
Figure 148: Oceania Market Value (US$ Mn) by Country, 2022-2032
Figure 149: Oceania Market Value (US$ Mn) Analysis by Country, 2015-2032
Figure 150: Oceania Market Volume (Tonnes) Analysis by Country, 2015-2032
Figure 151: Oceania Market Value Share (%) and BPS Analysis by Country, 2022-2032
Figure 152: Oceania Market Y-o-Y Growth (%) Projections by Country, 2022-2032
Figure 153: Oceania Market Value (US$ Mn) Analysis by Material, 2015-2032
Figure 154: Oceania Market Volume (Tonnes) Analysis by Material, 2015-2032
Figure 155: Oceania Market Value Share (%) and BPS Analysis by Material, 2022-2032
Figure 156: Oceania Market Y-o-Y Growth (%) Projections by Material, 2022-2032
Figure 157: Oceania Market Value (US$ Mn) Analysis by Carrying Capacity, 2015-2032
Figure 158: Oceania Market Volume (Tonnes) Analysis by Carrying Capacity, 2015-2032
Figure 159: Oceania Market Value Share (%) and BPS Analysis by Carrying Capacity, 2022-2032
Figure 160: Oceania Market Y-o-Y Growth (%) Projections by Carrying Capacity, 2022-2032
Figure 161: Oceania Market Value (US$ Mn) Analysis by End Use, 2015-2032
Figure 162: Oceania Market Volume (Tonnes) Analysis by End Use, 2015-2032
Figure 163: Oceania Market Value Share (%) and BPS Analysis by End Use, 2022-2032
Figure 164: Oceania Market Y-o-Y Growth (%) Projections by End Use, 2022-2032
Figure 165: Oceania Market Attractiveness by Material, 2022-2032
Figure 166: Oceania Market Attractiveness by Carrying Capacity, 2022-2032
Figure 167: Oceania Market Attractiveness by End Use, 2022-2032
Figure 168: Oceania Market Attractiveness by Country, 2022-2032
Figure 169: MEA Market Value (US$ Mn) by Material, 2022-2032
Figure 170: MEA Market Value (US$ Mn) by Carrying Capacity, 2022-2032
Figure 171: MEA Market Value (US$ Mn) by End Use, 2022-2032
Figure 172: MEA Market Value (US$ Mn) by Country, 2022-2032
Figure 173: MEA Market Value (US$ Mn) Analysis by Country, 2015-2032
Figure 174: MEA Market Volume (Tonnes) Analysis by Country, 2015-2032
Figure 175: MEA Market Value Share (%) and BPS Analysis by Country, 2022-2032
Figure 176: MEA Market Y-o-Y Growth (%) Projections by Country, 2022-2032
Figure 177: MEA Market Value (US$ Mn) Analysis by Material, 2015-2032
Figure 178: MEA Market Volume (Tonnes) Analysis by Material, 2015-2032
Figure 179: MEA Market Value Share (%) and BPS Analysis by Material, 2022-2032
Figure 180: MEA Market Y-o-Y Growth (%) Projections by Material, 2022-2032
Figure 181: MEA Market Value (US$ Mn) Analysis by Carrying Capacity, 2015-2032
Figure 182: MEA Market Volume (Tonnes) Analysis by Carrying Capacity, 2015-2032
Figure 183: MEA Market Value Share (%) and BPS Analysis by Carrying Capacity, 2022-2032
Figure 184: MEA Market Y-o-Y Growth (%) Projections by Carrying Capacity, 2022-2032
Figure 185: MEA Market Value (US$ Mn) Analysis by End Use, 2015-2032
Figure 186: MEA Market Volume (Tonnes) Analysis by End Use, 2015-2032
Figure 187: MEA Market Value Share (%) and BPS Analysis by End Use, 2022-2032
Figure 188: MEA Market Y-o-Y Growth (%) Projections by End Use, 2022-2032
Figure 189: MEA Market Attractiveness by Material, 2022-2032
Figure 190: MEA Market Attractiveness by Carrying Capacity, 2022-2032
Figure 191: MEA Market Attractiveness by End Use, 2022-2032
Figure 192: MEA Market Attractiveness by Country, 2022-2032
Need specific information?
Request CustomizationExplore Packaging Insights
View Reports