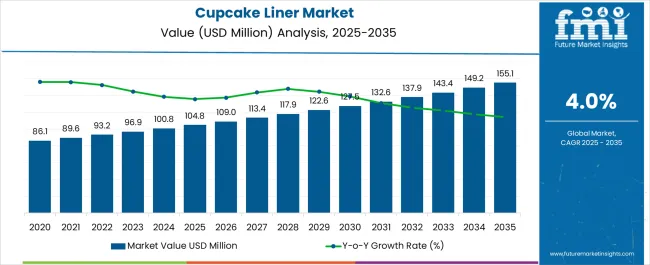
The Cupcake Liner Market is estimated to be valued at USD 104.8 million in 2025 and is projected to reach USD 155.1 million by 2035, registering a compound annual growth rate (CAGR) of 4.0% over the forecast period.
| Metric | Value |
|---|---|
| Cupcake Liner Market Estimated Value in (2025 E) | USD 104.8 million |
| Cupcake Liner Market Forecast Value in (2035 F) | USD 155.1 million |
| Forecast CAGR (2025 to 2035) | 4.0% |
The cupcake liner market is expanding steadily. Rising home baking trends, growing popularity of premium confectionery, and increased adoption of decorative packaging solutions are driving demand. Current market conditions are being influenced by consumer preference for convenient, eco-friendly, and visually appealing liners.
Manufacturers are focusing on sustainable material innovation and design enhancements to meet evolving expectations. Offline and online distribution channels are both supporting broader market accessibility. The future outlook is being shaped by increasing disposable incomes, urban lifestyle shifts, and growth in home baking supported by social media-driven culinary trends.
In parallel, demand from professional bakeries and foodservice outlets continues to complement household consumption Growth rationale is supported by strong demand for paper-based and customizable liners, strategic expansion of distribution networks, and regulatory emphasis on food safety and sustainable packaging These drivers are expected to reinforce consistent revenue growth, encourage adoption of innovative formats, and sustain market competitiveness across developed and emerging economies.
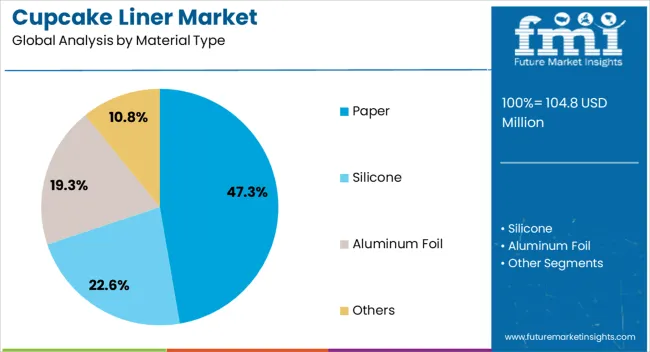
The paper segment, accounting for 47.30% of the material type category, has maintained its leadership owing to eco-friendly properties and widespread use in household and commercial baking. The segment is supported by regulatory encouragement toward sustainable packaging and the shift away from plastic-based materials. Improved durability, grease resistance, and availability of customizable designs have strengthened consumer adoption.
Manufacturers are investing in innovative coatings and recyclable solutions to enhance product performance while aligning with environmental concerns. The growth of artisanal baking and premium cupcake offerings has further boosted demand for decorative paper liners.
Affordability and wide availability across retail and wholesale outlets have also contributed to its dominance Continued innovations in biodegradable and compostable paper liners are expected to sustain this segment’s market share and ensure resilience against regulatory and competitive pressures.
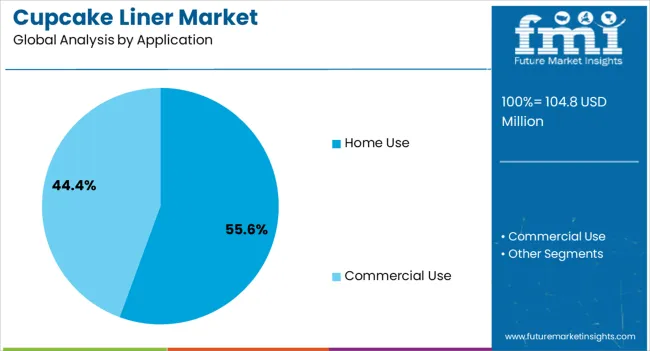
The home use segment, representing 55.60% of the application category, has been the leading driver of market growth as baking at home gains popularity. Rising interest in do-it-yourself culinary experiences, combined with the influence of digital content and social media platforms, has accelerated liner demand. Household adoption is supported by easy product accessibility across offline and online retail channels.
The segment is further strengthened by seasonal and festive baking traditions that contribute to recurring consumption. Paper-based liners offering convenience, hygiene, and visual appeal have been the preferred choice for household bakers.
Cost-effectiveness and multipack availability have supported recurring purchases, while innovation in color, design, and eco-friendly formats is adding value With rising disposable incomes and lifestyle changes, home use demand is expected to sustain dominance and further reinforce this segment’s contribution to overall market growth.
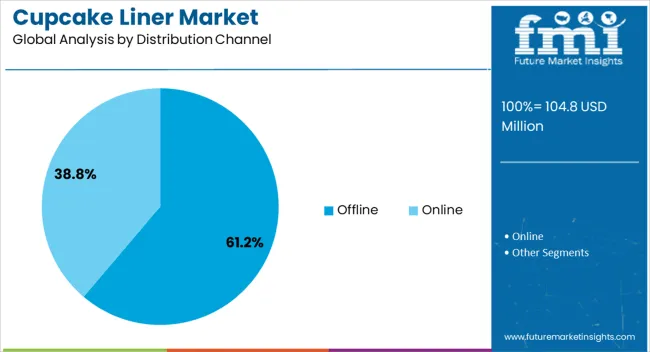
The offline channel, holding 61.20% of the distribution category, has been the dominant sales avenue due to widespread availability of cupcake liners through supermarkets, hypermarkets, specialty stores, and wholesale outlets. Physical retail provides consumers with the ability to evaluate product quality and variety directly, which has enhanced purchasing confidence. The channel benefits from strong supply chain networks and established retail infrastructure across both developed and emerging economies.
Offline retail also supports bulk purchasing by small bakeries and households, contributing to higher volume sales. Seasonal demand spikes during festivals and celebrations are effectively catered to by offline outlets through in-store promotions and dedicated product displays.
While e-commerce adoption is rising, offline retail remains the preferred channel for most consumers due to immediacy of purchase and trust in physical retail presence Expansion of supermarket chains and local specialty baking stores is expected to sustain this channel’s market leadership and strengthen its market contribution.
| Attributes | Details |
|---|---|
| Cupcake Liner Market Size (2020) | USD 86.1 million |
| Cupcake Liner Market Size (2025) | USD 104.8 million |
| Historical CAGR % (2020 to 2025) | 3.2% |
In the historical period, the cupcake liner market observed a consistent CAGR of 3.2% as the market value rose from USD 86.1 million in 2020 to USD 104.8 million in 2025. The following points reveal growth-inducing factors for the growth of the cupcake liner industry:
The market, in the future, is predicted to witness an upward trajectory, expanding from USD 104.8 million in 2025 to USD 155.1 million by 2035. Throughout this period, the FMI analysts have estimated that the market is anticipated to register a CAGR of 4%.
| Historical CAGR (2020 to 2025) | 3.2% |
|---|---|
| Forecast CAGR (2025 to 2035) | 4% |
| Leading Material Type | Paper |
|---|---|
| Market Share % (2025) | 70.30% |
The paper-made cupcake liners are predicted to account for a market share of 70.30%, as estimated for 2025. The massive market penetration of paper cupcake liners indicates the consumer trends surrounding the use of eco-friendly materials. Market players are going full throttle to bring innovations in the packaging solutions for cupcakes as the popularity of cupcakes continues to rise.
Product manufacturers are taking into consideration the recyclability factor when developing their products. Additionally, the manufacturers are concentrating their efforts on developing innovative and appealing cupcake liners. Paper, however, holds a prominent position to meet the surging demand from eco-conscious customers.
| Leading Print Type | Flexographic |
|---|---|
| Market Share % (2025) | 47% |
The flexographic print type segment is predicted to account for a massive value share of 47% in the year 2025. Manufacturers seek cost-effective printing methodologies to attract customers on a large scale.
Thus, increasing the use of flexographic printing for high-volume cupcake liner production is predicted to enhance segment growth. Additionally, flexographic creates high-quality prints with outstanding resolution and detail, thus boosting its importance among leading manufacturers.
Since flexographic inks are first tested by the FDA to be used on food packaging, they are considered safe and fit for cupcake liners.
| Country | The United States |
|---|---|
| Forecast CAGR % (2025 to 2035) | 3.70% |
The North America cupcake liner market is projected to hold an estimated 19.70% value share in 2025. Within the region, the United States is expected to sustain a substantial demand for cupcake liners in the years to follow.
As per recent market research by FMI analysts, the United States is predicted to register a 3.70% CAGR. Given below are the key factors that are spearheading the sales of cupcake liners in the United States
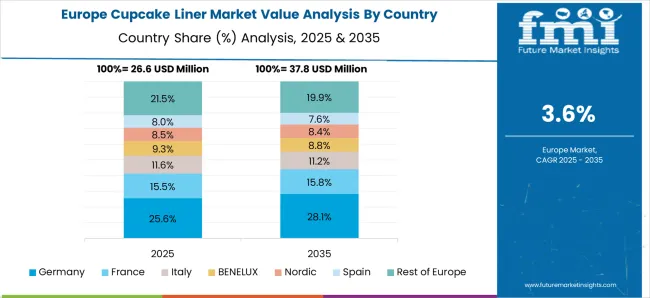
| Country | Germany |
|---|---|
| Forecast CAGR % (2025 to 2035) | 3% |
The Europe cupcake liner market holds a chief position in the global market. As per the recent market statistics, the region is predicted to record a share of 23.60% in 2025. Within Europe, Germany and the United Kingdom are the top markets for cupcake liners, both of which are expanding at a CAGR of 3% through 2035. Mentioned below are the leading factors underpinning the cupcake liner demand growth in Germany
| Country | India |
|---|---|
| Forecast CAGR % (2025 to 2035) | 7.2% |
India is forecast to expand at a promising pace, as the consumption and craze for cupcakes is expected to rise in the years to come ceaselessly. Market dynamics of cupcake liners in India are explained below:
| Country | China |
|---|---|
| Forecast CAGR % (2025 to 2035) | 6.2% |
China is another important market for the future growth of the cupcake liner industry in the Asia Pacific. FMI analysts have estimated the market to register a CAGR of 6.2% through 2035. The following factors support the sales of cupcake liners in China
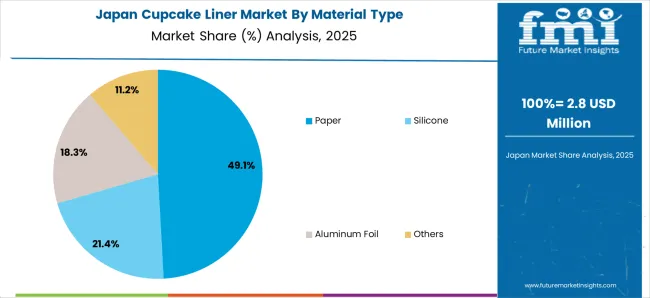
| Country | Japan |
|---|---|
| Forecast CAGR % (2025 to 2035) | 3.6% |
The Japan cupcake liner market is predicted to expand at a CAGR of 3.60% through 2035. Given below are the latest trends impacting the investment in cupcake liners
The cupcake liner market is categorized as highly competitive, with several players seeking the attention of ever-growing confectionary business owners. As large-scale manufacturers and small artisan bakeries grow in number, key manufacturers of cupcake liners are expected to find a constant revenue stream in the years to follow.
For better market penetration, players are expected to invest in product innovation to attract and influence consumer trends.
As cupcake offerings continue to evolve to accommodate health-oriented baked goods to tap the soaring interest in nutrition, the cupcake liners find the scope of a sustainable sale continuing in the future.
Escalated growth of eCommerce platforms, boasting of higher availability and accessibility of products, is expected to create a smooth pathway for higher revenues of players selling cupcake liners.
Players are predicted to come together for collaborations and partnerships to enjoy a widened customer base for their products. With new consumer trends punctuating the cupcake liner industry, the forecast growth of cupcake liner manufacturers is expected to spiral upwards.
New Developments Taking Place in the Market
| Attribute | Details |
|---|---|
| Forecast Period | 2025 to 2035 |
| Historical Data Available for | 2020 to 2025 |
| Market Analysis | Units for Volume and USD million for Value |
| Key Regions Covered | North America; Latin America; Europe; Asia Pacific; and the Middle East and Africa |
| Key Countries Covered | The United States, Canada, Brazil, Mexico, Germany, The United Kingdom, France, Italy, Spain, Nordic, Russia, Poland, China, India, Thailand, Indonesia, Australia and New Zealand, Japan, GCC countries, North Africa, South Africa, and others. |
| Key Market Segments Covered | Material Type, Application, Distribution Channel, Print Type, Region |
| Key Companies Profiled | Nordic Paper; Acorn Paper Products; Larsen Packaging Products; Rockline Industries; Paterson Pacific Parchment Company; PaperTech; AmerCareRoyal; Reynolds Consumer Products; Tielman Sweden AB; Hay Nien; McNairn Packaging |
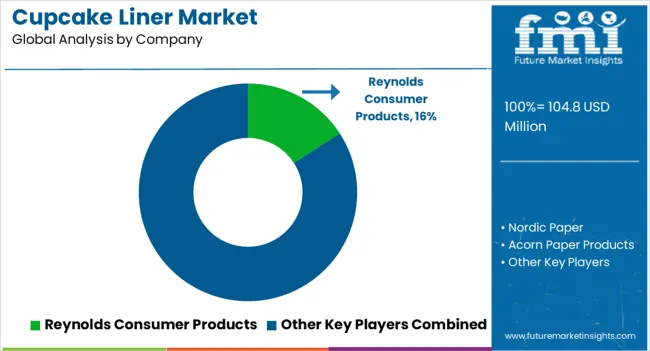
The global cupcake liner market is estimated to be valued at USD 104.8 million in 2025.
The market size for the cupcake liner market is projected to reach USD 155.1 million by 2035.
The cupcake liner market is expected to grow at a 4.0% CAGR between 2025 and 2035.
The key product types in cupcake liner market are paper, silicone, aluminum foil and others.
In terms of application, home use segment to command 55.6% share in the cupcake liner market in 2025.


Our Research Products

The "Full Research Suite" delivers actionable market intel, deep dives on markets or technologies, so clients act faster, cut risk, and unlock growth.

The Leaderboard benchmarks and ranks top vendors, classifying them as Established Leaders, Leading Challengers, or Disruptors & Challengers.

Locates where complements amplify value and substitutes erode it, forecasting net impact by horizon

We deliver granular, decision-grade intel: market sizing, 5-year forecasts, pricing, adoption, usage, revenue, and operational KPIs—plus competitor tracking, regulation, and value chains—across 60 countries broadly.

Spot the shifts before they hit your P&L. We track inflection points, adoption curves, pricing moves, and ecosystem plays to show where demand is heading, why it is changing, and what to do next across high-growth markets and disruptive tech

Real-time reads of user behavior. We track shifting priorities, perceptions of today’s and next-gen services, and provider experience, then pace how fast tech moves from trial to adoption, blending buyer, consumer, and channel inputs with social signals (#WhySwitch, #UX).

Partner with our analyst team to build a custom report designed around your business priorities. From analysing market trends to assessing competitors or crafting bespoke datasets, we tailor insights to your needs.
Supplier Intelligence
Discovery & Profiling
Capacity & Footprint
Performance & Risk
Compliance & Governance
Commercial Readiness
Who Supplies Whom
Scorecards & Shortlists
Playbooks & Docs
Category Intelligence
Definition & Scope
Demand & Use Cases
Cost Drivers
Market Structure
Supply Chain Map
Trade & Policy
Operating Norms
Deliverables
Buyer Intelligence
Account Basics
Spend & Scope
Procurement Model
Vendor Requirements
Terms & Policies
Entry Strategy
Pain Points & Triggers
Outputs
Pricing Analysis
Benchmarks
Trends
Should-Cost
Indexation
Landed Cost
Commercial Terms
Deliverables
Brand Analysis
Positioning & Value Prop
Share & Presence
Customer Evidence
Go-to-Market
Digital & Reputation
Compliance & Trust
KPIs & Gaps
Outputs
Full Research Suite comprises of:
Market outlook & trends analysis
Interviews & case studies
Strategic recommendations
Vendor profiles & capabilities analysis
5-year forecasts
8 regions and 60+ country-level data splits
Market segment data splits
12 months of continuous data updates
DELIVERED AS:
PDF EXCEL ONLINE
Cupcake Box Market Size and Share Forecast Outlook 2025 to 2035
Cupcake Containers Market Size and Share Forecast Outlook 2025 to 2035
Cupcake Wrappers Market Size and Share Forecast Outlook 2025 to 2035
Competitive Landscape of Cupcake Wrappers Manufacturers
Cupcake Tray Machines Market
Linerless Label Market Size and Share Forecast Outlook 2025 to 2035
Linerless Closures Market Size and Share Forecast Outlook 2025 to 2035
Market Positioning & Share in Linerless Label Industry
Liner Bag Market Report – Key Trends & Forecast 2024-2034
Liner Hanger Market
Eyeliner and Kajal Sculpting Pencil Packaging Market Trends and Forecast 2025 to 2035
Evaluating Eyeliner and Kajal Sculpting Pencil Packaging Market Share & Provider Insights
Eyeliner Pen Market
Cap Liner Market Size and Share Forecast Outlook 2025 to 2035
Box Liners Market Size and Share Forecast Outlook 2025 to 2035
IBC Liner Market Size and Share Forecast Outlook 2025 to 2035
Pan Liner Market Insights – Demand, Growth & Industry Trends 2025-2035
EPE Liner Market Analysis – Size, Growth & Demand 2025 to 2035
Examining Market Share Trends in the Cap Liner Industry
IBC Liner Market Share Insights & Industry Leaders

Thank you!
You will receive an email from our Business Development Manager. Please be sure to check your SPAM/JUNK folder too.
Chat With
MaRIA