The global box liners market is projected to grow from USD 447.6 million in 2025 to approximately USD 675.4 million by 2035, recording an absolute increase of USD 227.8 million over the forecast period. This translates into a total growth of 50.9%, with the market forecast to expand at a compound annual growth rate (CAGR) of 4.2% between 2025 and 2035. The market size is expected to grow by nearly 1.5X during the same period, supported by increasing global demand for efficient bulk material protection solutions, growing adoption of specialized packaging systems in industrial logistics, and rising supply chain optimization requirements driving comprehensive liner procurement across various material handling applications.
Logistics managers at distribution centers face competing pressures from operations teams demanding reliable product protection and procurement departments scrutinizing packaging cost escalation. Traditional polyethylene liner systems provide effective moisture and contamination barriers but create waste disposal complications that extend beyond immediate facility concerns. Plant supervisors must coordinate liner inventory management across diverse product categories while adapting to seasonal demand fluctuations that strain storage capacity and workforce scheduling.
Procurement departments encounter supply chain vulnerabilities in specialized barrier films essential for temperature-sensitive applications. Manufacturing delays in multi-layer coextrusion processes create cascading effects across packaging timelines, forcing operational compromises between product protection and delivery schedules. Purchasing managers confront supplier consolidation that reduces competitive options while increasing dependency on single-source providers for critical barrier materials.
E-commerce fulfillment operations present distinct challenges related to consumer expectations and packaging efficiency optimization. Warehouse supervisors struggle with liner specification decisions that balance product protection against package volume optimization required for shipping cost control. Quality assurance teams must validate protection effectiveness across diverse product categories while environmental compliance officers ensure operations meet recycling requirements that continue evolving across municipal jurisdictions.
Food processing facilities encounter unique liner requirements related to contamination prevention and regulatory compliance standards. Plant operators must coordinate packaging schedules around production demands where contamination risks require immediate response protocols. Maintenance coordinators face equipment calibration challenges when transitioning between liner specifications for different product categories within shared packaging lines.
Pharmaceutical manufacturing operations demand specialized liner materials capable of maintaining product integrity throughout extended distribution cycles. Quality control departments require barrier validation that meets regulatory standards while production teams resist scheduling disruptions during critical batch processing periods. Regulatory affairs officers must navigate approval processes that vary significantly between markets, creating specification complexity for multinational operations.
Chemical industry applications reveal distinct operational requirements related to hazardous material containment and safety protocol compliance. Plant engineers specify liner systems capable of chemical resistance while maintaining structural integrity throughout diverse temperature and humidity conditions. Environmental health officers require documentation systems that track liner performance across multiple regulatory frameworks simultaneously.
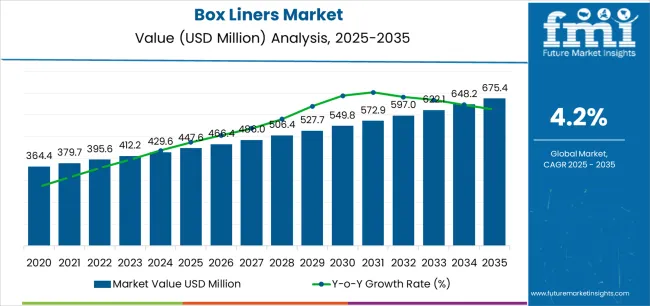
| Metric | Value |
|---|---|
| Market Value (2025) | USD 447.6 million |
| Market Forecast Value (2035) | USD 675.4 million |
| Forecast CAGR (2025-2035) | 4.2% |
| SUPPLY CHAIN EFFICIENCY REQUIREMENTS | INDUSTRIAL LOGISTICS DEMANDS | MATERIAL PROTECTION STANDARDS |
|---|---|---|
| Global Logistics Optimization Continuous expansion of bulk material handling across established and emerging markets driving demand for efficient containment solutions. Cost-Effective Protection Systems Growing emphasis on reducing product contamination and transportation damage creating demand for reliable protective barriers. Operational Efficiency Enhancement Superior protection characteristics and handling convenience making box liners essential for optimized logistics applications. | Sophisticated Handling Requirements Modern industrial logistics requires protective solutions delivering precise material isolation and enhanced operational performance. Processing Efficiency Demands Distribution centers investing in cost-effective liners offering consistent protection performance while maintaining handling efficiency. Quality and Reliability Standards Certified suppliers with proven track records required for advanced bulk material protection applications. | Contamination Prevention Standards Regulatory requirements establishing performance benchmarks favoring high-quality protective barrier solutions. Material Integrity Requirements Quality standards requiring superior moisture resistance and protection against environmental stresses in handling operations. Supply Chain Compliance Requirements Diverse industrial requirements and quality standards driving need for sophisticated protective liner solutions. |
| Category | Segments Covered |
|---|---|
| By Product Type | PEP, Side Gusseted, PEP Jumbo, Others |
| By Thinness | 3-6 Mil, From 6 to 8 Mil, From 4 to 6 Mil |
| By Material Type | HDPE, LDPE, LLDPE |
| By Region | North America, Europe, Asia Pacific, Latin America, Middle East & Africa |
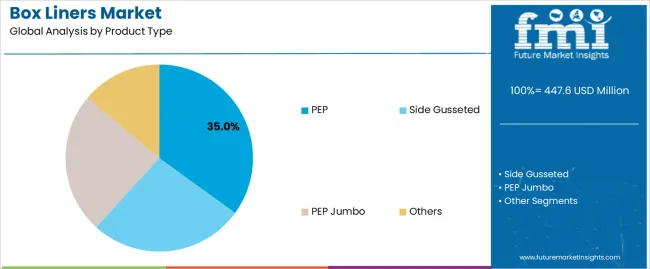
| Segment | 2025 to 2035 Outlook |
|---|---|
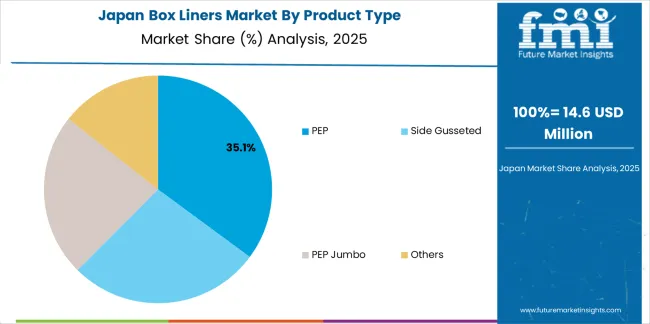
| PEP | Leader in 2025 with 35% market share; likely to maintain leadership through 2035. Broadest use across bulk material handling, industrial packaging, and agricultural applications with mature supply chain and predictable functionality. Momentum: steady-to-strong. Watchouts: competition from specialized formats and material cost fluctuations. |
| Side Gusseted | Strong performer with 33% share, benefiting from efficient space utilization and enhanced capacity characteristics for irregular container shapes. Momentum: rising in specialty applications. Watchouts: higher manufacturing complexity and limited standardization across industries. |
| PEP Jumbo | High-capacity segment with 32% share for large-scale industrial and agricultural bulk material handling. Cost-effective for high-volume applications but requires specialized handling equipment. Momentum: moderate growth driven by industrial consolidation and bulk handling efficiency requirements. Watchouts: transportation logistics complexity and storage space requirements. |
| Others | Niche segment including custom configurations and specialized liner formats. Small market share but serves specific application requirements across diverse industries. Momentum: selective growth in customized industrial applications requiring unique specifications. Limited volume potential constrains broader market expansion. |
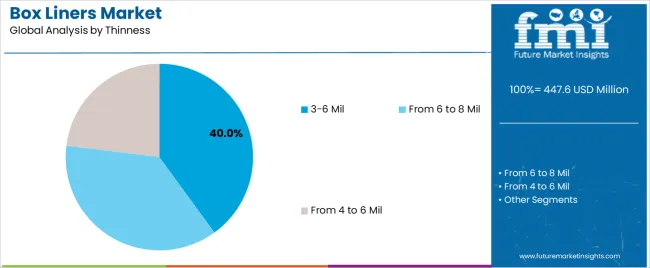
| Segment | 2025 to 2035 Outlook |
|---|---|
| 3-6 Mil | At 40.0%, largest thinness segment in 2025 with optimal balance between material protection and cost efficiency. Broad application suitability across general industrial and food-grade packaging requirements with established manufacturing standards. Momentum: steady growth driven by cost-conscious procurement and adequate protection performance for mainstream applications. Watchouts: pressure from thinner gauge developments and premium application requirements demanding heavier specifications. |
| From 6 to 8 Mil | Heavy-duty segment with 35.0% share serving demanding industrial applications requiring enhanced puncture resistance and durability. Critical for abrasive materials, sharp-edged products, and extended storage applications. Momentum: moderate growth via premium positioning and specialized industrial requirements. Watchouts: higher material costs limiting adoption in price-sensitive segments and competition from advanced thin-gauge materials with improved strength characteristics. |
| From 4 to 6 Mil | Mid-range segment with 25.0% share offering enhanced protection versus lighter gauges while maintaining reasonable cost structure. Suitable for semi-industrial applications and products requiring moderate protection levels. Momentum: steady performance with selective growth in applications upgrading from lighter gauges. Watchouts: positioned between cost-effective thin gauges and premium heavy-duty options, facing competition from both directions as material technologies improve. |
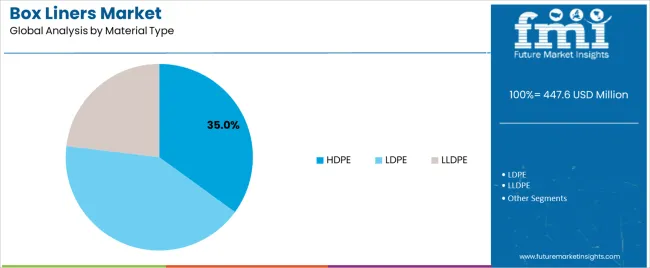
| Segment | 2025 to 2035 Outlook |
|---|---|
| HDPE | Leading material with 35% share in 2025, valued for superior strength-to-weight ratio, excellent moisture barrier properties, and chemical resistance. Dominant in food-grade applications and industrial bulk material handling requiring reliable contamination prevention. Momentum: steady-to-strong growth driven by food safety requirements and industrial protection standards. Watchouts: higher raw material costs versus LDPE and environmental concerns regarding recyclability in multi-layer constructions. |
| LDPE | Strong performer with 33% share, offering superior flexibility, excellent low-temperature performance, and easier sealing characteristics. Preferred for applications requiring conformability and where product flexibility is critical. Momentum: moderate growth supported by agricultural applications and flexible packaging requirements. Watchouts: lower puncture resistance versus HDPE limiting adoption in demanding industrial applications and performance trade-offs in heavy-duty segments. |
| LLDPE | Emerging material with 32% share combining advantages of both HDPE and LDPE with enhanced puncture resistance and flexibility balance. Increasingly adopted for demanding applications requiring optimized performance characteristics. Momentum: rising strongly through 2030 as material technology improvements drive specification upgrades across multiple application segments. Watchouts: slightly higher material costs and processing complexity versus traditional LDPE options requiring manufacturer investment in updated equipment capabilities. |
| DRIVERS | RESTRAINTS | KEY TRENDS |
|---|---|---|
| Industrial Logistics Expansion Continuing expansion of bulk material handling across established and emerging markets driving demand for protective liner solutions. Cost Optimization Priorities Increasing recognition of contamination prevention importance in operational efficiency and material loss reduction. Supply Chain Efficiency Focus Growing demand for packaging solutions that support both product protection and handling efficiency in logistics operations. | Raw Material Price Volatility Polyethylene price fluctuations affecting production costs and supply chain predictability for manufacturers. Environmental Regulation Complexity Environmental concerns and recycling infrastructure limitations influencing material selection and development strategies. Standardization Challenges Varying application requirements across industries affecting product specifications and adoption complexity. Competition from Alternatives Alternative packaging solutions and reusable container systems influencing market dynamics in certain segments. | Eco-friendly Material Development Integration of recycled content, biodegradable additives, and circular economy principles enabling improved environmental performance. Advanced Film Technologies Enhanced barrier properties, improved puncture resistance, and optimized gauge reduction capabilities compared to traditional films. Customization Capabilities Development of application-specific liner configurations providing enhanced fit and performance optimization opportunities. Smart Packaging Integration Integration of tracking capabilities and quality monitoring features for sophisticated logistics solutions. |
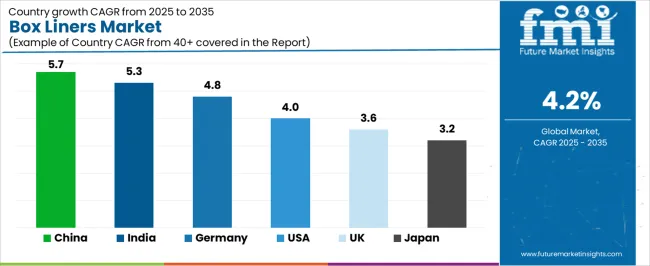
| Country | CAGR (2025-2035) |
|---|---|
| China | 5.7% |
| India | 5.3% |
| Germany | 4.8% |
| United States | 4.0% |
| United Kingdom | 3.6% |
| Japan | 3.2% |
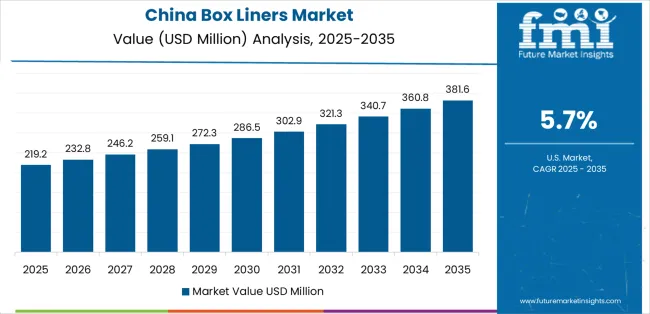
Revenue from box liners in China is projected to exhibit strong growth, with a CAGR of 5.7% from 2025 to 2035. This growth is driven by expanding manufacturing logistics infrastructure and comprehensive bulk material handling innovation, creating substantial opportunities for liner suppliers across industrial packaging operations, agricultural applications, and specialty logistics sectors. The country's established manufacturing leadership and expanding e-commerce logistics capabilities are creating significant demand for both standard and customized protective liner solutions. Major logistics companies and packaging manufacturers are establishing comprehensive local production facilities to support large-scale distribution operations and meet growing demand for efficient protective packaging solutions.
Revenue from box liners in India is expanding with a CAGR of 5.3% from 2025 to 2035, supported by extensive agricultural export expansion and comprehensive food processing industry development. This creates demand for reliable protective liners across diverse bulk material handling categories and specialty packaging segments. The country's dominant agricultural production position and expanding food processing capabilities are driving demand for liner solutions that provide consistent protection performance while supporting cost-effective logistics requirements. Packaging manufacturers and agricultural exporters are investing in local production facilities to support growing export operations and domestic distribution demand.
Demand for box liners in Germany is projected to grow with a CAGR of 4.8% from 2025 to 2035, supported by the country's leadership in industrial logistics excellence and advanced packaging technologies requiring sophisticated liner systems for chemical handling and premium industrial applications. German logistics companies are implementing high-quality liner systems that support advanced contamination prevention, operational efficiency, and comprehensive safety protocols. The market is characterized by a focus on operational excellence, environmental responsibility, and compliance with stringent packaging quality and safety standards.
Revenue from box liners in the United States is growing with a CAGR of 4.0% from 2025 to 2035, driven by food safety regulation compliance programs and increasing supply chain protection requirements. This creates continued opportunities for liner suppliers serving both food processing operations and industrial logistics contractors. The country's extensive food manufacturing base and expanding food safety awareness are creating demand for liner solutions that support diverse protection requirements while maintaining operational efficiency standards. Food manufacturers and logistics service providers are developing procurement strategies to support regulatory compliance and quality assurance.
Demand for box liners in the United Kingdom is projected to reach USD 24.1 million by 2035, expanding at a CAGR of 3.6%, driven by eco-friendly packaging requirements and specialty logistics capabilities supporting advanced food distribution and comprehensive environmental compliance applications. The country's established food retail tradition and growing environmental packaging standards are creating demand for high-quality liner solutions that support operational performance and environmental standards. Packaging manufacturers and logistics suppliers are maintaining comprehensive development capabilities to support diverse ecological requirements.
Demand for box liners in Japan is projected to reach USD 21.3 million by 2035, expanding at a CAGR of 3.2%, driven by precision quality standards and sophisticated contamination prevention capabilities supporting advanced food handling and comprehensive industrial applications. The country's established quality excellence tradition and meticulous handling standards are creating demand for ultra-reliable liner solutions that support exacting performance and safety standards. Packaging manufacturers and logistics suppliers are maintaining rigorous development capabilities to support demanding application requirements.
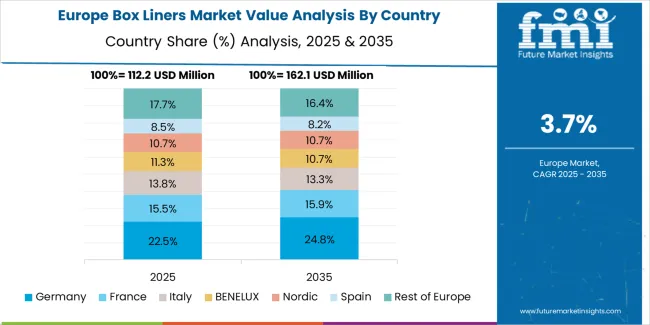
The box liners market in Europe is projected to grow from USD 21.6 million in 2025 to USD 32.6 million by 2035, registering a CAGR of 4.2% over the forecast period. Germany is expected to maintain its leadership position with a 22.4% market share in 2025, supported by its advanced industrial logistics infrastructure and comprehensive bulk material handling operations across major manufacturing clusters in North Rhine-Westphalia, Bavaria, and Baden-Württemberg regions.
United Kingdom follows with a 16.5% share in 2025, projected to reach 16.3% by 2035, driven by comprehensive food retail supply chain requirements and expanding cold chain logistics infrastructure. France holds a 15.8% share in 2025, expected to reach 16.1% by 2035 due to agricultural export growth and food processing expansion. Italy commands a 14.3% share, while Spain accounts for 13.7% in 2025. The Rest of Europe region is anticipated to maintain stable momentum with 17.3% share, attributed to increasing liner adoption in Nordic countries and emerging Eastern European food processing facilities implementing modern bulk handling programs.
European box liner operations are increasingly polarized between Western European quality-focused applications and Eastern European cost-competitive manufacturing. German and Dutch facilities dominate food-grade liner production and premium industrial applications, leveraging advanced extrusion technologies and strict quality protocols that command price premiums in regulated markets. German manufacturers maintain leadership in specialized chemical-resistant and contamination-prevention applications, with major logistics and chemical companies driving technical specifications that smaller suppliers must meet to access supply contracts.
Eastern European operations in Poland, Hungary, and Czech Republic are capturing volume-oriented liner production through labor cost advantages and EU regulatory compliance, particularly in agricultural and general industrial applications. These facilities increasingly serve as production capacity for Western European brands while developing their own manufacturing expertise and customer relationships.
The regulatory environment presents both opportunities and constraints. EU food contact material regulations and REACH compliance requirements create barriers for non-compliant suppliers but establish quality standards that favor established European manufacturers over lower-cost imports. Environmental directives regarding plastic packaging create pressure for recycled content integration and circular economy compliance, driving investment in advanced recycling partnerships and material technology development.
Supply chain consolidation accelerates as manufacturers seek economies of scale to absorb rising raw material costs and environmental compliance expenses. Vertical integration increases, with major logistics companies and packaging converters acquiring liner production capabilities to secure supply reliability and cost control. Smaller producers face pressure to specialize in customized applications or risk displacement by larger, more efficient operations serving mainstream industrial and food-grade requirements.
Japanese box liner operations reflect the country's exacting quality standards and sophisticated contamination prevention expectations. Major food manufacturers including Ajinomoto, Kikkoman, and logistics companies maintain rigorous supplier qualification processes that exceed international standards, requiring extensive material testing, facility certification, and traceability documentation that can take 6-12 months to complete. This creates high barriers for new suppliers but ensures consistent quality that supports premium food safety positioning.
The Japanese market demonstrates unique specification preferences, with significant demand for precisely controlled gauge tolerances and customized dimensions tailored to standardized container formats used throughout Japanese logistics systems. Companies require specific material purity levels and additive restrictions that differ from Western applications, driving demand for specialized production capabilities and quality control systems.
Regulatory oversight through the Ministry of Health, Labour and Welfare emphasizes comprehensive food contact safety and migration testing requirements that surpass most international standards. The food packaging approval system requires detailed formulation disclosure and safety validation, creating advantages for suppliers with transparent material sourcing and comprehensive testing capabilities.
Supply chain management focuses on long-term partnership relationships rather than purely transactional procurement. Japanese companies typically maintain stable supplier relationships spanning years, with contract negotiations emphasizing quality consistency and supply reliability over price competition. This stability supports investment in dedicated production runs and customized specifications tailored to Japanese requirements.
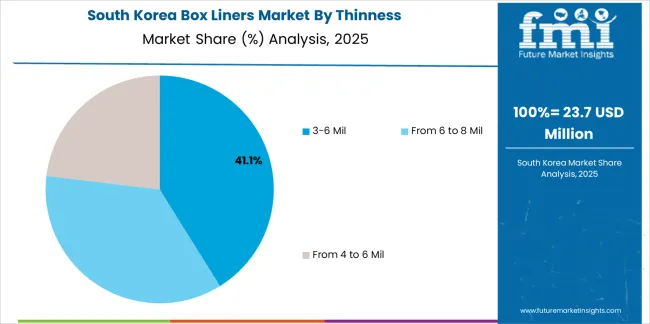
South Korean box liner operations reflect the country's advanced food manufacturing sector and export-oriented agricultural business model. Major food conglomerates including CJ CheilJedang, Pulmuone, and agricultural cooperatives drive sophisticated packaging procurement strategies, establishing direct relationships with liner manufacturers to secure consistent quality and competitive pricing for their domestic and export operations targeting international markets.
The Korean market demonstrates particular strength in food-grade liner applications, with companies integrating liner solutions into kimchi export packaging, processed food handling, and agricultural product distribution systems designed for quality preservation during extended shipping periods. This quality-focused approach creates demand for specific barrier properties and puncture resistance specifications that differ from commodity industrial applications.
Regulatory frameworks emphasize food safety and traceability, with Korean Food and Drug Administration standards requiring comprehensive supplier documentation and periodic quality audits. This creates barriers for non-certified suppliers but benefits established manufacturers who can demonstrate consistent compliance capabilities and quality management systems.
Supply chain efficiency remains critical given Korea's export dependence and competitive global positioning. Companies increasingly pursue long-term contracts with domestic manufacturers to ensure reliable supply while managing cost pressures from international competition. Cold chain logistics investments support quality preservation requirements for temperature-sensitive applications.
The market faces pressure from Chinese low-cost competition and environmental regulations promoting green packaging alternatives, driving Korean manufacturers to focus on premium applications and value-added features. However, the quality positioning of Korean food exports and stringent domestic safety standards continue to support demand for high-specification liner solutions that meet demanding performance requirements.
The Box Liners Market is growing as manufacturers, food processors, chemical suppliers, and logistics companies prioritize contamination control and product protection during storage and transport. Box liners provide a barrier against moisture, dust, odor, and chemical exposure, making them essential for safeguarding perishables, powders, resins, pharmaceuticals, and other sensitive goods. The rise of e-commerce, cold-chain distribution, and global bulk shipping has increased demand for strong, leak-resistant liners that maintain material integrity across long transit times and varying environmental conditions.
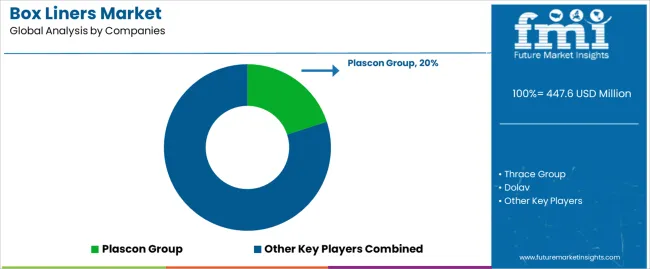
Plascon Group, Thrace Group, and Dolav supply heavy-duty liners designed for industrial and food-grade packaging applications, with an emphasis on durability and regulatory compliance. Champion Plastics and IMPAK Corporation offer a wide range of polyethylene and specialty barrier liners that cater to custom packaging formats and batch production requirements.
CDF Corporation and Protective Lining Corp. are known for engineered liners that fit intermediate bulk containers, drums, and pallet boxes, enabling clean, reusable packaging systems. International Plastics Inc. provides economy and specialty liners across commercial and distribution applications, while Berry Global Inc. continues to expand high-performance film technologies that improve puncture resistance, sealing performance, and recyclability. As sustainability pressures increase, demand is shifting toward thinner, stronger recyclable liner solutions and closed-loop packaging programs.
| Stakeholder Type | Primary Advantage | Repeatable Plays |
|---|---|---|
| Established film converters | Production scale, material expertise, quality consistency | Long-term supply contracts, multi-gauge capability, certified food-grade production |
| Specialized liner manufacturers | Application knowledge, customization, customer relationships | Industry-specific solutions, technical support, rapid prototyping |
| Vertically-integrated packaging companies | Comprehensive solutions, supply chain control, end-user relationships | Integrated packaging systems, logistics coordination, value-chain optimization |
| Regional producers & flexible converters | Market proximity, service flexibility, rapid response | Local inventory, custom runs, expedited delivery, relationship-based service |
| Sustainable material innovators | Recycled content, biodegradable options, environmental credentials | Circular economy partnerships, sustainability certification, green marketing support |
| Items | Values |
|---|---|
| Quantitative Units | USD 447.6 million |
| Product Type | PEP, Side Gusseted, PEP Jumbo, Others |
| Thinness | 3-6 Mil, From 6 to 8 Mil, From 4 to 6 Mil |
| Material Type | HDPE, LDPE, LLDPE |
| Regions Covered | North America, Latin America, Europe, Asia Pacific, Middle East & Africa |
| Country Covered | United States, Germany, United Kingdom, China, India, Japan, and other 40+ countries |
| Key Companies Profiled | Plascon Group, Thrace Group, Dolav, Champion Plastics, IMPAK Corporation, Mettcover, CDF Corporation, Protective Lining Corp., International Plastics Inc., and Berry Global Inc. |
| Additional Attributes | Dollar sales by product type/thinness/material type, regional demand (NA, EU, APAC), competitive landscape, food-grade vs. industrial adoption, sustainable material integration, and advanced film technology innovations driving contamination prevention, supply chain efficiency, and environmental sustainability |
The global box liners market is estimated to be valued at USD 447.6 million in 2025.
The market size for the box liners market is projected to reach USD 675.4 million by 2035.
The box liners market is expected to grow at a 4.2% CAGR between 2025 and 2035.
The key product types in box liners market are pep, side gusseted, pep jumbo and others.
In terms of thinness, 3-6 mil segment to command 40.0% share in the box liners market in 2025.


Our Research Products

The "Full Research Suite" delivers actionable market intel, deep dives on markets or technologies, so clients act faster, cut risk, and unlock growth.

The Leaderboard benchmarks and ranks top vendors, classifying them as Established Leaders, Leading Challengers, or Disruptors & Challengers.

Locates where complements amplify value and substitutes erode it, forecasting net impact by horizon

We deliver granular, decision-grade intel: market sizing, 5-year forecasts, pricing, adoption, usage, revenue, and operational KPIs—plus competitor tracking, regulation, and value chains—across 60 countries broadly.

Spot the shifts before they hit your P&L. We track inflection points, adoption curves, pricing moves, and ecosystem plays to show where demand is heading, why it is changing, and what to do next across high-growth markets and disruptive tech

Real-time reads of user behavior. We track shifting priorities, perceptions of today’s and next-gen services, and provider experience, then pace how fast tech moves from trial to adoption, blending buyer, consumer, and channel inputs with social signals (#WhySwitch, #UX).

Partner with our analyst team to build a custom report designed around your business priorities. From analysing market trends to assessing competitors or crafting bespoke datasets, we tailor insights to your needs.
Supplier Intelligence
Discovery & Profiling
Capacity & Footprint
Performance & Risk
Compliance & Governance
Commercial Readiness
Who Supplies Whom
Scorecards & Shortlists
Playbooks & Docs
Category Intelligence
Definition & Scope
Demand & Use Cases
Cost Drivers
Market Structure
Supply Chain Map
Trade & Policy
Operating Norms
Deliverables
Buyer Intelligence
Account Basics
Spend & Scope
Procurement Model
Vendor Requirements
Terms & Policies
Entry Strategy
Pain Points & Triggers
Outputs
Pricing Analysis
Benchmarks
Trends
Should-Cost
Indexation
Landed Cost
Commercial Terms
Deliverables
Brand Analysis
Positioning & Value Prop
Share & Presence
Customer Evidence
Go-to-Market
Digital & Reputation
Compliance & Trust
KPIs & Gaps
Outputs
Full Research Suite comprises of:
Market outlook & trends analysis
Interviews & case studies
Strategic recommendations
Vendor profiles & capabilities analysis
5-year forecasts
8 regions and 60+ country-level data splits
Market segment data splits
12 months of continuous data updates
DELIVERED AS:
PDF EXCEL ONLINE
Industry Share Analysis for Box Liners Companies
Demand for Box Liners in Japan Size and Share Forecast Outlook 2025 to 2035
Demand for Box Liners in USA Size and Share Forecast Outlook 2025 to 2035
Insulated Thermal Box Liners Market
Boxboard Packaging Market Analysis - Size, Share, and Forecast Outlook 2025 to 2035
Box Compression Tester Market Size and Share Forecast Outlook 2025 to 2035
Box Latch Market Size and Share Forecast Outlook 2025 to 2035
Box Pouch Market by Pouch Type from 2025 to 2035
Box Filling Machine Market from 2025 to 2035
Box and Carton Overwrap Films Market Demand and Growth
Box and Carton Overwrapping Machines Market Insights and Growth 2025 to 2035
Boxcar Scars Market – Demand, Growth & Forecast 2025 to 2035
Box Sealing Machines Market Trends – Growth & Forecast 2025 to 2035
Competitive Breakdown of Box Pouch Providers
Market Share Insights of Boxboard Packaging Providers
Box Latch Market Positioning & Competitive Analysis
Carboxymethyl Tamarind Kernel Powder Market Size and Share Forecast Outlook 2025 to 2035
Carboxymethyl Tamarind Gum (CMT) Market Size and Share Forecast Outlook 2025 to 2035
Carboxylic Acid Market Size and Share Forecast Outlook 2025 to 2035
Carboxylated Nitrile Rubber Market Size and Share Forecast Outlook 2025 to 2035

Thank you!
You will receive an email from our Business Development Manager. Please be sure to check your SPAM/JUNK folder too.
Chat With
MaRIA