Reports

- Global Locations -

Headquarters

Future Market Insights, Inc.

Christiana Corporate, 200
Continental Drive, Suite 401,
Newark, Delaware - 19713,
United States

T: +1-845-579-5705

Americas

Future Market Insights, Inc.

616 Corporate Way, Suite 2-9018,
Valley Cottage, NY 10989, United States

T: +1-347-918-3531

MEA

Future Market Insights

1602-6 Jumeirah Bay X2 Tower, Plot No: JLT-PH2-X2A,
Jumeirah Lakes Towers, Dubai,
United Arab Emirates

Europe

Future Market Insights

3rd Floor, 207 Regent Street,
W1B 3HH London
United Kingdom

T: + 44 (0) 20 8123 9659
D: +44 (0) 20 3287 4268

Asia Pacific

Future Market Insights

IndiaLand Global Tech Park, Unit UG-1, Behind Grand HighStreet, Phase 1, Hinjawadi, MH, Pune – 411057, India

Carboxy Therapy Market Outlook

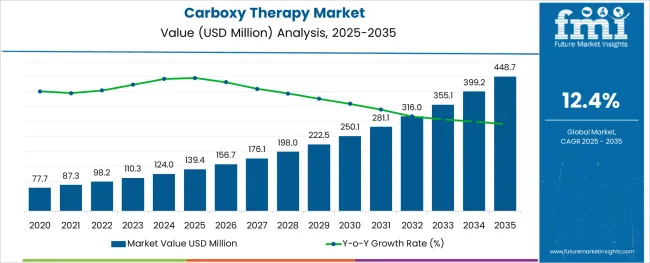
The global carboxy therapy demand is subjected to growth at a CAGR of 12.4%. The market revenue is likely to be valued at US$ 98.2 Million in 2022, and exhibit a revenue growth to achieve US$ 308.37 Million by 2032. The growth in the market is ascribed to the following:

  • Increasing physician and patient awareness about the therapeutic advantages of carboxy therapy units, particularly in affluent nations is estimated to propel the adoption of carboxy therapy.
  • Outpatient operations are becoming more popular amongst healthcare institutions such as hospitals and clinics due to the availability of minimally invasive techniques such as carboxy therapy.
  • In nations where carboxy therapy units have been established, the number of healthcare facilities has increased which is expected to surge the growth of the carboxy therapy market share.
  • The availability of more inexpensive and higher-performing goods, as a result of technological advancements, allows them to give relief for a variety of clinical diseases such as inflammation and chronic back pain.
Report Attribute Details
Carboxy Therapy Market Value (2022) US$ 98.2 Million
Carboxy Therapy Market Anticipated Value (2032) US$ 308.37 Million
Carboxy Therapy Projected Growth Rate (2032) 12.4%

Don't pay for what you don't need

Customize your report by selecting specific countries or regions and save 30%!

Why consumers across the globe trust the potential of carboxy therapy treatments?

Carboxy therapy is currently one of the most well-liked and fascinating treatments, particularly in Europe and North America. It provides incredible opportunities for treating skin disorders and hair loss that have hitherto been difficult to cure.

To grab the opportunities presented by the market, a key market player unveiled an iteration of carbon dioxide therapy, called DIOX. It makes use of patent technology that provides an intelligent interface for the micro-injection of CO2 that may be given subcutaneously or intradermally.

The adoption of carboxy therapy systems is expected to enhance tissue oxygenation and jump-start the body's natural healing processes. New cell growth and enhanced circulation follow from this. These benefits of caboxy therapy are leading to growth opportunities that need to be cashed on. Key players are grabbing such opportunities and propelling the market further.

Advanced technologies are being incorporated into carboxy therapy devices

Because of its remarkable safety record and regenerating abilities, carboxy therapy is referred to as a green treatment which is an attractive factor for manufacturers of devices required for the therapy. Sterile CO2 may be administered with automated flow rate, injection timing, and total dosage control, thanks to the DIOX system which was launched to utilize the opportunities created in the market due to the usefulness of carboxy therapy.

Furthermore, patented technology, an intelligent touchscreen interface, automatic and manual modes, a heating system to reduce discomfort, high and low-pressure sensors to provide additional safety measures, specialized software with digital sensors for temperature control, and filters for accurate CO2 control, etc. are some of the features of the treatment. These factors are estimated to surge the growth of the carboxy therapy market.

Nikhil Kaitwade
Nikhil Kaitwade

Principal Consultant

Talk to Analyst

Find your sweet spots for generating winning opportunities in this market.

This treatment is both natural, and cost-effective!

Carboxy therapy is 100% natural, according to key players, and there is no possibility of an allergic response. Additionally, it requires very few consumables and has a low per-treatment cost of US$ 11.81, which is an attractive element for choosing the treatment method. Moreover, it uses a user-friendly digital interface and programs for an expedited treatment setup. The great therapeutic profitability of carboxy therapy and the physiological safety of CO2 use, are additional benefits that act as stimulants for market growth. These processes may be carried out at any time and place, regardless of the time of year, the amount of sunlight, or the temperature outside. This means that the therapy can be performed any time of the year, regardless of temperature restraints, thus proving to be a booster for the market.

Key players are utilizing carboxy therapy devices to penetrate the market!

The adoption of carboxy therapy is likely to rise as the use of carbon dioxide treatment complements and enhances a variety of procedures and does not interfere with those involving botulinum toxin, fillers, or lasers. In addition, the devices made for carboxy therapy include an automated program and manual mode, are small and effective, perfect for use at home or with carbon treatments, and have high and low-pressure sensors that increase treatment application security.

Presented by a particular top market participant, the 'trolley-mounted carboxy therapy unit', is the newest easy-tech desktop equipment for microinjection of medical carbon dioxide (CO2), that delivers subcutaneously and intradermally, as well as transdermal insufflation of hyperbaric oxygen (O2). Such devices are expected to surge the demand for carboxy therapy, globally.

Treatments and solutions in the global carboxy treatment market are in high demand because of their lack of long-term negative effects. Moreover, these therapy treatments are popular because they are quick (15 to 30 minutes for each session) and involve no downtime, allowing patients to continue their daily lives without having to take any extra measures or care.

Medical practitioners also employ carboxy therapy to treat a variety of illnesses caused by poor blood circulation, such as erectile dysfunction, Raynaud's syndrome, alopecia, and acute arthritis. Additionally, its ability to remove stretch marks makes it a successful and widely used medical therapy which is anticipated to spark innovations in the carboxy therapy market trends.

Get the data you need at a Fraction of the cost

Personalize your report by choosing insights you need
and save 40%!

A Contrast with the Historical Market Scenario

The statistics accumulated by Future Market Insights, reveal the global market of carboxy therapy witnessed an unprecedented surge over the past few years. The key providers in the market are in conjunction with the increasing demand for carboxy therapy. There has been a gradual rise from a CAGR of 12% registered during the period of 2016 to 2020 which is likely to expand at a steady 12.4% in the forecast period.

According to the International Society of Aesthetic Plastic Surgery (ISAPS), 14 Bn minimally invasive cosmetic operations were done globally till 2020. The use of these treatments increased by 22.7% between 2016 and 2020, across the globe. The number of nonsurgical cosmetic operations grew by 44% in 2021 compared to 2020, as stated according to ISAPS.

Minimally invasive techniques have evolved continuously in the last 20 years. In the USA, clinicians conducted 13.2 Mn minimally invasive surgeries in 2020. Carboxy therapy, commonly known as Carbon Dioxide Therapy, first appeared in the royal baths of France over 80 years ago. Patients who soaked in the carbon dioxide-rich thermal waters on a regular basis had faster wound healing. It was later discovered that exposing the skin to carbon dioxide enhanced blood circulation as well as the texture and flexibility of the skin.

Carboxy therapy is gaining popularity as a life-changing treatment in the medical and aesthetic industries. Many contemporary procedures are being employed in beauty salons to enhance the condition of the skin. There are several revolutionary healing methods and specialized devices on the market. As a result, selecting a single therapy that guarantees all of the desired outcomes might be difficult. In such circumstances, it is worthwhile to employ tried-and-true therapeutic approaches that have been utilized for many years in cosmetology and aesthetic medicine. This is true with Carboxy therapy treatment. This is estimated to surge the adoption of carboxy therapy in the forecast period.

Comparative Analysis of Adjacent Markets

Carboxy Therapy Market:

Attributes Carboxy Therapy Market
CAGR (2022 to 2032) 12.4%
Market Value (2032) US$ 308.37 Million
Growth Factor It has the ability to effectively treat cellulite, stretch marks, and dark under-eye circles. Moreover, it improves the skin's appearance and elasticity with its ability to stimulate circulation and collagen production.
Opportunity The growing adoption of non-invasive aesthetic procedures, increased demand for antiaging treatments, and surge in the geriatric population.
Restraints Regulatory policies and safety concerns associated with carboxy therapy.

Allergy Immunotherapy Market:

Attributes Allergy Immunotherapy Market
CAGR (2022 to 2032) 8.89%
Market Value (2032) US$ 5.27 Billion
Growth Factor The growing incidence of allergies and the subsequent spending on medical treatments are enabling market players to enhance their treatment offerings.
Opportunity Rising awareness of the availability of these treatments leads to an increasing number of people having allergies, and are willing to seek treatment.
Restraints The high cost of the treatment and the side-effects of these treatments.

Oxygen Therapy Equipment Market:

Attributes Oxygen Therapy Equipment Market
CAGR (2022 to 2032) 7.4%
Market Value (2032) US$ 6.87 Billion
Growth Factor Chronic respiratory diseases affect more than 1 Bn people, globally, as per the Global Asthma report, 2018. COPD, with tobacco smoking as its root cause, has affected a significant part of the world population, as per the WHO.
Opportunity Global competitors are entering the market, demand for portable technology by consumers, and the clinical urgency for greater mobility support for the geriatric population.
Restraints High costs associated with oxygen concentrators and side effects involving nasal dryness and skin irritation lined with the therapeutic utilization of this equipment.

Category-wise Insights

Tabletop - By Type

By type, the market is segmented into tabletop, portable, and other devices. It has been studied by the analysts at Future Market Insights that the tabletop device is estimated to hold a major market share, recording a CAGR of 12.6% through the forecast period.

The pivotal aspects determining the momentum of this segment are:

  • This device is widely used for pain management and medical aesthetics and is deployed by most dermatology clinics.
  • Its cosmetic applications include eye sacks, neck, stretch marks, and cellulite improvement and it comes equipped with local injections of CO2 for pain management.

Hospitals - By End User Type

By end user, the market is segmented into hospitals, aesthetic clinics, and beauty centers. It has been studied by the analysts at Future Market Insights that the hospital segment is estimated to hold a major market share, recording a CAGR of 12.7% through the forecast period.

The vital elements determining the momentum of this segment are:

  • These devices have been embraced by healthcare institutions and are utilized to give pain relief from a variety of clinical disorders such as inflammation, chronic back pain, and so on, as well as for various outpatient procedures.
  • Demand for non-invasive or minimally invasive procedures such as laser resurfacing, cosmetic injectables, and other services is increasing.

Quicker Healing, Less Healing, Patient Satisfaction & Other Drivers

A significant contributor to the global carboxy treatment industry is the rising geriatric population. According to the United Nations, the rate of population aging in the 21st century is expected to outpace that of the preceding century. In the year 2020, about 727 Mn individuals were aged 65 and more, globally, as stated by the World Health Organization. This is estimated to drive the demand for carboxy therapy.

Minimally invasive procedures provide quicker healing, less scarring, less stress, and more patient satisfaction. The modern concept of natural and harmonious rejuvenation is based on a comprehensive, three-dimensional, multi-layered approach that incorporates a variety of active ingredients and techniques in procedures such as skin relaxation, surface renewal, and skin tightening, depending on the needs of the individual patient. This is likely to surge the deployment of this procedure.

Since the look of the skin is seen as an important aspect of well-being and health, the number of cosmetic treatments performed globally is rapidly growing. Furthermore, unlike more risky surgical treatments, this procedure often does not need substantial training. Hence, the carboxy therapy market size is likely to expand in the forecast period.

Safety Issues, Side Effects & Other Obstructions along with Future Opportunities

People with sensitive skin may be prone to side effects or inflammation as a consequence of undergoing carboxy therapy. Furthermore, rigorous regulatory rules and safety issues related to carboxy therapy are expected to impede global market growth throughout the forecast period.

On the contrary, the elimination of cultural barriers and social taboos increases the frequency of cosmetic procedures across the globe. Another key driver which is expected to fuel the global carboxy therapy market size is a rise in societal knowledge about the value of personal appearance and personality development. These factors are further anticipated to create market opportunities in the forecast period.
Region-Wise Insights

Consumers in the USA Opt for the Therapy to Boost Collagen and Treat Cellulite

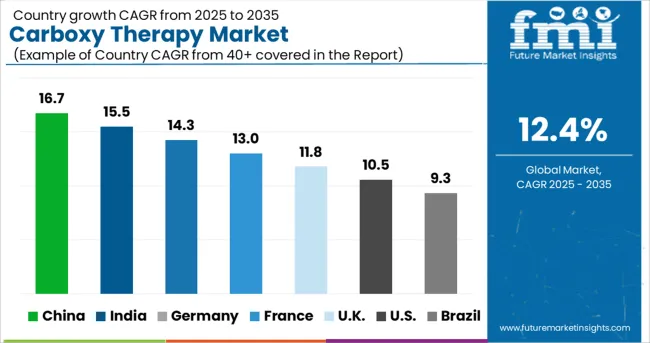
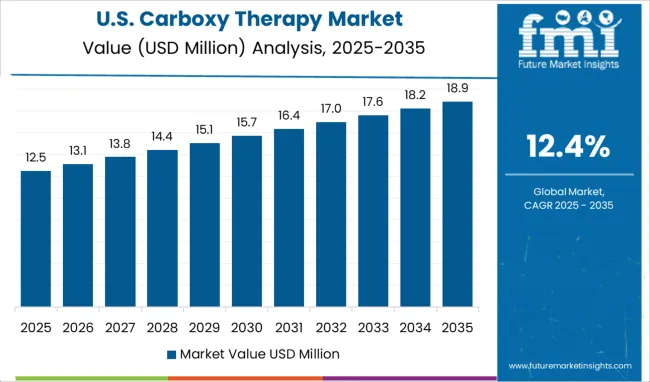
During the forecast period, North America is expected to account for the largest share of the global carboxy therapy market with a significant revenue share. This region's market is expected to rise due to an increase in consumer demand for anti-aging therapies, as well as an increase in the living standards and income of the major population. Moreover, according to the International Society of Aesthetic Plastic Surgery, in 2020, 174,300 photo rejuvenation operations were performed in the USA.

Key players in the USA largely concentrate on the effective use of carboxy therapy to treat stretch marks, cellulite, and hypertrophic scars. Moreover, the demand for carboxy therapy is estimated to boost in the country as doctors advise it as a substitute for liposuction for those who are unwilling to undergo anesthesia and surgical procedures. Additionally, in order to help patients with their carboxy therapy treatment, experienced nurse practitioners are ready and willing to assist.

Carboxy therapy procedures are frequently availed by consumers in the U.S., to boost metabolism/fat burning, reduce cellulite, enhance skin tone and texture for firmer skin, lessen fine lines and wrinkles, and stimulate collagen synthesis. Additionally, key players also provide carboxy therapy, which is a potent way to boost healthy circulation and naturally enhance the oxygen in treated areas.

Market players also offer organic remedies, like carboxy therapy, to aid in enhancing health and beauty. Additionally, throughout the carboxy therapy treatment, their estheticians employ carbon dioxide to increase circulation in order to create a variety of aesthetically pleasing outcomes. This is likely to expand the global carboxy therapy market size.

Top companies assert that these procedures provide results quickly, but for the most perceptible results, a full course of therapy should involve 4 to 6 sessions spaced one month apart. Furthermore, for years, the country has safely employed carbon dioxide infusion to facilitate endoscopic abdominal procedures. The number of sessions depends on the specific condition being treated for each patient.

The United Kingdom Has Witnessed a Proliferation of Dermatology Departments and Clinics

Europe is a significant carboxy therapy market with a notable revenue share. This is attributed to the bulk of these devices being employed by healthcare facilities in this region, which have surged the growth of revenues over time and are likely to continue to grow as more patients and doctors become aware of their therapeutic benefits. Moreover, the proliferation of dermatology departments and clinics in the region is expected to drive the demand for carboxy therapy.

Key participants in the United Kingdom claim that in a 4 - 6 week program or course, results of carboxy therapy are likely to become apparent after the second or third treatment. In addition, they assert that depending on the area treated and the sensitivity of the skin, there may be bruising following treatment that goes away in 3 to 7 days. Furthermore, they also claim that all treatments are performed expertly, and appropriate guidance is given before the procedure.

Clinics are using patented technology to provide sophisticated interfaces for subcutaneous or intradermal micro-injections of CO2. In addition, with automatic control of the flow rate, injection time, and total dose, the adoption of a carboxy therapy system enables the delivery of sterile CO2. Moreover, medical businesses assure their clients that they are in the capable hands of doctors and other skilled professionals.

Consumers in Italy Are Adopting Handheld Carboxy Therapy Devices

Italy is a lucrative carboxy therapy market owing to the desire of the key demographic on enhancing their facial and bodily features. This is attributed to the high adoption of carboxy therapy, plastic surgeries, and other cosmetic procedures and products. Moreover, top clinics in the country work to increase the skin's elasticity, brightness, and radiance by oxygenating and improving the skin's texture.

Treatment is administered at a day hospital using microinjections in various dosages. These are typically injected with extremely fine needles into the joints of the limbs or cellulite-prone areas. In addition, the country has witnessed an increasing deployment of hand-held carboxy therapy medical devices This is anticipated to contribute to the carboxy therapy market growth.

Due to the acceptance of modern technology in the country, carbon dioxide can be used in treatments at medical facilities using equipment that supplies carbon dioxide and is approved by the Ministry of Health, with the amount and timing being managed by the doctor. Furthermore, when surgery is not yet required or after a saphenectomy operation, clinics use carboxy therapy to reactivate circulation, aid in the healing of ulcers, and minimize varicose veins. This is estimated to surge the global carboxy therapy market growth.

In India, People Are Interested In Fat Reduction and Skin Smoothening Surgeries

India is a growing carboxy therapy market with a remarkable revenue share. This is owing to growth in the geriatric population, along with an increase in cosmetic surgeries, and the popularity of anti-aging treatments, devices, products, and services which are becoming increasingly popular in the country. Moreover, because it is often used for pain relief and medical aesthetics, the need for tabletop carboxy therapy machines is growing.

After a comprehensive confidential consultation, the best non-surgical procedure is established. As the leading trauma and carboxy therapy surgeons in the major cities, they are experts in restoring the skin's health, beauty, and smoothness.

In addition, the country has witnessed a surge in fat reduction surgeries due to consumer demand which is likely to increase the adoption of carboxy therapy. Hence, the procedure is mainly used to treat cellulite reduction, dark under-eye bags, stretch marks, and non-surgical fat sculpting on the body and face.

In the fields of skincare, hair care, cosmetic treatment, laser therapy, and plastic surgery, India has seen the emergence of various clinics that are ISO 9001-2008 certified and offer the highest level of care available. Furthermore, the advantages of this new method, according to market players, are that it is safe and uses economical gas which is injected into fat pockets. Patients who enjoy natural therapy could prefer it. This is likely to contribute to the growth of the carboxy therapy market share in this region.
New Entrants Are Catching up with Key Market Players with Innovative Solutions: Start-up Economy

Start-up companies are focusing on providing equipment, machine components, and other solutions that aid market players in securing the adoption of carboxy therapy amongst consumers, as an effective non-surgical treatment:
  • Cell Therapy Equipment (CTE) - It is a life science instruments company specializing in the design, development, and manufacturing of instrument systems for the culture and harvest of cells for cell therapy applications. The company has products that enable cell culture and harvesting, from small to very large scales, and includes the single-use benchtop CellCradle system to the production-scale TideCell platform for the culture of anchorage-dependent cells. Their ASEPTiCell system is a robotic filling module for the filling of live cells into ready-to-use vials, ampoules, and syringes.
  • AvanBio - It is a biotech company specializing in the development and manufacturing of Nano-scale superparamagnetic beads for DNA/RNA/protein purification. The Nano-superparamagnetic beads coated with primary amine functional groups can be used to covalently conjugate primary amine or carboxy-containing ligands. Additionally, the company also develops customized magnetic beads to enhance research and development.

Top 5 Key Companies Revolutionizing the Carboxy Therapy Market Space

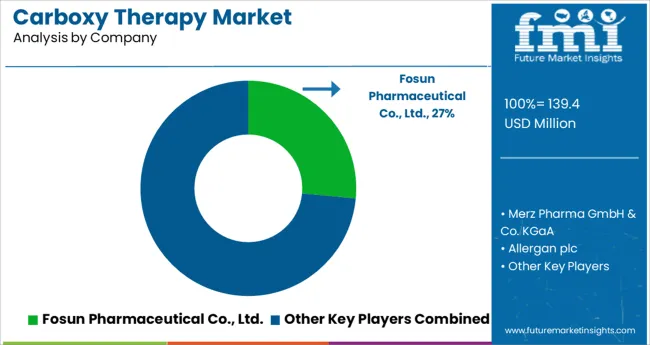
The carboxy therapy market share is highly competitive owing to the involvement of several established players. Organic development tactics such as product releases and approvals are often used by firms in the carboxy treatment industry. To capitalize on market growth prospects, market players are concentrating on strengthening their footprint through acquisitions, expansions, product approvals, and launches.

  • In January 2020, Cosmo Pro Ltd. launched the DIOX carboxytherapy system. The DIOX system features a touch-screen interface and both automatic and manual modes.

TOP MARKET PLAYERS IN THE CARBOXY THERAPY MARKET:

  • DTA Medical - It is a brand of Acea Medica company, based in Milan, creating and commercializing electrical-medical appliances and cosmetics.
  • Fosun Pharmaceutical Co. Ltd. - Is a Chinese pharmaceutical company. It is mostly owned by Fosun International. As of 2018, the A shares of the company are a constituent of the SSE 180 Index as well as its sub-index SSE MidCap Index.
  • Merz Pharma GmbH & Co. KGaA - It is a privately-held pharmaceutical company based in Frankfurt, Germany, with affiliates across Europe, as well as the USA, Canada, Mexico, Brazil, and Asia-Pacific and regional headquarters in Singapore and North Carolina, USA. It is a global, family-owned company inspired by more than 110 years of innovation, commitment, and trust. Driven by the opportunity to help people look better, feel better, and live better
  • Cosmo Pro Ltd. - It is a multi-award-winning training academy and manufacturer. They place innovation, science, and safety at the heart of everything they do. They strive to stay ahead of the curve and provide solutions and products to improve skin health and well-being. For this reason, over the years Cosmo Pro has focused on research and development, product development, and marketing to deliver a unique portfolio backed by science and clinical evidence.
  • Allergan plc - It is an American, Irish-domiciled pharmaceutical company that acquires, develops, manufactures, and markets brand-name drugs and medical devices in the areas of medical aesthetics, eye care, central nervous system, and gastroenterology. The company is the maker of Botox.

OTHER MARKET PARTICPANTS OF CARBOXY THERAPY MARKET

Key Segments Profiled in the Carboxy Therapy Market Survey

By Type:

  • Tabletop
  • Portable
  • Others

By Application:

  • Aesthetic Medicine
  • Dermatology
  • Gynaecology
  • Angiology
  • Orthopedics
  • Rheumatology
  • Sports Medicines
  • Others

By End User:

  • Hospitals
  • Aesthetic Clinics
  • Beauty Centers

By Region:

  • North America
  • Latin America
  • Asia Pacific
  • Middle East and Africa(MEA)
  • Europe

Frequently Asked Questions

How is the Carboxy Therapy Market Growing?

The carboxy therapy market is predicated to grow at a CAGR of 12.4% during the forecast period.

Why does the Carboxy Therapy Market have high growth potential?

Minimally invasive procedures, such as carboxy therapy, provide quicker healing, less scarring, and more satisfaction.

Where is the Carboxy Therapy Market most dominant?

North America is expected to hold a major share of the market, followed by the Asia Pacific.

Table of Content

1. Executive Summary | Carboxy Therapy Market

    1.1. Global Market Outlook

    1.2. Demand-side Trends

    1.3. Supply-side Trends

    1.4. Technology Roadmap Analysis

    1.5. Analysis and Recommendations

2. Market Overview

    2.1. Market Coverage / Taxonomy

    2.2. Market Definition / Scope / Limitations

3. Market Background

    3.1. Market Dynamics

        3.1.1. Drivers

        3.1.2. Restraints

        3.1.3. Opportunity

        3.1.4. Trends

    3.2. Scenario Forecast

        3.2.1. Demand in Optimistic Scenario

        3.2.2. Demand in Likely Scenario

        3.2.3. Demand in Conservative Scenario

    3.3. Opportunity Map Analysis

    3.4. Investment Feasibility Matrix

    3.5. PESTLE and Porter’s Analysis

    3.6. Regulatory Landscape

        3.6.1. By Key Regions

        3.6.2. By Key Countries

    3.7. Regional Parent Market Outlook

4. Global Market Analysis 2017 to 2021 and Forecast, 2022 to 2032

    4.1. Historical Market Size Value (US$ Million) Analysis, 2017 to 2021

    4.2. Current and Future Market Size Value (US$ Million) Projections, 2022 to 2032

        4.2.1. Y-o-Y Growth Trend Analysis

        4.2.2. Absolute $ Opportunity Analysis

5. Global Market Analysis 2017 to 2021 and Forecast 2022 to 2032, By Route of administration

    5.1. Introduction / Key Findings

    5.2. Historical Market Size Value (US$ Million) Analysis By Route of administration, 2017 to 2021

    5.3. Current and Future Market Size Value (US$ Million) Analysis and Forecast By Route of administration, 2022 to 2032

        5.3.1. Subcutaneous

        5.3.2. Epicutaneous

        5.3.3. Others

    5.4. Y-o-Y Growth Trend Analysis By Route of administration, 2017 to 2021

    5.5. Absolute $ Opportunity Analysis By Route of administration, 2022 to 2032

6. Global Market Analysis 2017 to 2021 and Forecast 2022 to 2032, By End-user

    6.1. Introduction / Key Findings

    6.2. Historical Market Size Value (US$ Million) Analysis By End-user, 2017 to 2021

    6.3. Current and Future Market Size Value (US$ Million) Analysis and Forecast By End-user, 2022 to 2032

        6.3.1. Hospitals

        6.3.2. Clinics

        6.3.3. Beauty Centers

        6.3.4. Others

    6.4. Y-o-Y Growth Trend Analysis By End-user, 2017 to 2021

    6.5. Absolute $ Opportunity Analysis By End-user, 2022 to 2032

7. Global Market Analysis 2017 to 2021 and Forecast 2022 to 2032, By Region

    7.1. Introduction

    7.2. Historical Market Size Value (US$ Million) Analysis By Region, 2017 to 2021

    7.3. Current Market Size Value (US$ Million) Analysis and Forecast By Region, 2022 to 2032

        7.3.1. North America

        7.3.2. Latin America

        7.3.3. Europe

        7.3.4. South Asia

        7.3.5. East Asia

        7.3.6. Oceania

        7.3.7. Middle East and Africa(MEA)

    7.4. Market Attractiveness Analysis By Region

8. North America Market Analysis 2017 to 2021 and Forecast 2022 to 2032, By Country

    8.1. Historical Market Size Value (US$ Million) Trend Analysis By Market Taxonomy, 2017 to 2021

    8.2. Market Size Value (US$ Million) Forecast By Market Taxonomy, 2022 to 2032

        8.2.1. By Country

            8.2.1.1. USA

            8.2.1.2. Canada

        8.2.2. By Route of administration

        8.2.3. By End-user

    8.3. Market Attractiveness Analysis

        8.3.1. By Country

        8.3.2. By Route of administration

        8.3.3. By End-user

    8.4. Key Takeaways

9. Latin America Market Analysis 2017 to 2021 and Forecast 2022 to 2032, By Country

    9.1. Historical Market Size Value (US$ Million) Trend Analysis By Market Taxonomy, 2017 to 2021

    9.2. Market Size Value (US$ Million) Forecast By Market Taxonomy, 2022 to 2032

        9.2.1. By Country

            9.2.1.1. Brazil

            9.2.1.2. Mexico

            9.2.1.3. Rest of Latin America

        9.2.2. By Route of administration

        9.2.3. By End-user

    9.3. Market Attractiveness Analysis

        9.3.1. By Country

        9.3.2. By Route of administration

        9.3.3. By End-user

    9.4. Key Takeaways

10. Europe Market Analysis 2017 to 2021 and Forecast 2022 to 2032, By Country

    10.1. Historical Market Size Value (US$ Million) Trend Analysis By Market Taxonomy, 2017 to 2021

    10.2. Market Size Value (US$ Million) Forecast By Market Taxonomy, 2022 to 2032

        10.2.1. By Country

            10.2.1.1. Germany

            10.2.1.2. United Kingdom

            10.2.1.3. France

            10.2.1.4. Spain

            10.2.1.5. Italy

            10.2.1.6. Rest of Europe

        10.2.2. By Route of administration

        10.2.3. By End-user

    10.3. Market Attractiveness Analysis

        10.3.1. By Country

        10.3.2. By Route of administration

        10.3.3. By End-user

    10.4. Key Takeaways

11. South Asia Market Analysis 2017 to 2021 and Forecast 2022 to 2032, By Country

    11.1. Historical Market Size Value (US$ Million) Trend Analysis By Market Taxonomy, 2017 to 2021

    11.2. Market Size Value (US$ Million) Forecast By Market Taxonomy, 2022 to 2032

        11.2.1. By Country

            11.2.1.1. India

            11.2.1.2. Malaysia

            11.2.1.3. Singapore

            11.2.1.4. Thailand

            11.2.1.5. Rest of South Asia

        11.2.2. By Route of administration

        11.2.3. By End-user

    11.3. Market Attractiveness Analysis

        11.3.1. By Country

        11.3.2. By Route of administration

        11.3.3. By End-user

    11.4. Key Takeaways

12. East Asia Market Analysis 2017 to 2021 and Forecast 2022 to 2032, By Country

    12.1. Historical Market Size Value (US$ Million) Trend Analysis By Market Taxonomy, 2017 to 2021

    12.2. Market Size Value (US$ Million) Forecast By Market Taxonomy, 2022 to 2032

        12.2.1. By Country

            12.2.1.1. China

            12.2.1.2. Japan

            12.2.1.3. South Korea

        12.2.2. By Route of administration

        12.2.3. By End-user

    12.3. Market Attractiveness Analysis

        12.3.1. By Country

        12.3.2. By Route of administration

        12.3.3. By End-user

    12.4. Key Takeaways

13. Oceania Market Analysis 2017 to 2021 and Forecast 2022 to 2032, By Country

    13.1. Historical Market Size Value (US$ Million) Trend Analysis By Market Taxonomy, 2017 to 2021

    13.2. Market Size Value (US$ Million) Forecast By Market Taxonomy, 2022 to 2032

        13.2.1. By Country

            13.2.1.1. Australia

            13.2.1.2. New Zealand

        13.2.2. By Route of administration

        13.2.3. By End-user

    13.3. Market Attractiveness Analysis

        13.3.1. By Country

        13.3.2. By Route of administration

        13.3.3. By End-user

    13.4. Key Takeaways

14. MEA Market Analysis 2017 to 2021 and Forecast 2022 to 2032, By Country

    14.1. Historical Market Size Value (US$ Million) Trend Analysis By Market Taxonomy, 2017 to 2021

    14.2. Market Size Value (US$ Million) Forecast By Market Taxonomy, 2022 to 2032

        14.2.1. By Country

            14.2.1.1. GCC Countries

            14.2.1.2. South Africa

            14.2.1.3. Israel

            14.2.1.4. Rest of Middle East and Africa(MEA)

        14.2.2. By Route of administration

        14.2.3. By End-user

    14.3. Market Attractiveness Analysis

        14.3.1. By Country

        14.3.2. By Route of administration

        14.3.3. By End-user

    14.4. Key Takeaways

15. Key Countries Market Analysis

    15.1. USA

        15.1.1. Pricing Analysis

        15.1.2. Market Share Analysis, 2021

            15.1.2.1. By Route of administration

            15.1.2.2. By End-user

    15.2. Canada

        15.2.1. Pricing Analysis

        15.2.2. Market Share Analysis, 2021

            15.2.2.1. By Route of administration

            15.2.2.2. By End-user

    15.3. Brazil

        15.3.1. Pricing Analysis

        15.3.2. Market Share Analysis, 2021

            15.3.2.1. By Route of administration

            15.3.2.2. By End-user

    15.4. Mexico

        15.4.1. Pricing Analysis

        15.4.2. Market Share Analysis, 2021

            15.4.2.1. By Route of administration

            15.4.2.2. By End-user

    15.5. Germany

        15.5.1. Pricing Analysis

        15.5.2. Market Share Analysis, 2021

            15.5.2.1. By Route of administration

            15.5.2.2. By End-user

    15.6. United Kingdom

        15.6.1. Pricing Analysis

        15.6.2. Market Share Analysis, 2021

            15.6.2.1. By Route of administration

            15.6.2.2. By End-user

    15.7. France

        15.7.1. Pricing Analysis

        15.7.2. Market Share Analysis, 2021

            15.7.2.1. By Route of administration

            15.7.2.2. By End-user

    15.8. Spain

        15.8.1. Pricing Analysis

        15.8.2. Market Share Analysis, 2021

            15.8.2.1. By Route of administration

            15.8.2.2. By End-user

    15.9. Italy

        15.9.1. Pricing Analysis

        15.9.2. Market Share Analysis, 2021

            15.9.2.1. By Route of administration

            15.9.2.2. By End-user

    15.10. India

        15.10.1. Pricing Analysis

        15.10.2. Market Share Analysis, 2021

            15.10.2.1. By Route of administration

            15.10.2.2. By End-user

    15.11. Malaysia

        15.11.1. Pricing Analysis

        15.11.2. Market Share Analysis, 2021

            15.11.2.1. By Route of administration

            15.11.2.2. By End-user

    15.12. Singapore

        15.12.1. Pricing Analysis

        15.12.2. Market Share Analysis, 2021

            15.12.2.1. By Route of administration

            15.12.2.2. By End-user

    15.13. Thailand

        15.13.1. Pricing Analysis

        15.13.2. Market Share Analysis, 2021

            15.13.2.1. By Route of administration

            15.13.2.2. By End-user

    15.14. China

        15.14.1. Pricing Analysis

        15.14.2. Market Share Analysis, 2021

            15.14.2.1. By Route of administration

            15.14.2.2. By End-user

    15.15. Japan

        15.15.1. Pricing Analysis

        15.15.2. Market Share Analysis, 2021

            15.15.2.1. By Route of administration

            15.15.2.2. By End-user

    15.16. South Korea

        15.16.1. Pricing Analysis

        15.16.2. Market Share Analysis, 2021

            15.16.2.1. By Route of administration

            15.16.2.2. By End-user

    15.17. Australia

        15.17.1. Pricing Analysis

        15.17.2. Market Share Analysis, 2021

            15.17.2.1. By Route of administration

            15.17.2.2. By End-user

    15.18. New Zealand

        15.18.1. Pricing Analysis

        15.18.2. Market Share Analysis, 2021

            15.18.2.1. By Route of administration

            15.18.2.2. By End-user

    15.19. GCC Countries

        15.19.1. Pricing Analysis

        15.19.2. Market Share Analysis, 2021

            15.19.2.1. By Route of administration

            15.19.2.2. By End-user

    15.20. South Africa

        15.20.1. Pricing Analysis

        15.20.2. Market Share Analysis, 2021

            15.20.2.1. By Route of administration

            15.20.2.2. By End-user

    15.21. Israel

        15.21.1. Pricing Analysis

        15.21.2. Market Share Analysis, 2021

            15.21.2.1. By Route of administration

            15.21.2.2. By End-user

16. Market Structure Analysis

    16.1. Competition Dashboard

    16.2. Competition Benchmarking

    16.3. Market Share Analysis of Top Players

        16.3.1. By Regional

        16.3.2. By Route of administration

        16.3.3. By End-user

17. Competition Analysis

    17.1. Competition Deep Dive

        17.1.1. Fosun Pharmaceutical Co., Ltd.

            17.1.1.1. Overview

            17.1.1.2. Product Portfolio

            17.1.1.3. Profitability by Market Segments

            17.1.1.4. Sales Footprint

            17.1.1.5. Strategy Overview

                17.1.1.5.1. Marketing Strategy

        17.1.2. Merz Pharma GmbH & Co. KGaA

            17.1.2.1. Overview

            17.1.2.2. Product Portfolio

            17.1.2.3. Profitability by Market Segments

            17.1.2.4. Sales Footprint

            17.1.2.5. Strategy Overview

                17.1.2.5.1. Marketing Strategy

        17.1.3. Allergan plc

            17.1.3.1. Overview

            17.1.3.2. Product Portfolio

            17.1.3.3. Profitability by Market Segments

            17.1.3.4. Sales Footprint

            17.1.3.5. Strategy Overview

                17.1.3.5.1. Marketing Strategy

        17.1.4. Alvi Prague

            17.1.4.1. Overview

            17.1.4.2. Product Portfolio

            17.1.4.3. Profitability by Market Segments

            17.1.4.4. Sales Footprint

            17.1.4.5. Strategy Overview

                17.1.4.5.1. Marketing Strategy

        17.1.5. JONTE

            17.1.5.1. Overview

            17.1.5.2. Product Portfolio

            17.1.5.3. Profitability by Market Segments

            17.1.5.4. Sales Footprint

            17.1.5.5. Strategy Overview

                17.1.5.5.1. Marketing Strategy

        17.1.6. Anti-Aging Medical Systems

            17.1.6.1. Overview

            17.1.6.2. Product Portfolio

            17.1.6.3. Profitability by Market Segments

            17.1.6.4. Sales Footprint

            17.1.6.5. Strategy Overview

                17.1.6.5.1. Marketing Strategy

        17.1.7. DTA Medical

            17.1.7.1. Overview

            17.1.7.2. Product Portfolio

            17.1.7.3. Profitability by Market Segments

            17.1.7.4. Sales Footprint

            17.1.7.5. Strategy Overview

                17.1.7.5.1. Marketing Strategy

        17.1.8. Cosmo Pro Ltd

            17.1.8.1. Overview

            17.1.8.2. Product Portfolio

            17.1.8.3. Profitability by Market Segments

            17.1.8.4. Sales Footprint

            17.1.8.5. Strategy Overview

                17.1.8.5.1. Marketing Strategy

        17.1.9. Carbossiterapia Italiana

            17.1.9.1. Overview

            17.1.9.2. Product Portfolio

            17.1.9.3. Profitability by Market Segments

            17.1.9.4. Sales Footprint

            17.1.9.5. Strategy Overview

                17.1.9.5.1. Marketing Strategy

        17.1.10. Kastner- Praxisbedarf

            17.1.10.1. Overview

            17.1.10.2. Product Portfolio

            17.1.10.3. Profitability by Market Segments

            17.1.10.4. Sales Footprint

            17.1.10.5. Strategy Overview

                17.1.10.5.1. Marketing Strategy

        17.1.11. Mezopharma

            17.1.11.1. Overview

            17.1.11.2. Product Portfolio

            17.1.11.3. Profitability by Market Segments

            17.1.11.4. Sales Footprint

            17.1.11.5. Strategy Overview

                17.1.11.5.1. Marketing Strategy

18. Assumptions & Acronyms Used

19. Research Methodology

Don't pay for what you don't need

Customize your report by selecting specific countries or regions and save 30%!

List of Tables

Table 1: Global Market Value (US$ Million) Forecast by Region, 2017 to 2032

Table 2: Global Market Value (US$ Million) Forecast by Route of administration, 2017 to 2032

Table 3: Global Market Value (US$ Million) Forecast by End-user, 2017 to 2032

Table 4: North America Market Value (US$ Million) Forecast by Country, 2017 to 2032

Table 5: North America Market Value (US$ Million) Forecast by Route of administration, 2017 to 2032

Table 6: North America Market Value (US$ Million) Forecast by End-user, 2017 to 2032

Table 7: Latin America Market Value (US$ Million) Forecast by Country, 2017 to 2032

Table 8: Latin America Market Value (US$ Million) Forecast by Route of administration, 2017 to 2032

Table 9: Latin America Market Value (US$ Million) Forecast by End-user, 2017 to 2032

Table 10: Europe Market Value (US$ Million) Forecast by Country, 2017 to 2032

Table 11: Europe Market Value (US$ Million) Forecast by Route of administration, 2017 to 2032

Table 12: Europe Market Value (US$ Million) Forecast by End-user, 2017 to 2032

Table 13: South Asia Market Value (US$ Million) Forecast by Country, 2017 to 2032

Table 14: South Asia Market Value (US$ Million) Forecast by Route of administration, 2017 to 2032

Table 15: South Asia Market Value (US$ Million) Forecast by End-user, 2017 to 2032

Table 16: East Asia Market Value (US$ Million) Forecast by Country, 2017 to 2032

Table 17: East Asia Market Value (US$ Million) Forecast by Route of administration, 2017 to 2032

Table 18: East Asia Market Value (US$ Million) Forecast by End-user, 2017 to 2032

Table 19: Oceania Market Value (US$ Million) Forecast by Country, 2017 to 2032

Table 20: Oceania Market Value (US$ Million) Forecast by Route of administration, 2017 to 2032

Table 21: Oceania Market Value (US$ Million) Forecast by End-user, 2017 to 2032

Table 22: MEA Market Value (US$ Million) Forecast by Country, 2017 to 2032

Table 23: MEA Market Value (US$ Million) Forecast by Route of administration, 2017 to 2032

Table 24: MEA Market Value (US$ Million) Forecast by End-user, 2017 to 2032
Nikhil Kaitwade
Nikhil Kaitwade

Principal Consultant

Talk to Analyst

Find your sweet spots for generating winning opportunities in this market.

List of Charts

Figure 1: Global Market Value (US$ Million) by Route of administration, 2022 to 2032

Figure 2: Global Market Value (US$ Million) by End-user, 2022 to 2032

Figure 3: Global Market Value (US$ Million) by Region, 2022 to 2032

Figure 4: Global Market Value (US$ Million) Analysis by Region, 2017 to 2032

Figure 5: Global Market Value Share (%) and BPS Analysis by Region, 2022 to 2032

Figure 6: Global Market Y-o-Y Growth (%) Projections by Region, 2022 to 2032

Figure 7: Global Market Value (US$ Million) Analysis by Route of administration, 2017 to 2032

Figure 8: Global Market Value Share (%) and BPS Analysis by Route of administration, 2022 to 2032

Figure 9: Global Market Y-o-Y Growth (%) Projections by Route of administration, 2022 to 2032

Figure 10: Global Market Value (US$ Million) Analysis by End-user, 2017 to 2032

Figure 11: Global Market Value Share (%) and BPS Analysis by End-user, 2022 to 2032

Figure 12: Global Market Y-o-Y Growth (%) Projections by End-user, 2022 to 2032

Figure 13: Global Market Attractiveness by Route of administration, 2022 to 2032

Figure 14: Global Market Attractiveness by End-user, 2022 to 2032

Figure 15: Global Market Attractiveness by Region, 2022 to 2032

Figure 16: North America Market Value (US$ Million) by Route of administration, 2022 to 2032

Figure 17: North America Market Value (US$ Million) by End-user, 2022 to 2032

Figure 18: North America Market Value (US$ Million) by Country, 2022 to 2032

Figure 19: North America Market Value (US$ Million) Analysis by Country, 2017 to 2032

Figure 20: North America Market Value Share (%) and BPS Analysis by Country, 2022 to 2032

Figure 21: North America Market Y-o-Y Growth (%) Projections by Country, 2022 to 2032

Figure 22: North America Market Value (US$ Million) Analysis by Route of administration, 2017 to 2032

Figure 23: North America Market Value Share (%) and BPS Analysis by Route of administration, 2022 to 2032

Figure 24: North America Market Y-o-Y Growth (%) Projections by Route of administration, 2022 to 2032

Figure 25: North America Market Value (US$ Million) Analysis by End-user, 2017 to 2032

Figure 26: North America Market Value Share (%) and BPS Analysis by End-user, 2022 to 2032

Figure 27: North America Market Y-o-Y Growth (%) Projections by End-user, 2022 to 2032

Figure 28: North America Market Attractiveness by Route of administration, 2022 to 2032

Figure 29: North America Market Attractiveness by End-user, 2022 to 2032

Figure 30: North America Market Attractiveness by Country, 2022 to 2032

Figure 31: Latin America Market Value (US$ Million) by Route of administration, 2022 to 2032

Figure 32: Latin America Market Value (US$ Million) by End-user, 2022 to 2032

Figure 33: Latin America Market Value (US$ Million) by Country, 2022 to 2032

Figure 34: Latin America Market Value (US$ Million) Analysis by Country, 2017 to 2032

Figure 35: Latin America Market Value Share (%) and BPS Analysis by Country, 2022 to 2032

Figure 36: Latin America Market Y-o-Y Growth (%) Projections by Country, 2022 to 2032

Figure 37: Latin America Market Value (US$ Million) Analysis by Route of administration, 2017 to 2032

Figure 38: Latin America Market Value Share (%) and BPS Analysis by Route of administration, 2022 to 2032

Figure 39: Latin America Market Y-o-Y Growth (%) Projections by Route of administration, 2022 to 2032

Figure 40: Latin America Market Value (US$ Million) Analysis by End-user, 2017 to 2032

Figure 41: Latin America Market Value Share (%) and BPS Analysis by End-user, 2022 to 2032

Figure 42: Latin America Market Y-o-Y Growth (%) Projections by End-user, 2022 to 2032

Figure 43: Latin America Market Attractiveness by Route of administration, 2022 to 2032

Figure 44: Latin America Market Attractiveness by End-user, 2022 to 2032

Figure 45: Latin America Market Attractiveness by Country, 2022 to 2032

Figure 46: Europe Market Value (US$ Million) by Route of administration, 2022 to 2032

Figure 47: Europe Market Value (US$ Million) by End-user, 2022 to 2032

Figure 48: Europe Market Value (US$ Million) by Country, 2022 to 2032

Figure 49: Europe Market Value (US$ Million) Analysis by Country, 2017 to 2032

Figure 50: Europe Market Value Share (%) and BPS Analysis by Country, 2022 to 2032

Figure 51: Europe Market Y-o-Y Growth (%) Projections by Country, 2022 to 2032

Figure 52: Europe Market Value (US$ Million) Analysis by Route of administration, 2017 to 2032

Figure 53: Europe Market Value Share (%) and BPS Analysis by Route of administration, 2022 to 2032

Figure 54: Europe Market Y-o-Y Growth (%) Projections by Route of administration, 2022 to 2032

Figure 55: Europe Market Value (US$ Million) Analysis by End-user, 2017 to 2032

Figure 56: Europe Market Value Share (%) and BPS Analysis by End-user, 2022 to 2032

Figure 57: Europe Market Y-o-Y Growth (%) Projections by End-user, 2022 to 2032

Figure 58: Europe Market Attractiveness by Route of administration, 2022 to 2032

Figure 59: Europe Market Attractiveness by End-user, 2022 to 2032

Figure 60: Europe Market Attractiveness by Country, 2022 to 2032

Figure 61: South Asia Market Value (US$ Million) by Route of administration, 2022 to 2032

Figure 62: South Asia Market Value (US$ Million) by End-user, 2022 to 2032

Figure 63: South Asia Market Value (US$ Million) by Country, 2022 to 2032

Figure 64: South Asia Market Value (US$ Million) Analysis by Country, 2017 to 2032

Figure 65: South Asia Market Value Share (%) and BPS Analysis by Country, 2022 to 2032

Figure 66: South Asia Market Y-o-Y Growth (%) Projections by Country, 2022 to 2032

Figure 67: South Asia Market Value (US$ Million) Analysis by Route of administration, 2017 to 2032

Figure 68: South Asia Market Value Share (%) and BPS Analysis by Route of administration, 2022 to 2032

Figure 69: South Asia Market Y-o-Y Growth (%) Projections by Route of administration, 2022 to 2032

Figure 70: South Asia Market Value (US$ Million) Analysis by End-user, 2017 to 2032

Figure 71: South Asia Market Value Share (%) and BPS Analysis by End-user, 2022 to 2032

Figure 72: South Asia Market Y-o-Y Growth (%) Projections by End-user, 2022 to 2032

Figure 73: South Asia Market Attractiveness by Route of administration, 2022 to 2032

Figure 74: South Asia Market Attractiveness by End-user, 2022 to 2032

Figure 75: South Asia Market Attractiveness by Country, 2022 to 2032

Figure 76: East Asia Market Value (US$ Million) by Route of administration, 2022 to 2032

Figure 77: East Asia Market Value (US$ Million) by End-user, 2022 to 2032

Figure 78: East Asia Market Value (US$ Million) by Country, 2022 to 2032

Figure 79: East Asia Market Value (US$ Million) Analysis by Country, 2017 to 2032

Figure 80: East Asia Market Value Share (%) and BPS Analysis by Country, 2022 to 2032

Figure 81: East Asia Market Y-o-Y Growth (%) Projections by Country, 2022 to 2032

Figure 82: East Asia Market Value (US$ Million) Analysis by Route of administration, 2017 to 2032

Figure 83: East Asia Market Value Share (%) and BPS Analysis by Route of administration, 2022 to 2032

Figure 84: East Asia Market Y-o-Y Growth (%) Projections by Route of administration, 2022 to 2032

Figure 85: East Asia Market Value (US$ Million) Analysis by End-user, 2017 to 2032

Figure 86: East Asia Market Value Share (%) and BPS Analysis by End-user, 2022 to 2032

Figure 87: East Asia Market Y-o-Y Growth (%) Projections by End-user, 2022 to 2032

Figure 88: East Asia Market Attractiveness by Route of administration, 2022 to 2032

Figure 89: East Asia Market Attractiveness by End-user, 2022 to 2032

Figure 90: East Asia Market Attractiveness by Country, 2022 to 2032

Figure 91: Oceania Market Value (US$ Million) by Route of administration, 2022 to 2032

Figure 92: Oceania Market Value (US$ Million) by End-user, 2022 to 2032

Figure 93: Oceania Market Value (US$ Million) by Country, 2022 to 2032

Figure 94: Oceania Market Value (US$ Million) Analysis by Country, 2017 to 2032

Figure 95: Oceania Market Value Share (%) and BPS Analysis by Country, 2022 to 2032

Figure 96: Oceania Market Y-o-Y Growth (%) Projections by Country, 2022 to 2032

Figure 97: Oceania Market Value (US$ Million) Analysis by Route of administration, 2017 to 2032

Figure 98: Oceania Market Value Share (%) and BPS Analysis by Route of administration, 2022 to 2032

Figure 99: Oceania Market Y-o-Y Growth (%) Projections by Route of administration, 2022 to 2032

Figure 100: Oceania Market Value (US$ Million) Analysis by End-user, 2017 to 2032

Figure 101: Oceania Market Value Share (%) and BPS Analysis by End-user, 2022 to 2032

Figure 102: Oceania Market Y-o-Y Growth (%) Projections by End-user, 2022 to 2032

Figure 103: Oceania Market Attractiveness by Route of administration, 2022 to 2032

Figure 104: Oceania Market Attractiveness by End-user, 2022 to 2032

Figure 105: Oceania Market Attractiveness by Country, 2022 to 2032

Figure 106: MEA Market Value (US$ Million) by Route of administration, 2022 to 2032

Figure 107: MEA Market Value (US$ Million) by End-user, 2022 to 2032

Figure 108: MEA Market Value (US$ Million) by Country, 2022 to 2032

Figure 109: MEA Market Value (US$ Million) Analysis by Country, 2017 to 2032

Figure 110: MEA Market Value Share (%) and BPS Analysis by Country, 2022 to 2032

Figure 111: MEA Market Y-o-Y Growth (%) Projections by Country, 2022 to 2032

Figure 112: MEA Market Value (US$ Million) Analysis by Route of administration, 2017 to 2032

Figure 113: MEA Market Value Share (%) and BPS Analysis by Route of administration, 2022 to 2032

Figure 114: MEA Market Y-o-Y Growth (%) Projections by Route of administration, 2022 to 2032

Figure 115: MEA Market Value (US$ Million) Analysis by End-user, 2017 to 2032

Figure 116: MEA Market Value Share (%) and BPS Analysis by End-user, 2022 to 2032

Figure 117: MEA Market Y-o-Y Growth (%) Projections by End-user, 2022 to 2032

Figure 118: MEA Market Attractiveness by Route of administration, 2022 to 2032

Figure 119: MEA Market Attractiveness by End-user, 2022 to 2032

Figure 120: MEA Market Attractiveness by Country, 2022 to 2032

Recommendations

Chemicals & Materials

Carboxymethyl Cellulose Market

Published : July 2023

Explore Chemicals & Materials Insights

View Reports