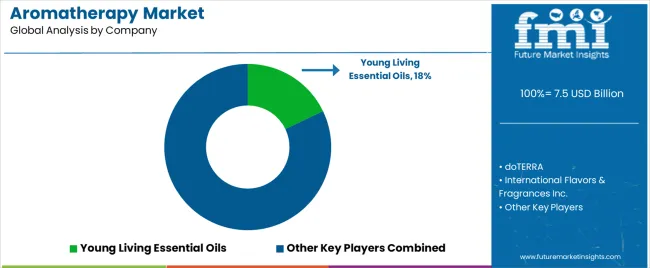
Aromatherapy Market
Aromatherapy Market receiving traction amid rising Awareness of Essential Oils Medicinal Applications
Aromatherapy Market by Product, Application, Mode of Delivery, Distribution Channel and Regional | Forecast 2022 to 2032
Aromatherapy Market Snapshot (2022 to 2032)
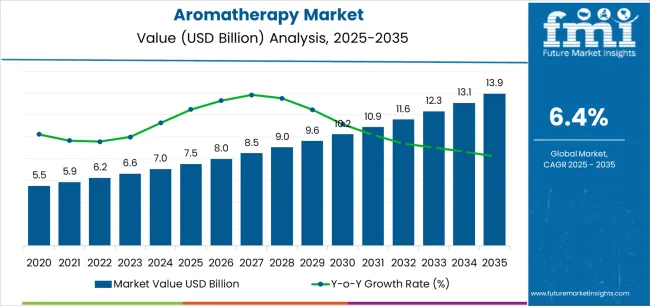
The global aromatherapy market is forecasted to be valued at US$ 5.9 Billion in 2022. The growing usage of aromatherapy for a wide range of health-related advantages is expected to drive the worldwide aromatherapy industry. The overall demand for the aromatherapy market is projected to grow at a CAGR of 8.1% between 2022 and 2032, totaling around US$ 12.9 Billion by 2032.
Consumer choice for aromatherapy was greatly influenced by the COVID-19 worldwide pandemic, which resulted in a decrease in medical tourism and cosmetic operations. In contrast, with increased scientific evidence supporting the efficacy of aromatherapy and topical essential oil therapies for pain relief in disorders such as dysmenorrhea, the market is expected to exhibit significant growth traction in the anticipated years.
Essential oils and aromatherapy goods are regulated on the market in compliance with macro and industry standards. There are numerous hospital-based aromatherapy programs originating in developed nations, which is another major driver projected to support aromatherapy market expansion. The development of inhalation aromatherapy for the treatment of sleep issues such as insomnia is significant market advancement.
Data Points |
Key Statistics |
Aromatherapy Market Value 2022 |
US$ 5.9 Billion |
Aromatherapy Market Projected Value (2032) |
US$ 12.9 Billion |
Aromatherapy Market CAGR (2022 to 2032) |
8.1% |
Let us know your requirement to get
100% FREE customization
Aromatherapy Demand Analysis (2016 to 2021) Vs Market Outlook (2022 to 2032)
The global demand for aromatherapy is projected to increase at a CAGR of 8.1% during the forecast period between 2022 and 2032, reaching a total of US$ 12.9 Billion in 2032, according to a report from Future Market Insights (FMI). From 2016 to 2021, sales witnessed significant growth, registering a CAGR of 6.5%.
Aromatherapy is a holistic therapeutic alternative or supplementary treatment that uses aromatic ingredients such as essential oils derived from plants. Aromatherapy is a sort of medicine that uses aromatic essential oils to promote the health of the body, mind, and spirit. It enhances both physical and mental well-being. The aromatherapy sector is predicted to grow greatly in the future due to its wide variety of uses and low side effects. As more people become aware of the benefits of essential oils, the market will grow, particularly among patients suffering from skin disorders and acne.
Because of its capacity to produce hormones such as endorphins and oxytocin, aromatherapy is perfect for stress relief, anxiety alleviation, and insomnia treatment. As a result, the widespread availability of essential oils, along with suggestions from wellness specialists, is likely to drive considerable expansion in the aromatherapy industry. Taking these factors into account, the market for aromatherapy products is expected to grow at an 8.1% CAGR to US$ 8.06 Billion by 2032.
Which Drivers underpin Aromatherapy Industry Expansion?
Aromatherapy is becoming increasingly popular among Wellness Professionals
Many wellness professionals, including spa therapists, aroma therapists, massage therapists, and gym trainers, prefer single and blended essential oils for the treatment of insomnia, anxiety, pain, agitation, stress, and other conditions because essential oils provide the desired therapeutic effects with minimal or no side effects. This is due to the fact that these treatments may be conducted without the use of medicines.
A Strong Distribution Network is Generating High-Growth Opportunities
One of the major factors driving the growth of the global aromatherapy industry is a strong distribution network. Several prominent essential oil makers are negotiating distribution arrangements with large retail corporations to make their goods available, which will result in greater penetration of aromatherapy treatments and products.
Thus, the growing preference of wellness professionals for an aromatherapy massage for relaxation is likely to contribute to the aromatherapy market's revenue development.
Find your sweet spots for generating winning opportunities in this market.
Talk to AnalystWhich Factors are limiting the Growth of Aromatherapy Market?
Rising Side-effects of Holistic Therapy & Strict Regulatory Environment
Aromatherapy is thought to have weak scientific support in numerous areas. The vast majority of essential oils are entirely risk-free. When utilizing them, however, there are some precautions to take and side effects to be aware of.
There is a paucity of data to support the use of holistic therapy in the treatment of Alzheimer's disease, Parkinson's disease, and heart disease, which will restrict the market growth.
Manifold Beneficial Properties of Aromatherapy Gaining Cognizance in Europe
The Europe aromatherapy market is being fuelled by the growing shift towards more natural and green methods to promote mental health, as witnessed among European customers. This, combined with the fast-paced and hectic work schedules that call for ways to ease the nerves and tension, is accelerating the expansion of the aromatherapy market size in European countries. Over the forecast period, the trend of using essential oils as a complementary treatment to traditional healing methods owing to their beneficial properties is expected to boost the demand for aromatherapy. Several aromatherapy benefits include improved sleep, reduced stress, depression, and anxiety, a better quality of life, enhanced relaxation, etc.
Further, the market is being aided by the availability of different types of aromatherapy in the region. These can be classified as cosmetic, massage, olfactory, medical, and aromatherapy. The extensive range of premium aromatherapy products for natural skincare is expected to help the market progress over the course of the forecast period. Such holistic therapy treatments have been gaining cognizance from the nascent stage of the aromatherapy market in the region and have since enjoyed heightened growth. Developments by aromatherapy brand VedAroma Essential Oils, which are certified organic, are also predicted to facilitate the expansion of the aromatherapy market size in the region.

A unified Market Research Subscription Platform, built for today's disparate research needs.
Rising Inclination of Japanese Consumers Towards Wellness-Promoting Products to Propel Aromatherapy Market in Japan
The Japanese aromatherapy market is predicted to observe continued growth in the forthcoming years due to the high rate of consumption of beauty products and cosmetics in the region. The dense population of every premium fragrance and aromatherapy brand in Japan due to the substantial percentage of Japanese consumers' budgets being devoted to wellness-promoting products is expected to support the demand for aromatherapy products. The strong herbal traditions in the Asia Pacific region,
grounded in the usage of local essential oils and plant derivatives for aromatherapy massage, are also anticipated to promote market growth over the forecast period.
The development of innovative products in the aroma market also contributes to the growth of aromatherapy in Japan.
For instance, in 2017, Sony Corp. expanded its marketing channels and initiated new approaches to promote a portable aroma diffuser called aromatic Walkman, introduced a year back. This aromatherapy
diffuser lets people carry their favorite fragrances around and savor their aromas uniquely without offending people nearby. The market is further being propelled by the distribution of aromatherapy
oil and related products via online channels. The use of online channels to distribute various commercial products, especially after the lockdown measures undertaken during the coronavirus outbreak, has increased rapidly in recent years. Additionally, the usage of aromatherapy is incorporated into the self-care system among the citizens of Japan.
Growing Demand for Nature-Based Experience Offered by Aromatherapy in South Korea to Bolster the Market Growth
The South Korean aromatherapy market is propelled by the manifold advantages of applying essential oils to the human body. Koreans use aromatherapy for anxiety reduction and to help promote holistic health. Further, the rising interest in aromatherapy, combined with the ongoing research to gain an understanding of aromatherapy to treat diseases and improve health via nature-based experience, is expected to stimulate the market expansion of aromatherapy. Moreover, the surging prevalence of chronic diseases in South Korea is expected to provide beneficial opportunities for market growth over the coming years.
Additionally, new product developments by key players and strategic collaborations are expected to support market growth in the forecast period. Other factors, including the growing adoption rate of aromatherapy, evolving lifestyles, and aromatherapy’s non-invasive nature, spur market growth. In July 2021, Aromatica’s Zero Station, a zero-waste cultural space, was launched in Seoul, South Korea. The brand specializes in tea and combines aromatherapy with tea culture. The customers can experience organic and natural raw materials and essential oils utilized in Aromatica’s products, displayed on the station. The innovative usage of aromatherapy is expected to influence the market positively.
Region-wise Insights
Will North America Continue Dominance in the Global Aromatherapy Market?
Increasing Public Awareness of the Numerous Advantages of Aromatherapy Products to Boost Market Growth
Owing to the presence of important market competitors in the area, as well as growing healthcare spending, North America is likely to maintain its leadership position in the worldwide aromatherapy market.
Growing sales of essential oil for home use, lifestyle changes, a growing urban population, and the increased influence of the media are all factors boosting demand for aromatherapy goods in the region.
Furthermore, increased awareness of the benefits of alternative therapies is expected to drive sales of aromatherapy goods in the future years. The market in the USA is predicted to develop as patients' tastes move toward natural therapeutic solutions for the treatment of stress, anxiety, and depression, as well as the implementation of more favorable legislation and regulations for essential oil farming.
Innovative isolates derived from present essential oils of diverse compositions are projected to provide aromatherapy businesses around the country with several new business opportunities. For some years, the demand for essential oils has been expanding in the USA. Rising Internet users in the USA are expected to increase demand for aromatherapy diffusers purchased through online vendors.
Where does the growth of the Aromatherapy Market in Europe stand?
Increasing Disposable Income to fuel Market Growth
The aromatherapy market in Europe is expected to expand significantly over the forecast period. The rising popularity of aromatherapy as a therapeutic and pharmacological alternative is expected to drive market expansion in Europe. The majority of essential oils are sold in European nations including the United Kingdom, Germany, the Netherlands, Belgium, and Ireland.
Since Europe is one of the leading essential oil importers and has a high prevalence of chronic pain and depression; there is a high demand for aromatherapy oils among the European population.
How Will the Growth of the Aromatherapy Market unfold in East Asia?
Latest Techniques of Production and Patterns of Employment in ICTs in the Region to Accelerate Market Growth
During the projected period, the East Asia aromatherapy market is expected to grow. Many countries in the area are rapidly embracing new trends and technology. Profitable trade opportunities for essential oils in countries such as Japan and China, along with an increase in the frequency of different disorders, are expected to boost the Asia-Pacific aromatherapy industry.
Aromatherapy's rising popularity as a therapeutic and pharmacological alternative is expected to drive market growth in China. China's market growth is being driven by rising demand for organic cosmetics and cosmetic products, medicines, and nutritional supplements, as well as growing health and wellness sectors.
This market expansion may be attributed to increased awareness of aromatherapy's health benefits, high essential oil output, and appealing trade prospects for essential oils, as well as a rise in the prevalence of different disorders.
Category-wise Insights
Which Aromatherapy Product Is Becoming Extremely Popular?
Aromatherapy Diffusers are becoming more popular due to their ability to retain the therapeutic properties of essential oils
Aromatherapy diffusers are one of the most secure methods of ingesting essential oils. Aromatherapy diffusers are increasingly being used at home to combat odors. Fragrance diffusers may also assist to deodorize and relax the atmosphere in the house.
The use of essential oils such as chamomile oil, patchouli oil, lemon oil, or lavender oil promotes a stress-free environment. Furthermore, airborne dispersion of essential oils combats bacteria and reduces the toxicity of pollutants in the air, increasing atmospheric oxygen. As a result, a rising number of individuals are purchasing aromatherapy diffusers and essential oils for a variety of objectives. The availability of various types of aromatherapy diffusers, such as mobilizing diffusers, ultrasonic diffusers, evaporative diffusers, and heat diffusers, will also contribute to the aromatherapy market's revenue growth throughout the forecast period.
The Start-up Ecosystem: How key Players are opening Frontiers for Future Growth?
With growing awareness as well as the convenience of online shopping, the aromatherapy market is thriving. More and more start-ups are diving into this niche lately. Here are some examples of major start-ups in the aromatherapy market.
- The National Association for Holistic Aromatherapy is a non-profit 501(c) 3 organization dedicated to the holistic integration and teaching of aromatherapy into a wide range of alternative healthcare practices, including self-care and home pharmacy. They provide the public, practitioners, companies, product designers, bloggers/writers, educators, healthcare experts, and the media with scientific, empirical, and up-to-date information about aromatherapy and essential oils. NAHA is actively committed to developing and upgrading academic standards in aromatherapy education as well as professional practice standards. NAHA is also committed to raising public awareness and understanding of aromatherapy and its safe and effective application in daily life.
- The Alliance of International Aromatherapists (AIA), founded in 2006, is the professional body that represents aromatherapists. They are a 501(c)(3) non-profit organization whose mission is to improve knowledge of and access to aromatherapists, assist its members in developing successful practices, grow the corpus of aromatherapy research, and serve as a resource for our members, the media, and the general public. AIA acknowledges the significance of higher educational requirements for Advanced Practitioner Aromatherapists and the relevance of sustaining them. The AIA began its School Recognition Program in 2009, making it the first organization in the United States to develop the most complete educational criteria for Advanced Practitioner Aromatherapists.
Who are the Leading Players in the Aromatherapy Market?
Some aromatherapy product manufacturers have used multi-level marketing tactics to improve product distribution and have hired a large number of independent distributors. As a result, increased accessibility and affordability of aromatherapy goods are likely to stimulate global demand for essential oils and aromatherapy diffuser products.
A broad marketing network of distributors benefits both global and local market participants. Additionally, firms are offering their aromatherapy goods online, which are projected to assist the aromatherapy market's growth.
Recent Developments:
- In October 2022, International Flavors & Fragrances Inc. announced the opening of its new Singapore Innovation Center, the first in the company's global network of research, creative, and application centers to combine the technologies, capabilities, and expertise of all four business divisions: Nourish, Health & Biosciences, Scent, and Pharma Solutions. It is the largest IFF facility in the region, measuring over 11,000 square meters.
- In September 2022, Young Living, the global leader in essential oils and essential oil-infused products, received 17 essential oil production patents in usefulness and design from the United States Patent and Trademark Office, more than any other direct sales firm in the world.
Report Scope
Report Attribute |
Details |
Growth Rate |
CAGR of 8.1% from 2022 to 2032 |
Market Value in 2022 |
US$ 5.9 Billion |
Market Value in 2032 |
US$ 12.9 Billion |
Base Year for Estimation |
2021 |
Historical Data |
2016 to 2021 |
Forecast Period |
2022 to 2032 |
Quantitative Units |
Revenue in US$ Million and CAGR from 2022 to 2032 |
Report Coverage |
Revenue Forecast, Company Ranking, Competitive Landscape, Growth Factors, Trends, and Pricing Analysis |
Segments Covered |
|
Regions Covered |
|
Key Countries Profiled |
|
Key Companies Profiled |
|
Key Segments Covered in the Aromatherapy Industry Analysis
Aromatherapy Market by Product:
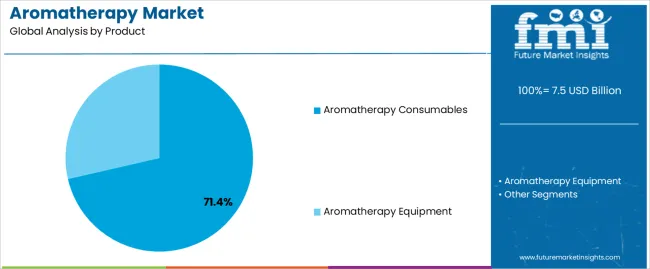
- Aromatherapy Consumables
- Essential Oils
- Floral
- Citrus
- Herbaceous
- Spicy
- Woodsy
- Earthy
- Camphorous
- Others
- Blended Oils
- Carrier Oils
- Essential Oils
- Aromatherapy Equipment
- Nebulizing Diffusers
- Ultrasonic Diffusers
- Evaporative Diffusers
- Heat Diffusers
Aromatherapy Market by Application:
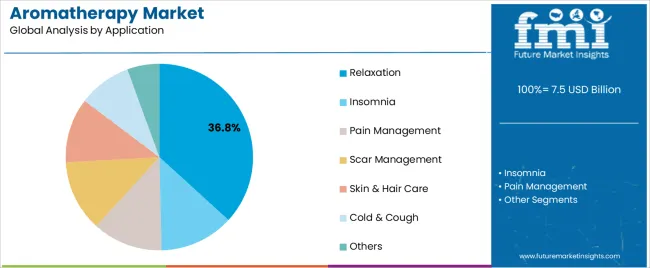
- Relaxation
- Insomnia
- Pain Management
- Scar Management
- Skin & Hair Care
- Cold & Cough
- Others
Aromatherapy Market by Mode of Delivery:
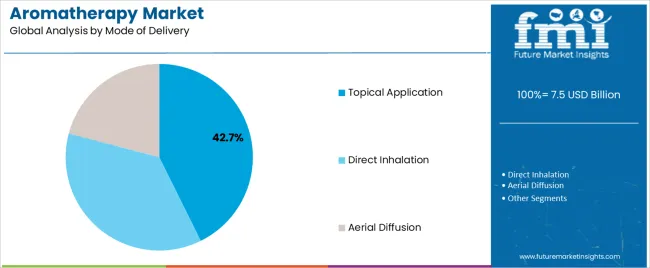
- Topical Application
- Direct Inhalation
- Aerial Diffusion
Aromatherapy Market by Distribution Channel:
- Aromatherapy Products Sold at Retail Shops
- Aromatherapy Products Sold through Online Channels
- Direct Distribution of Aromatherapy Products
Aromatherapy Market by Region:
- North America Aromatherapy Market
- Latin America Aromatherapy Market
- Western Europe Aromatherapy Market
- Eastern Europe Aromatherapy Market
- Asia Pacific Excluding Japan Aromatherapy Market
- Japan Aromatherapy Market
- Middle East & Africa Aromatherapy Market
Frequently Asked Questions
At what value did the aromatherapy market close in 2022?
By 2022-end, sales of aromatherapy closed at a value of US$ 5.9 Billion
What was the last 4 years value CAGR for aromatherapy market value?
From 2017 to 2021, aromatherapy demand expanded at a CAGR of 6.5%
What is the projected forecast CAGR for the aromatherapy industry from 2022 to 2032?
From 2022 to 2032, aromatherapy sales are expected to flourish at a CAGR of 8.1%
According to FMI, what is the anticipated market value for aromatherapy in 2032?
By 2032, the market value of aromatherapy expected to reach US$ 12.9 Billion
By product, which category ranks first with regard aromatherapy?
By product, aromatherapy is expected to dominate the market in 2022.
Table of Content
1. Executive Summary | Aromatherapy Market 1.1. Global Market Outlook 1.2. Analysis and Recommendations 2. Market Overview 2.1. Market Coverage / Taxonomy 2.2. Market Definition / Scope / Limitations 3. Market Dynamics 3.1. Macro-Economic Factors 3.2. Drivers 3.2.1. Supply Side Drivers 3.2.2. Demand Side Drivers 3.3. Restraints 3.4. Opportunities 3.5. Trends 4. Market Context 4.1. Value Chain 4.2. Key Marketing Strategies 4.3. Regulations 5. Global Market Value Analysis 2016 to 2021 and Forecast, 2022 to 2032 5.1. Historical Market Value (US$ Million) Analysis, 2016 to 2021 5.2. Current and Future Market Value (US$ Million) Projections, 2022 to 2032 5.2.1. Y-o-Y Growth Trend Analysis 5.2.2. Absolute $ Opportunity Analysis 6. Global Market Analysis 2016 to 2021 and Forecast 2022 to 2032, by Product Type 6.1. Introduction / Key Findings 6.2. Historical Market Size (US$ Million) Analysis By Product Type, 2016 to 2021 6.3. Current and Future Market Size (US$ Million) Analysis and Forecast By Product Type, 2022 to 2032 6.3.1. Consumables 6.3.1.1. Essential Oils 6.3.1.1.1. Floral 6.3.1.1.2. Citrus 6.3.1.1.3. Herbaceous 6.3.1.1.4. Spicy 6.3.1.1.5. Woodsy 6.3.1.1.6. Earthy 6.3.1.1.7. Camphorous 6.3.1.1.8. Others 6.3.1.2. Blended Oils 6.3.1.3. Carrier Oils 6.3.2. Equipment 6.3.2.1. Nebulizing Diffuser 6.3.2.2. Ultrasonic Diffuser 6.3.2.3. Evaporative Diffuser 6.3.2.4. Heat Diffuser 6.4. Market Attractiveness Analysis By Product Type 7. Global Market Analysis 2016 to 2021 and Forecast 2022 to 2032, by Mode of Delivery 7.1. Introduction / Key Findings 7.2. Historical Market Size (US$ Million) Analysis By Distribution Channel, 2016 to 2021 7.3. Current and Future Market Size (US$ Million) Analysis and Forecast By Distribution Channel, 2022 to 2032 7.3.1. Topical Application 7.3.2. Direct Inhalation 7.3.3. Aerial Diffusion 7.4. Market Attractiveness Analysis By Mode of Delivery 8. Global Market Analysis 2016 to 2021 and Forecast 2022 to 2032, by Application 8.1. Introduction / Key Findings 8.2. Historical Market Size (US$ Million) Analysis By Distribution Channel, 2016 to 2021 8.3. Current and Future Market Size (US$ Million) Analysis and Forecast By Distribution Channel, 2022 to 2032 8.3.1. Relaxation 8.3.2. InsoMillionia 8.3.3. Pain Management 8.3.4. Scar Management 8.3.5. Skin & Hair Care 8.3.6. Cold & Cough 8.3.7. Others 8.4. Market Attractiveness Analysis By Application 9. Global Market Analysis 2016 to 2021 and Forecast 2022 to 2032, by Distribution Channel 9.1. Introduction / Key Findings 9.2. Historical Market Size (US$ Million) Analysis By Distribution Channel, 2016 to 2021 9.3. Current and Future Market Size (US$ Million) Analysis and Forecast By Distribution Channel, 2022 to 2032 9.3.1. Retail Shops 9.3.2. Online Channel 9.3.3. Direct Distribution 9.4. Market Attractiveness Analysis By Distribution Channel 10. Global Market Analysis 2016 to 2021 and Forecast 2022 to 2032, by Region 10.1. Introduction 10.2. Historical Market Size (US$ Million) Analysis By Region, 2016 to 2021 10.3. Current Market Size (US$ Million) Analysis and Forecast by Region, 2022 to 2032 10.3.1. North America 10.3.2. Latin America 10.3.3. Western Europe 10.3.4. Eastern Europe 10.3.5. Asia-Pacific Excluding Japan 10.3.6. Japan 10.3.7. Middle East & Africa 10.4. Market Attractiveness Analysis By Region 11. North America Market Analysis 2016 to 2021 and Forecast 2022 to 2032 11.1. Introduction 11.2. Historical Market Size (US$ Million) Trend Analysis By Market Taxonomy, 2016 to 2021 11.3. Market Size (US$ Million) Forecast By Market Taxonomy, 2022 to 2032 11.3.1. By Country 11.3.1.1. USA 11.3.1.2. Canada 11.3.2. By Product Type 11.3.3. By Mode of Delivery 11.3.4. By Application 11.3.5. By Distribution Channel 11.4. Market Attractiveness Analysis 11.5. Regional Trends 11.6. Key Impact Analysis 12. Latin America Market Analysis 2016 to 2021 and Forecast 2022 to 2032 12.1. Introduction 12.2. Historical Market Size (US$ Million) Trend Analysis By Market Taxonomy, 2016 to 2021 12.3. Market Size (US$ Million) Forecast By Market Taxonomy, 2022 to 2032 12.3.1. By Country 12.3.1.1. Argentina 12.3.1.2. Brazil 12.3.1.3. Mexico 12.3.1.4. Rest of Latin America 12.3.2. By Product Type 12.3.3. By Mode of Delivery 12.3.4. By Application 12.3.5. By Distribution Channel 12.4. Market Attractiveness Analysis 12.5. Regional Trends 12.6. Key Impact Analysis 13. Western Europe Market Analysis 2016 to 2021 and Forecast 2022 to 2032 13.1. Introduction 13.2. Historical Market Size (US$ Million) Trend Analysis By Market Taxonomy, 2016 to 2021 13.3. Market Size (US$ Million) Forecast By Market Taxonomy, 2022 to 2032 13.3.1. By Country 13.3.1.1. United Kingdom 13.3.1.2. France 13.3.1.3. Germany 13.3.1.4. Spain 13.3.1.5. Italy 13.3.1.6. Nordics 13.3.1.7. Benelux 13.3.1.8. Rest of Western Europe 13.3.2. By Product Type 13.3.3. By Mode of Delivery 13.3.4. By Application 13.3.5. By Distribution Channel 13.4. Market Attractiveness Analysis 13.5. Regional Trends 13.6. Key Impact Analysis 14. Eastern Europe Market Analysis 2016 to 2021 and Forecast 2022 to 2032 14.1. Introduction 14.2. Historical Market Size (US$ Million) Trend Analysis by Market Taxonomy, 2016 to 2021 14.3. Market Size (US$ Million) Forecast By Market Taxonomy, 2022 to 2032 14.3.1. By Country 14.3.1.1. Russia 14.3.1.2. Poland 14.3.1.3. Rest of Eastern Europe 14.3.2. By Product Type 14.3.3. By Mode of Delivery 14.3.4. By Application 14.3.5. By Distribution Channel 14.4. Market Attractiveness Analysis 14.5. Regional Trends 14.6. Key Impact Analysis 15. Asia-Pacific Excluding Japan (APEJ) Market Analysis 2016 to 2021 and Forecast 2022 to 2032 15.1. Introduction 15.2. Historical Market Size (US$ Million) Trend Analysis by Market Taxonomy, 2016 to 2021 15.3. Market Size (US$ Million) Forecast By Market Taxonomy, 2022 to 2032 15.3.1. By Country 15.3.1.1. China 15.3.1.2. India 15.3.1.3. Australia and New Zealand 15.3.1.4. ASEAN 15.3.1.5. Rest of Asia Pacific 15.3.2. By Product Type 15.3.3. By Mode of Delivery 15.3.4. By Application 15.3.5. By Distribution Channel 15.4. Market Attractiveness Analysis 15.5. Regional Trends 15.6. Key Impact Analysis 16. Middle East and Africa Market Analysis 2016 to 2021 and Forecast 2022 to 2032 16.1. Introduction 16.2. Historical Market Size (US$ Million) Trend Analysis by Market Taxonomy, 2016 to 2021 16.3. Market Size (US$ Million) Forecast By Market Taxonomy, 2022 to 2032 16.3.1. By Country 16.3.1.1. GCC Countries 16.3.1.2. South Africa 16.3.1.3. Rest of Middle East and Africa 16.3.2. By Product Type 16.3.3. By Mode of Delivery 16.3.4. By Application 16.3.5. By Distribution Channel 16.4. Market Attractiveness Analysis 16.5. Regional Trends 16.6. Key Impact Analysis 17. Japan Market Analysis 2016 to 2021 and Forecast 2022 to 2032 17.1. Introduction 17.2. Historical Market Size (US$ Million) Trend Analysis By Market Taxonomy, 2016 to 2021 17.3. Market Size (US$ Million) Forecast By Market Taxonomy, 2022 to 2032 17.3.1. By Product Type 17.3.2. By Mode of Delivery 17.3.3. By Application 17.3.4. By Distribution Channel 17.4. Market Attractiveness Analysis 17.5. Regional Trends 17.6. Key Impact Analysis 18. Competition Analysis 18.1. Competition Dashboard 18.2. Competition Deep Dive 18.2.1. Young Living Essential Oils 18.2.1.1. Company Overview 18.2.1.2. Segment Overview 18.2.1.3. Key Developments 18.2.1.4. Strategy Overview 18.2.2. doTERRA 18.2.2.1. Company Overview 18.2.2.2. Segment Overview 18.2.2.3. Key Developments 18.2.2.4. Strategy Overview 18.2.3. Mountain Rose Herbs 18.2.3.1. Company Overview 18.2.3.2. Segment Overview 18.2.3.3. Key Developments 18.2.3.4. Strategy Overview 18.2.4. Edens Garden 18.2.4.1. Company Overview 18.2.4.2. Segment Overview 18.2.4.3. Key Developments 18.2.4.4. Strategy Overview 18.2.5. Frontier Natural Products Co-op. 18.2.5.1. Company Overview 18.2.5.2. Segment Overview 18.2.5.3. Key Developments 18.2.5.4. Strategy Overview 18.2.6. Rocky Mountain Oils 18.2.6.1. Company Overview 18.2.6.2. Segment Overview 18.2.6.3. Key Developments 18.2.6.4. Strategy Overview 18.2.7. Plant Therapy Essential Oils 18.2.7.1. Company Overview 18.2.7.2. Segment Overview 18.2.7.3. Key Developments 18.2.7.4. Strategy Overview 18.2.8. First Natural Brands LTD. (Tisserand) 18.2.8.1. Company Overview 18.2.8.2. Segment Overview 18.2.8.3. Key Developments 18.2.8.4. Strategy Overview 18.2.9. Soulflower 18.2.9.1. Company Overview 18.2.9.2. Segment Overview 18.2.9.3. Key Developments 18.2.9.4. Strategy Overview 19. Assumptions and Acronyms Used 20. Research Methodology
Let us know your requirement to get
100% FREE customization
List of Tables
Table 01: Market Value (US$ Million) Growth Comparison Table 02: Global Market Value (US$ Million) Analysis and Opportunity Assessment 2016 to 2032, By Product Type Table 03: Global Market Value (US$ Million) Analysis and Opportunity Assessment 2016 to 2032, By Product Type Table 04: Global Market Value (US$ Million) Analysis and Opportunity Assessment 2016 to 2032, By Mode of Delivery Table 05: Global Market Value (US$ Million) Analysis and Opportunity Assessment 2016 to 2032, By Distribution Channel Table 06: Global Market Value (US$ Million) Analysis and Opportunity Assessment 2016 to 2032, By Country Table 07: North America Market Value (US$ Million) Analysis 2016 to 2021 and Forecast 2022 to 2032, By Country Table 08: North America Market Value (US$ Million) Analysis 2016 to 2021 and Forecast 2022 to 2032, By Product Table 09: North America Market Value (US$ Million) Analysis 2016 to 2021 and Forecast 2022 to 2032, By Application Table 10: North America Market Value (US$ Million) Analysis 2016 to 2021 and Forecast 2022 to 2032, By Mode of Delivery Table 11: North America Market Value (US$ Million) Analysis 2016 to 2021 and Forecast 2022 to 2032, By Distribution Channel Table 12: Latin America Market Value (US$ Million) Analysis 2016 to 2021 and Forecast 2022 to 2032, By Product Table 13: Latin America Market Value (US$ Million) Analysis 2016 to 2021 and Forecast 2022 to 2032, By Product Type Table 14: North America Market Value (US$ Million) Analysis 2016 to 2021 and Forecast 2022 to 2032, By Application Table 15: North America Market Value (US$ Million) Analysis 2016 to 2021 and Forecast 2022 to 2032, By Mode of Delivery Table 16: North America Market Value (US$ Million) Analysis 2016 to 2021 and Forecast 2022 to 2032, By Distribution Channel Table 17: Western Europe Market Value (US$ Million) Analysis 2016 to 2021 and Forecast 2022 to 2032, By Country Table 18: Western Europe Market Value (US$ Million) Analysis 2016 to 2021 and Forecast 2022 to 2032, By Product Table 19: North America Market Value (US$ Million) Analysis 2016 to 2021 and Forecast 2022 to 2032, By Application Table 20: North America Market Value (US$ Million) Analysis 2016 to 2021 and Forecast 2022 to 2032, By Mode of Delivery Table 21: North America Market Value (US$ Million) Analysis 2016 to 2021 and Forecast 2022 to 2032, By Distribution Channel Table 22: Eastern Europe Market Value (US$ Million) Analysis 2016 to 2021 and Forecast 2022 to 2032, By Country Table 23: Eastern Europe Market Value (US$ Million) Analysis 2016 to 2021 and Forecast 2022 to 2032, By Product Type Table 24: North America Market Value (US$ Million) Analysis 2016 to 2021 and Forecast 2022 to 2032, By Application Table 25: North America Market Value (US$ Million) Analysis 2016 to 2021 and Forecast 2022 to 2032, By Mode of Delivery Table 26: North America Market Value (US$ Million) Analysis 2016 to 2021 and Forecast 2022 to 2032, By Distribution Channel Table 27: APEJ Market Value (US$ Million) Analysis 2016 to 2021 and Forecast 2022 to 2032, By Country Table 28: APEJ Market Value (US$ Million) Analysis 2016 to 2021 and Forecast 2022 to 2032, By Product Type Table 29: North America Market Value (US$ Million) Analysis 2016 to 2021 and Forecast 2022 to 2032, By Application Table 30: North America Market Value (US$ Million) Analysis 2016 to 2021 and Forecast 2022 to 2032, By Mode of Delivery Table 31: North America Market Value (US$ Million) Analysis 2016 to 2021 and Forecast 2022 to 2032, By Distribution Channel Table 32: Middle East and Africa Market Value (US$ Million) Analysis 2016 to 2021 and Forecast 2022 to 2032, By Country Table 33: Middle East and Africa Market Value (US$ Million) Analysis 2016 to 2021 and Forecast 2022 to 2032, By Product Table 34: North America Market Value (US$ Million) Analysis 2016 to 2021 and Forecast 2022 to 2032, By Application Table 35: North America Market Value (US$ Million) Analysis 2016 to 2021 and Forecast 2022 to 2032, By Mode of Delivery Table 36: North America Market Value (US$ Million) Analysis 2016 to 2021 and Forecast 2022 to 2032, By Distribution Channel Table 37: Japan Market Value (US$ Million) Analysis 2016 to 2021 and Forecast 2022 to 2032, By Product Table 38: Japan Market Value (US$ Million) Analysis 2016 to 2021 and Forecast 2022 to 2032, By Application Table 39: Japan Market Value (US$ Million) Analysis 2016 to 2021 and Forecast 2022 to 2032, By Mode of Delivery Table 40: Japan Market Value (US$ Million) Analysis 2016 to 2021 and Forecast 2022 to 2032, By Distribution Channel
Find your sweet spots for generating winning opportunities in this market.
Talk to AnalystList of Charts
Figure 01: Global market forecast 2016 to 2032 Figure 02: Global market size 2016, By Regions Figure 03: Global Market Value Analysis (US$ Million), 2016 to 2021 Figure 04: Global Market Value Forecast (US$ Million), 2022 to 2032 Figure 05: Global Market Absolute $ Opportunity, 2022 to 2032 Figure 06: Comparison of 2017 and 2022, Y-o-Y Forecast Figure 07: Global Market Share Analysis (%), By Product Type, 2022 & 2032 Figure 08: Global Market Y-o-Y Analysis (%), By Product Type, 2022 to 2032 Figure 09: Global Market Attractiveness Analysis by Product Type, 2022 to 2032 Figure 10: Global Market Share Analysis (%), By Application, 2022 & 2032 Figure 11: Global Market Y-o-Y Analysis (%), By Application, 2022 to 2032 Figure 12: Global Market Attractiveness Analysis by Application, 2022 to 2032 Figure 13: Global Market Share Analysis (%), By Mode of Delivery, 2022 & 2032 Figure 14: Global Market Y-o-Y Analysis (%), By Mode of Delivery, 2022 to 2032 Figure 15: Global Market Attractiveness Analysis by Mode of Delivery, 2022 to 2032 Figure 16: Global Market Share Analysis (%), By Distribution Channel, 2022 & 2032 Figure 17: Global Market Y-o-Y Analysis (%), By Distribution Channel, 2022 to 2032 Figure 18: Global Market Attractiveness Analysis by Distribution Channel, 2022 to 2032 Figure 19: Global Market Share Analysis (%), By Region, 2022 & 2032 Figure 20: Global Market Y-o-Y Analysis (%), By Country, 2022 to 2032 Figure 21: Global Market Attractiveness Analysis by Region, 2022 to 2032 Figure 22: North America Companion Animal Drugs Market Value Share, By Product Type, 2022 (E) Figure 23: North America Companion Animal Drugs Market Value Share, By Application, 2022 (E) Figure 24: North America Companion Animal Drugs Market Value Share, By Mode of Delivery, 2022 (E) Figure 25: North America Companion Animal Drugs Market Value Share, By Distribution Channel, 2022 (E) Figure 26: North America Companion Animal Drugs Market Value Share, By Country, 2022 (E) Figure 27: North America Market Value Analysis (US$ Million), 2016 to 2021 Figure 28: North America Market Value Forecast (US$ Million), 2022 to 2032 Figure 29: North America Market Attractiveness Analysis by Product Type, 2022 to 2032 Figure 30: North America Market Attractiveness Analysis by Application, 2022 to 2032 Figure 31: North America Market Attractiveness Analysis by Mode of Delivery, 2022 to 2032 Figure 32: North America Market Attractiveness Analysis by Distribution Channel, 2022 to 2032 Figure 33: North America Market Attractiveness Analysis by Country, 2022 to 2032 Figure 34: Latin America Companion Animal Drugs Market Value Share, By Product Type, 2022 (E) Figure 35: Latin America Companion Animal Drugs Market Value Share, By Application, 2022 (E) Figure 36: Latin America Companion Animal Drugs Market Value Share, By Mode of Delivery, 2022 (E) Figure 37: Latin America Companion Animal Drugs Market Value Share, By Distribution Channel, 2022 (E) Figure 38: Latin America Companion Animal Drugs Market Value Share, By Country, 2022 (E) Figure 39: Latin America Market Value Analysis (US$ Million), 2016 to 2021 Figure 40: Latin America Market Value Forecast (US$ Million), 2022 to 2032 Figure 41: Latin America Market Attractiveness Analysis by Product Type, 2022 to 2032 Figure 42: Latin America Market Attractiveness Analysis by Application, 2022 to 2032 Figure 43: Latin America Market Attractiveness Analysis by Mode of Delivery, 2022 to 2032 Figure 44: Latin America Market Attractiveness Analysis by Distribution Channel, 2022 to 2032 Figure 45: Latin America Market Attractiveness Analysis by Country, 2022 to 2032 Figure 46: Western Europe Companion Animal Drugs Market Value Share, By Product Type, 2022 (E) Figure 47: Western Europe Companion Animal Drugs Market Value Share, By Application, 2022 (E) Figure 48: Western Europe Companion Animal Drugs Market Value Share, By Mode of Delivery, 2022 (E) Figure 49: Western Europe Companion Animal Drugs Market Value Share, By Distribution Channel, 2022 (E) Figure 50: Western Europe Companion Animal Drugs Market Value Share, By Country, 2022 (E) Figure 51: Western Europe Market Value Analysis (US$ Million), 2016 to 2021 Figure 52: Western Europe Market Value Forecast (US$ Million), 2022 to 2032 Figure 53: Western Europe Market Attractiveness Analysis by Product Type, 2022 to 2032 Figure 54: Western Europe Market Attractiveness Analysis by Application, 2022 to 2032 Figure 55: Western Europe Market Attractiveness Analysis by Mode of Delivery, 2022 to 2032 Figure 56: Western Europe Market Attractiveness Analysis by Distribution Channel, 2022 to 2032 Figure 57: Western Europe Market Attractiveness Analysis by Country, 2022 to 2032 Figure 58: Eastern Europe Companion Animal Drugs Market Value Share, By Product Type, 2022 (E) Figure 59: Eastern Europe Companion Animal Drugs Market Value Share, By Application, 2022 (E) Figure 60: Eastern Europe Companion Animal Drugs Market Value Share, By Mode of Delivery, 2022 (E) Figure 61: Eastern Europe Companion Animal Drugs Market Value Share, By Distribution Channel, 2022 (E) Figure 62: Eastern Europe Companion Animal Drugs Market Value Share, By Country, 2022 (E) Figure 63: Eastern Europe Market Value Analysis (US$ Million), 2016 to 2021 Figure 64: Eastern Europe Market Value Forecast (US$ Million), 2022 to 2032 Figure 65: Eastern Europe Market Attractiveness Analysis by Product Type, 2022 to 2032 Figure 66: Eastern Europe Market Attractiveness Analysis by Application, 2022 to 2032 Figure 67: Eastern Europe Market Attractiveness Analysis by Mode of Delivery, 2022 to 2032 Figure 68: Eastern Europe Market Attractiveness Analysis by Distribution Channel, 2022 to 2032 Figure 69: Eastern Europe Market Attractiveness Analysis by Country, 2022 to 2032 Figure 70: APEJ Companion Animal Drugs Market Value Share, By Product Type, 2022 (E) Figure 71: APEJ Companion Animal Drugs Market Value Share, By Application, 2022 (E) Figure 72: APEJ Companion Animal Drugs Market Value Share, By Mode of Delivery, 2022 (E) Figure 73: APEJ Companion Animal Drugs Market Value Share, By Distribution Channel, 2022 (E) Figure 74: APEJ Companion Animal Drugs Market Value Share, By Country, 2022 (E) Figure 75: APEJ Market Value Analysis (US$ Million), 2016 to 2021 Figure 76: APEJ Market Value Forecast (US$ Million), 2022 to 2032 Figure 77: APEJ Market Attractiveness Analysis by Product Type, 2022 to 2032 Figure 78: APEJ Market Attractiveness Analysis by Application, 2022 to 2032 Figure 79: APEJ Market Attractiveness Analysis by Mode of Delivery, 2022 to 2032 Figure 80: APEJ Market Attractiveness Analysis by Distribution Channel, 2022 to 2032 Figure 81: APEJ Market Attractiveness Analysis by Country, 2022 to 2032 Figure 82: MEA Companion Animal Drugs Market Value Share, By Product Type, 2022 (E) Figure 83: MEA Companion Animal Drugs Market Value Share, By Application, 2022 (E) Figure 84: MEA Companion Animal Drugs Market Value Share, By Mode of Delivery, 2022 (E) Figure 85: MEA Companion Animal Drugs Market Value Share, By Distribution Channel, 2022 (E) Figure 86: MEA Companion Animal Drugs Market Value Share, By Country, 2022 (E) Figure 87: Middle East and Africa Market Value Analysis (US$ Million), 2016 to 2021 Figure 88: Middle East and Africa Market Value Forecast (US$ Million), 2022 to 2032 Figure 89: MEA Market Attractiveness Analysis by Product Type, 2022 to 2032 Figure 90: MEA Market Attractiveness Analysis by Application, 2022 to 2032 Figure 91: MEA Market Attractiveness Analysis by Mode of Delivery, 2022 to 2032 Figure 92: MEA Market Attractiveness Analysis by Distribution Channel, 2022 to 2032 Figure 93: MEA Market Attractiveness Analysis by Country, 2022 to 2032 Figure 94: Japan Companion Animal Drugs Market Value Share, By Product Type, 2022 (E) Figure 95: Japan Companion Animal Drugs Market Value Share, By Application, 2022 (E) Figure 96: Japan Companion Animal Drugs Market Value Share, By Mode of Delivery, 2022 (E) Figure 97: Japan Companion Animal Drugs Market Value Share, By Distribution Channel, 2022 (E) Figure 98: Japan Market Value Analysis (US$ Million), 2016 to 2021 Figure 99: Japan Market Value Forecast (US$ Million), 2022 to 2032 Figure 100: Japan Market Attractiveness Analysis by Product Type, 2022 to 2032 Figure 101: Japan Market Attractiveness Analysis by Application, 2022 to 2032 Figure 102: Japan Market Attractiveness Analysis by Mode of Delivery, 2022 to 2032 Figure 103: Japan Market Attractiveness Analysis by Distribution Channel, 2022 to 2032
Need specific information?
Request CustomizationExplore Healthcare Insights
View Reports